

Large-scale GWAS reveals insights into the genetic architecture of same-sex sexual behavior
- PMID: 31467194
- PMCID: PMC7082777
- DOI: 10.1126/science.aat7693
Large-scale GWAS reveals insights into the genetic architecture of same-sex sexual behavior
Abstract
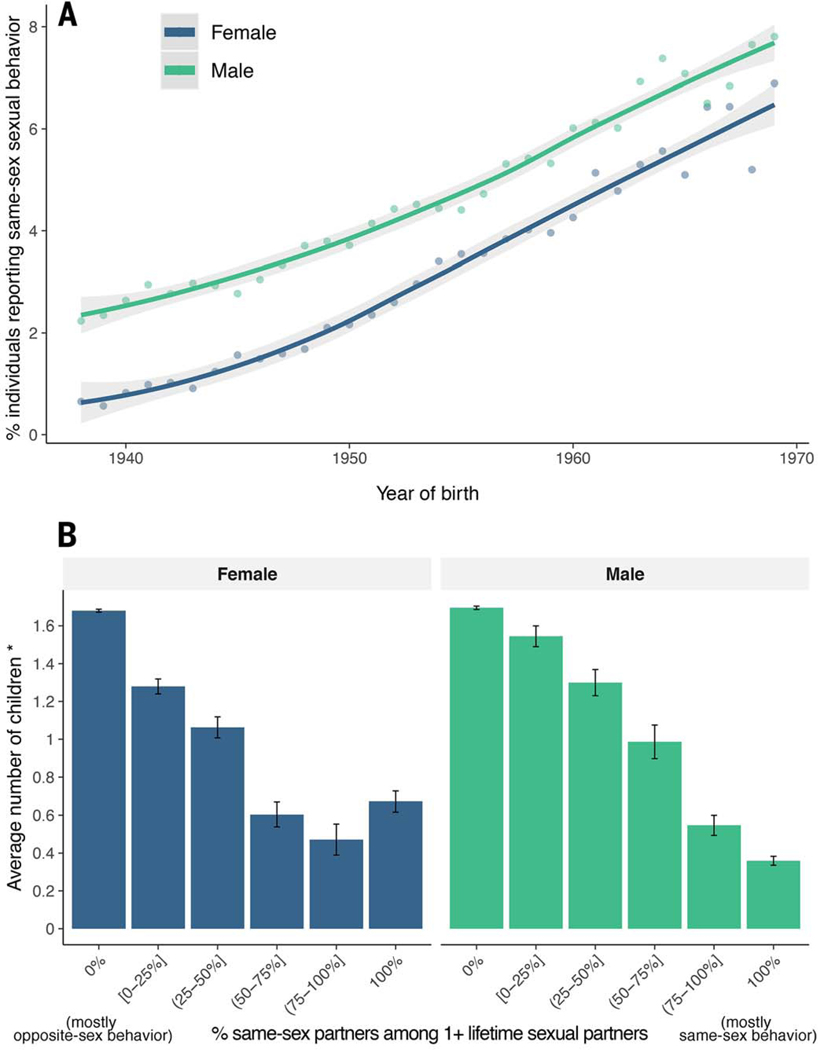
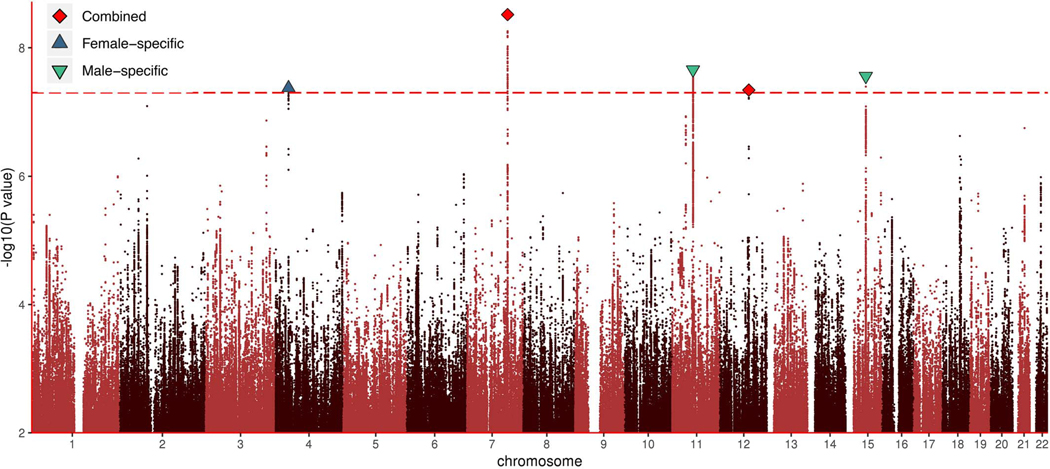
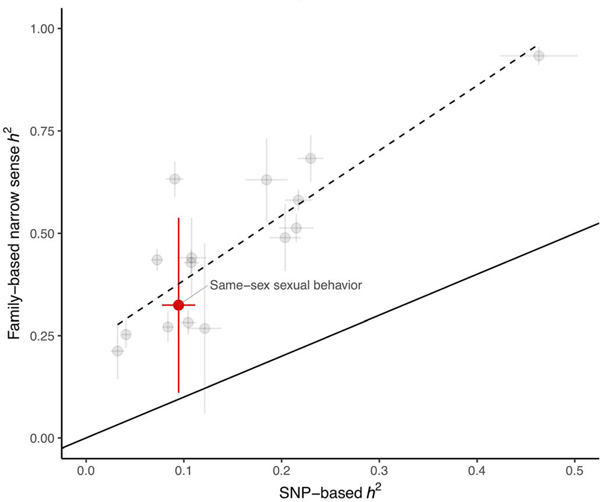
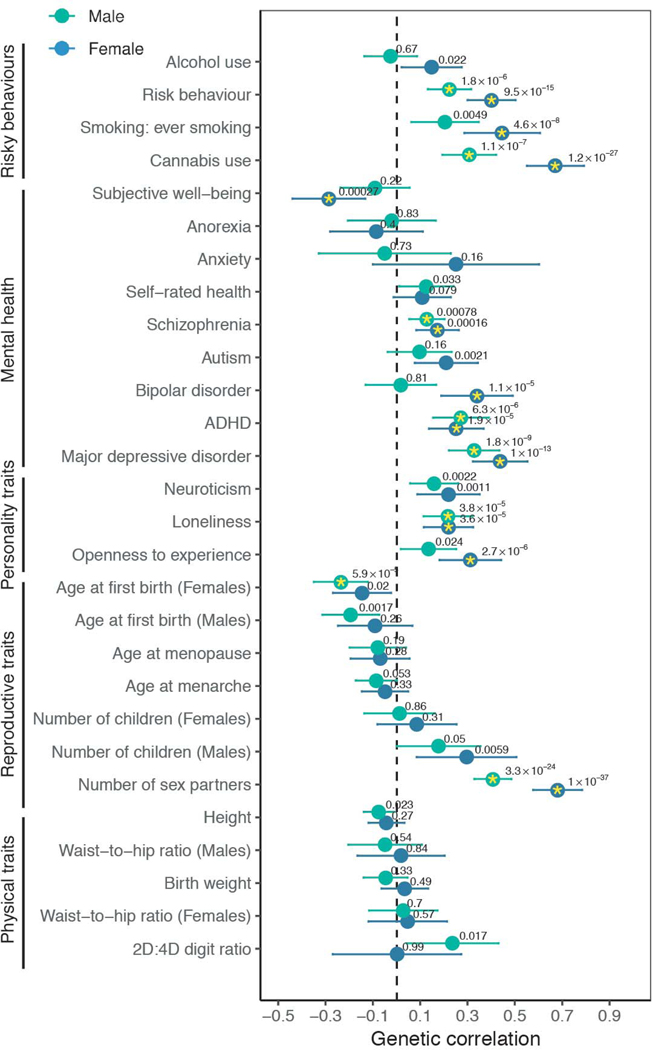
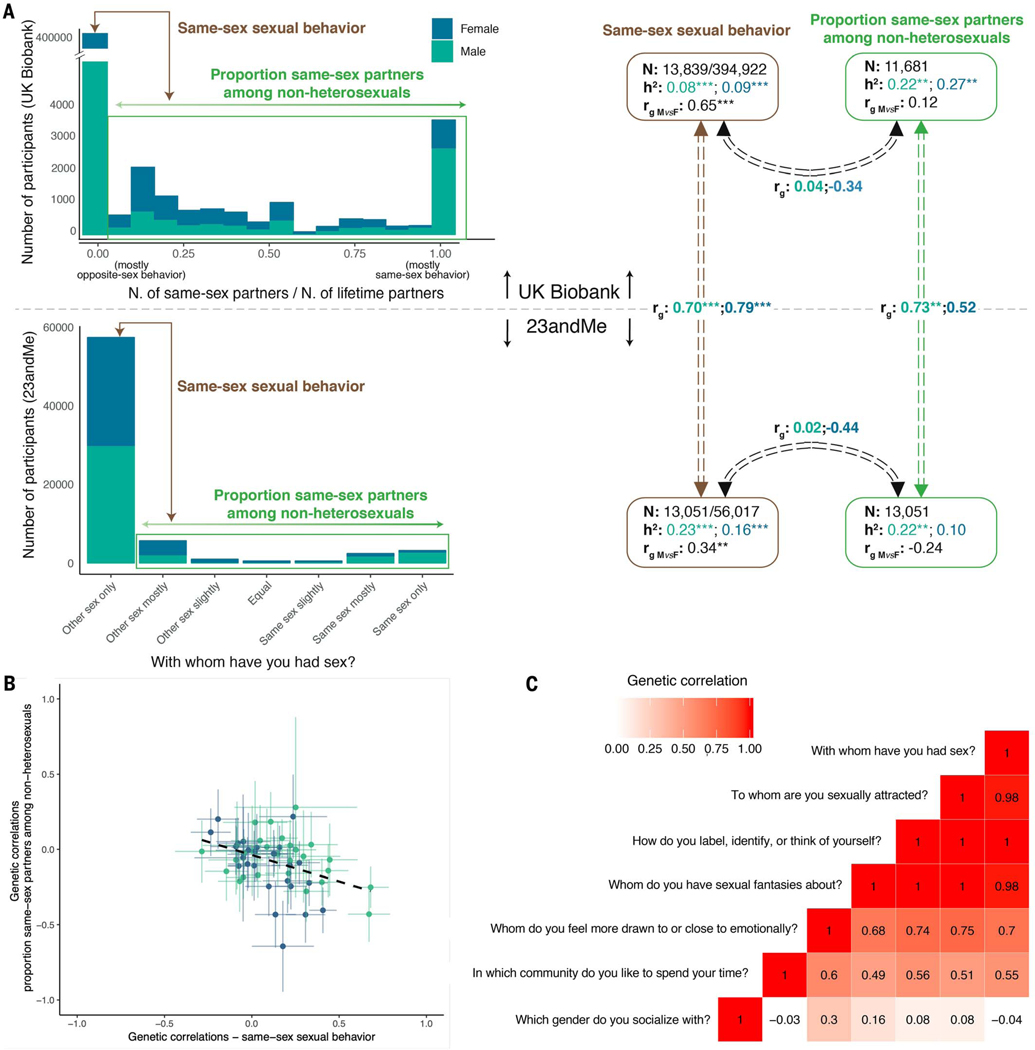
Twin and family studies have shown that same-sex sexual behavior is partly genetically influenced, but previous searches for specific genes involved have been underpowered. We performed a genome-wide association study (GWAS) on 477,522 individuals, revealing five loci significantly associated with same-sex sexual behavior. In aggregate, all tested genetic variants accounted for 8 to 25% of variation in same-sex sexual behavior, only partially overlapped between males and females, and do not allow meaningful prediction of an individual's sexual behavior. Comparing these GWAS results with those for the proportion of same-sex to total number of sexual partners among nonheterosexuals suggests that there is no single continuum from opposite-sex to same-sex sexual behavior. Overall, our findings provide insights into the genetics underlying same-sex sexual behavior and underscore the complexity of sexuality.
Copyright © 2019 The Authors, some rights reserved; exclusive licensee American Association for the Advancement of Science. No claim to original U.S. Government Works.
Figures
Comment in
-
How do genes affect same-sex behavior?Science. 2019 Aug 30;365(6456):869-870. doi: 10.1126/science.aay2726. Science. 2019. PMID: 31467212 No abstract available.
-
No 'gay gene': Massive study homes in on genetic basis of human sexuality.Nature. 2019 Sep;573(7772):14-15. doi: 10.1038/d41586-019-02585-6. Nature. 2019. PMID: 31481774 No abstract available.
-
Controversial 'gay gene' app provokes fears of a genetic Wild West.Nature. 2019 Oct;574(7780):609-610. doi: 10.1038/d41586-019-03282-0. Nature. 2019. PMID: 31664219 No abstract available.
-
Genome studies reveal flaws in broad consent.Science. 2019 Dec 20;366(6472):1460-1461. doi: 10.1126/science.aaz3797. Science. 2019. PMID: 31857475 No abstract available.
-
Genome studies must account for history.Science. 2019 Dec 20;366(6472):1461. doi: 10.1126/science.aaz6594. Science. 2019. PMID: 31857476 No abstract available.
-
Comment on "Large-scale GWAS reveals insights into the genetic architecture of same-sex sexual behavior".Science. 2021 Mar 26;371(6536):eaba2941. doi: 10.1126/science.aba2941. Science. 2021. PMID: 33766855
References
-
- Scasta D, Bialer P, American Psychiatric Association, Position statement on issues related to homosexuality (American Psychiatric Association, 2013); www.psychiatry.org/psychiatrists/search-directories-databases/policy-finder (accessed on 26 February 2019).
Publication types
MeSH terms
Grants and funding
LinkOut - more resources
Full Text Sources
Other Literature Sources
