. 2019 Aug 29;10(1):3885.
doi: 10.1038/s41467-019-11813-6.

Impaired mitochondrial calcium efflux contributes to disease progression in models of Alzheimer's disease

Affiliations

Impaired mitochondrial calcium efflux contributes to disease progression in models of Alzheimer's disease

Pooja Jadiya et al. Nat Commun. .

Abstract

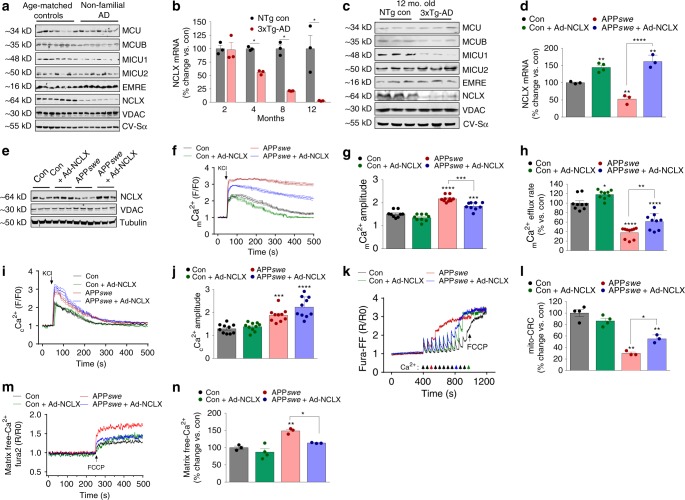
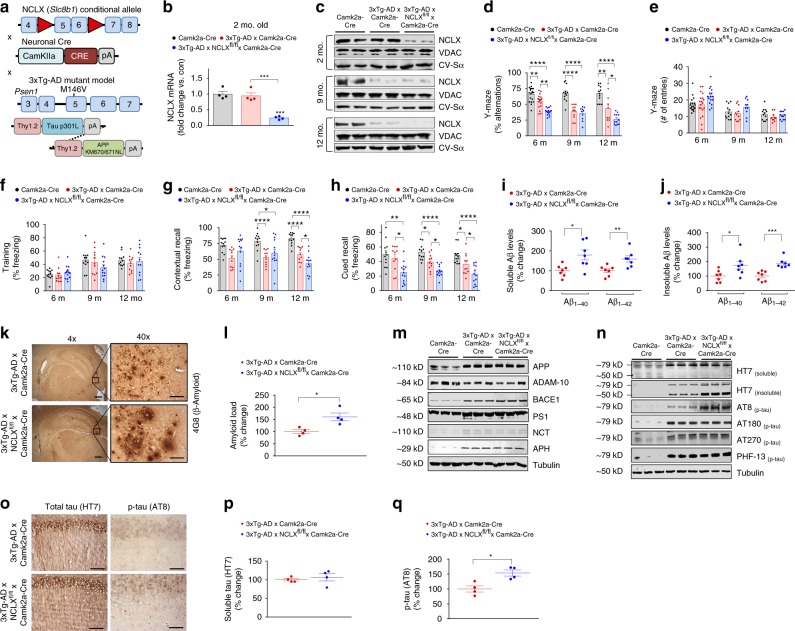
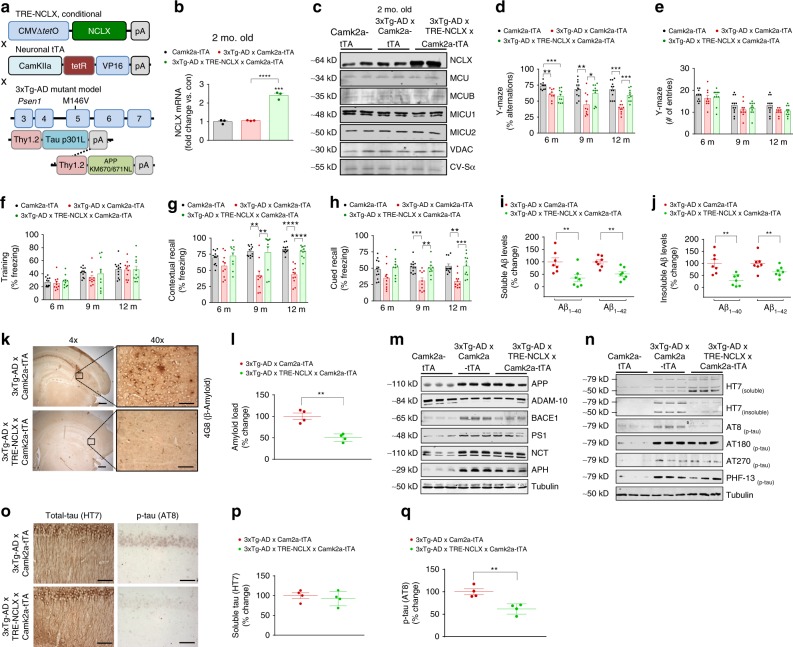
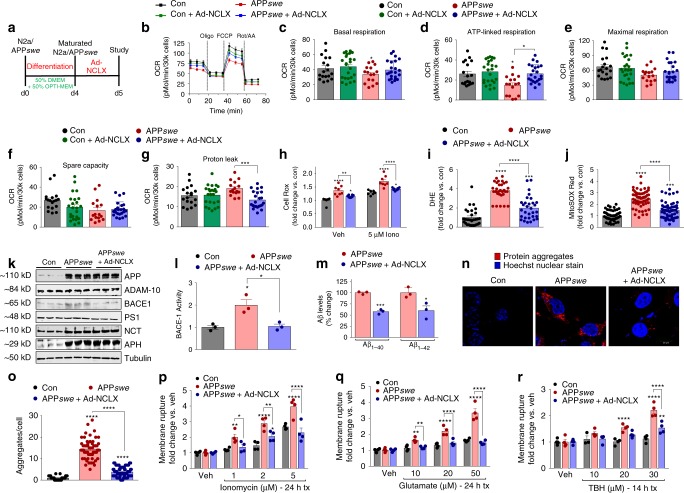
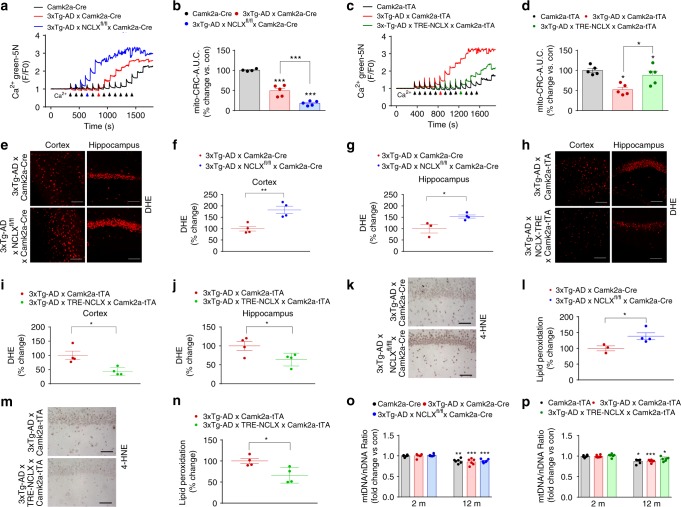
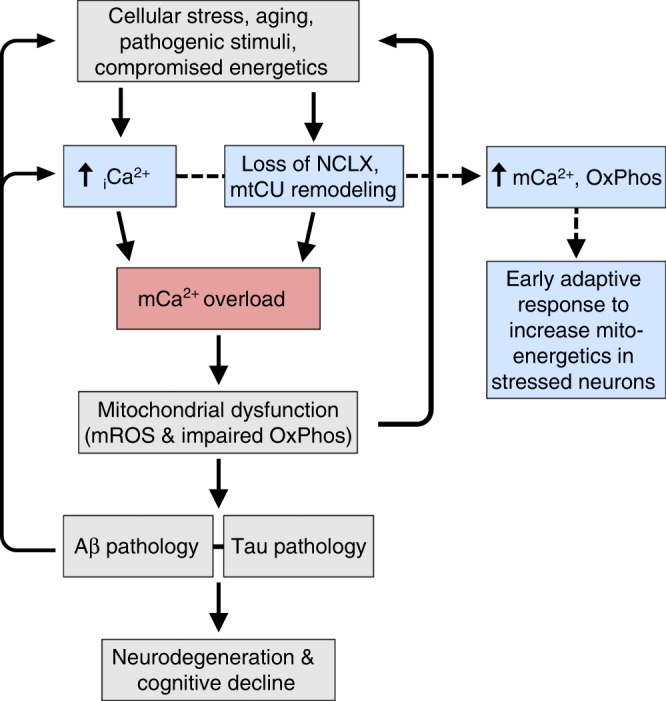
Impairments in neuronal intracellular calcium (iCa2+) handling may contribute to Alzheimer's disease (AD) development. Metabolic dysfunction and progressive neuronal loss are associated with AD progression, and mitochondrial calcium (mCa2+) signaling is a key regulator of both of these processes. Here, we report remodeling of the mCa2+ exchange machinery in the prefrontal cortex of individuals with AD. In the 3xTg-AD mouse model impaired mCa2+ efflux capacity precedes neuropathology. Neuronal deletion of the mitochondrial Na+/Ca2+ exchanger (NCLX, Slc8b1 gene) accelerated memory decline and increased amyloidosis and tau pathology. Further, genetic rescue of neuronal NCLX in 3xTg-AD mice is sufficient to impede AD-associated pathology and memory loss. We show that mCa2+ overload contributes to AD progression by promoting superoxide generation, metabolic dysfunction and neuronal cell death. These results provide a link between the calcium dysregulation and metabolic dysfunction hypotheses of AD and suggest mCa2+ exchange as potential therapeutic target in AD.


Conflict of interest statement

The authors declare no competing interests.

Figures

Fig. 1
Fig. 1
NCLX expression and mtCU components are significantly altered in AD. a Western blots for proteins associated with mCa2+ exchange in postmortem brains of patients diagnosed with non-familial, sporadic AD, and age-matched controls, n = 7 for both groups. MCU, Mitochondrial Calcium Uniporter; MCUB, Mitochondrial Calcium Uniporter β-subunit; MICU1, Mitochondrial Calcium Uptake 1; MICU2, Mitochondrial Calcium Uptake 2; EMRE, Essential MCU Regulator; NCLX, Mitochondrial Na+/Ca2+ Exchanger. Voltage-dependent anion channel (VDAC) and oxidative phosphorylation component, Complex V α-subunit (CV-Sα) were used as mitochondrial loading controls. b NCLX mRNA expression in tissue isolated from the frontal cortex of 3xTg-AD mutant mice and age-matched outbred non-transgenic controls (NTg). c Western blots for expression of mCa2+ exchanger in 12-month-old 3xTg-AD mutant mice and age-matched NTg controls, n = 3 for both groups. d NCLX mRNA expression in N2a control + Ad-NCLX, APPswe and APPswe + Ad-NCLX corrected to N2a control. e Western blots for NCLX expression in N2a control, Control + Ad-NCLX, APPswe, and APPswe + Ad-NCLX; representative of three independent experiments. f Mitochondrial Ca2+ transients, mean shown as solid line, thin lines display ± SEM; n = 9 for Con, n = 9 for Con + Ad-NCLX, n = 11 APPswe and n = 9 for APPswe + Ad-NCLX. g Quantification of mCa2+ transient peak amplitude. h Percent mCa2+ efflux rate vs. control. i Cytosolic Ca2+ transients, mean shown as solid line, thin lines display ± SEM. j Quantification of cytosolic Ca2+ peak amplitude. k Representative recordings of mitochondrial Ca2+ retention capacity. l Percent change in mCa2+ retention capacity vs. N2a control cells. m Representative traces for basal mitochondrial Ca2+ content. n Quantification of mCa2+ content. (n = individual dots shown for each group in all graphs. All data presented as mean ± SEM; ****p < 0.001, **p < 0.01, *p < 0.05; one-way ANOVA with Sidak's multiple comparisons test.) Source data are available as a Source Data file
Fig. 2
Fig. 2
Neuronal deletion of NCLX accelerates AD pathology. a Schematic of NCLX knockout 3xTg-AD mutant mouse gene-targeting strategy. b NCLX mRNA expression, corrected to the housekeeping gene, Rps13; expressed as fold change vs. Camk2a-Cre control, n = 4 for all groups. c Western blots for NCLX expression in tissue isolated from the hippocampus of mice. VDAC and CV-Sα, served as mitochondrial loading controls. d, e Y-maze spontaneous alternation test. d Percentage of spontaneous alternation. e Total number of arm entries. fh Fear-conditioning test. f Freezing responses in the training phase. g Contextual recall freezing responses, h Cued recall freezing responses. i, j Soluble and insoluble Aβ1–40 and Aβ1–42 levels in cortex of 12-month-old mice. k Representative immunohistochemical staining for 4G8-reactive β-amyloid; 4× scale bar = 100 μm, 40× scale bar = 50 μm. l Quantification of the integrated optical density area for Aβ immunoreactivity, n = 4 for all groups. m Western blots of full-length APP, ADAM-10, BACE1, PS1, Nicastrin, APH, and tubulin (loading control) for cortex homogenate of 12-month-old mice. n Representative western blots of soluble and insoluble total tau (HT7), phosphorylated tau at residues S202/T205 (AT8), T231/S235 (AT180), T181 (AT270), and S396 (PHF13) in cortex homogenate of 12-month-old mice, n = 3 for all groups. o Representative immunohistochemical staining for total tau (HT7) and phospho-tau S202/T205 (AT8) in hippocampus of mice; scale bar = 50 μm. p, q Quantification of the integrated optical density area of HT7 and AT8 immunoreactivity, n = 4 for all groups. (n = individual dots shown for each group in all graphs. All data presented as mean ± SEM; ****p < 0.001, **p < 0.01, *p < 0.05; one-way ANOVA with Sidak's multiple comparisons test.) Source data are available as a Source Data file
Fig. 3
Fig. 3
Neuronal rescue of NCLX expression impedes cognitive decline and AD pathology. a Schematic of tetracycline-responsive (TRE) transgenic construct and neuronal-specific driver, Camk2a-tTA. Neuronal-specific gain-of-function models were crossed with 3xTg-AD mutant mice to generate 3xTg-AD × TRE-NCLX × Camk2a-tTA mice. b NCLX mRNA expression corrected to the housekeeping gene, Rps13, expressed as fold change vs. tTA controls, n = 3 for all groups. c Western blots for NCLX expression and mitochondrial calcium uniporter channel components, tissue isolated from the hippocampus of 2 months old mice. d, e Y-maze spontaneous alternation test. d Percentage spontaneous alternation, e Total number of arm entries. fh Fear-conditioning test. f Freezing responses in the training phase, g contextual recall freezing responses, h Cued recall freezing responses. i, j Soluble and insoluble Aβ1–40 and Aβ1–42 levels in brain cortex of 12 months old mice. k Representative immunohistochemical staining for 4G8-reactive β-amyloid; 4 × scale bar = 100 μm, 40 × scale bar = 50 μm. l Quantification of the integrated optical density area for Aβ immunoreactivity, n = 4 for all groups. m Western blots of full-length APP, ADAM-10, BACE1, PS1, Nicastrin, APH, and tubulin (loading control) in cortex homogenate of 12 months old mice, n = 3 for all groups. n Representative western blots of soluble and insoluble total tau (HT7), phosphorylated tau at residues S202/T205 (AT8), T231/S235 (AT180), T181 (AT270), and S396 (PHF13) in soluble brain cortex homogenate of 12 months old mice, n = 3 for all groups. o Representative hippocampal staining for total tau (HT7) and phospho-tau S202/T205 (AT8) immunoreactivity in 12 months old mice; scale bar = 50 μm. p, q Quantification of HT7 and AT8 integrated optical density area correct to 3xTg-AD × Camk2a-tTA controls, n = 4 for all groups. (n = individual dots shown for each group in all graphs. All data presented as mean ± SEM; ****p < 0.001, **p < 0.01, *p < 0.05; one-way ANOVA with Sidak's multiple comparisons test.) Source data are available as a Source Data file
Fig. 4
Fig. 4
Enhancing mCa2+ efflux rescues mitochondrial dysfunction in APPswe cells. a Experimental protocol timeline for N2a maturation and adenovirus encoding NCLX (Ad-NCLX) transduction. b Oxygen consumption rate (OCR) at baseline and following: oligomycin (oligo; Complex V inhibitor; to uncover ATP-linked respiration), FCCP (protonophore to induce maximum respiration), and rotenone + antimycin A (Rot/AA; complex I and III inhibitor for complete ETC inhibition). c Quantification of basal respiration (base OCR – non-mito respiration (post-Rot/AA). d Quantification of ATP-linked respiration (post-oligo OCR−base OCR). e Maximum respiratory capacity (post-FCCP OCR−post-Rot/AA). f Spare respiratory capacity (post-FCCP OCR−basal OCR). g Proton leak (post-Oligo OCR−post-Rot/AA OCR). h Quantification of Cell Rox green fluorescent intensity (total cellular ROS production); fold change vs. N2a controls, n = 8 for all groups. i Quantification of DHE fluorescent intensity; fold change vs. N2a controls. j Quantification of MitoSOX fluorescent intensity; fold change vs. N2a controls, n = 52 for N2a control, n = 59 APPswe, and n = 59 for APPswe+ Ad-NCLX. k Western blots of full-length APP, ADAM-10 (α-secretase) BACE1 (β-secretase), PS1, Nicastrin, APH (γ-secretase), and tubulin (loading con). l Quantification of β-secretase activity, n = 3 for all groups. m Quantification of extracellular Aβ1–40 and Aβ1–42 levels. n Representative images of intracellular protein aggregates in N2a control, APPswe and APPswe + Ad-NCLX cells stained with proteostat aggresome detection reagent (red) and Hoechst 33342 nuclear stain (blue), scale bars = 20 μm. o Total aggregates per cell, n = 41 for N2a control, n = 62 APPswe and n = 69 APPswe+ Ad-NCLX. (P-R) Control, APPswe and APPswe transduced with Ad-NCLX for 48 h were assessed for plasma membrane rupture, Sytox Green, after treatment with: p Ionomycin (Ca2+ ionophore, 1–5 µM), q glutamate (-NMDAR agonist, 10–50 µM), r tert-Butyl hydroperoxide (TBH, oxidizing agent, 10–30 µM), n = 4 experiments for each reagent. (n = individual dots shown for each group in all graphs. All data presented as mean ± SEM; ****p < 0.001, **p < 0.01, *p < 0.05; one-way ANOVA with Sidak's multiple comparisons test.) Source data are available as a Source Data file
Fig. 5
Fig. 5
Restoration of mCa2+ efflux improves mitochondrial function in AD mutant mice. a Representative traces for mCa2+ retention capacity (CRC). b Percent change in CRC of 3xTg-AD × Camk2a-Cre and 3xTg-AD × NCLXfl/fl × Camk2a-Cre vs. Camk2a-Cre control. c Representative trace for CRC in Camk2a-tTA, 3xTg-AD × Camk2a-tTA and 3xTg-AD × TRE- NCLX × Camk2a-tTA mice. d Percent change in mCa2+ retention capacity of 3xTg-AD × Camk2a-tTA and 3xTg-AD × TRE- NCLX × Camk2a-tTA vs. Camk2a-tTA control. e DHE staining for ex vivo detection of superoxide production in freshly prepared cortical and hippocampal sections from 12 months old mice. f, g DHE fluorescent intensity, percent change vs. 3xTg-AD × Camk2a-Cre controls. h DHE staining for ex vivo detection of superoxide production in freshly prepared cortical and hippocampal sections from 12 months old mice. i, j Quantification of DHE fluorescent intensity, percent change vs. 3xTg-AD × Camk2a-tTA controls. k Representative images of hippocampal 4-HNE immunohistochemistry to detect lipid peroxidation in 12 months old mice. l Percent change in 4-HNE-integrated optical density area corrected to 3xTg-AD × Camk2a-Cre controls. m Representative images of hippocampal 4-HNE immunohistochemistry to detect lipid peroxidation in 12 months old mice. n Percent change in 4-HNE-integrated optical density area corrected with 3xTg-AD × Camk2a-tTA controls. o Mitochondrial DNA (mtDNA)/nuclear DNA (nDNA) ratio in tissue isolated from the cortex of 2 and 12 months old mice, fold change vs. 2 months old Camk2a-Cre controls. p mtDNA/nDNA ratio in tissue isolated from the brain cortex of 2 and 12 months old mice expressed as fold change vs. 2 months old Camk2a-tTA controls. (n = individual dots shown for each group in all graphs. All data presented as mean ± SEM; ****p < 0.001, **p < 0.01, *p < 0.05; one-way ANOVA with Sidak's multiple comparisons test.) Source data are available as a Source Data file
Fig. 6
Fig. 6
Working hypothesis of mCa2+ exchange dysfunction in AD pathogenesis. Alzheimer’s disease (AD) initiators, such as aging and metabolic dysfunction, elicit a compensatory increase in intracellular calcium (iCa2+) and remodeling of the mCa2+ exchange machinery to elevate matrix Ca2+ levels and activate mitochondrial dehydrogenases to augment cellular energetics (blue boxes). However, these alterations in iCa2+ handling quickly turn maladaptive leading to mCa2+-overload, which results in mitochondrial dysfunction and AD pathophysiology. The proposed sequence of events initiates positive feedback at multiple levels of the disease pathway potentiating the progression of neurodegeneration

References

    1. Roberson ED, et al. Reducing endogenous tau ameliorates amyloid beta-induced deficits in an Alzheimer's disease mouse model. Science. 2007;316:750–754. doi: 10.1126/science.1141736. - DOI - PubMed
    1. Cummings J, et al. Anti-Tau trials for Alzheimer's disease: a report from the EU/US/CTAD task force. J. Prev. Alzheimer's Dis. 2019;6:157–163. - PubMed
    1. Cummings J, Lee G, Ritter A, Zhong K. Alzheimer's disease drug development pipeline: 2018. Alzheimer's Dement. 2018;4:195–214. - PMC - PubMed
    1. Ivannikov MV, Sugimori M, Llinas RR. Calcium clearance and its energy requirements in cerebellar neurons. Cell Calcium. 2010;47:507–513. doi: 10.1016/j.ceca.2010.04.004. - DOI - PMC - PubMed
    1. Mattson MP, et al. beta-Amyloid precursor protein metabolites and loss of neuronal Ca2 + homeostasis in Alzheimer's disease. Trends Neurosci. 1993;16:409–414. doi: 10.1016/0166-2236(93)90009-B. - DOI - PubMed

Publication types