. 2019 Aug 29;10(1):3897.
doi: 10.1038/s41467-019-11878-3.

NK cells are activated and primed for skin-homing during acute dengue virus infection in humans

Affiliations

NK cells are activated and primed for skin-homing during acute dengue virus infection in humans

Christine L Zimmer et al. Nat Commun. .

Abstract

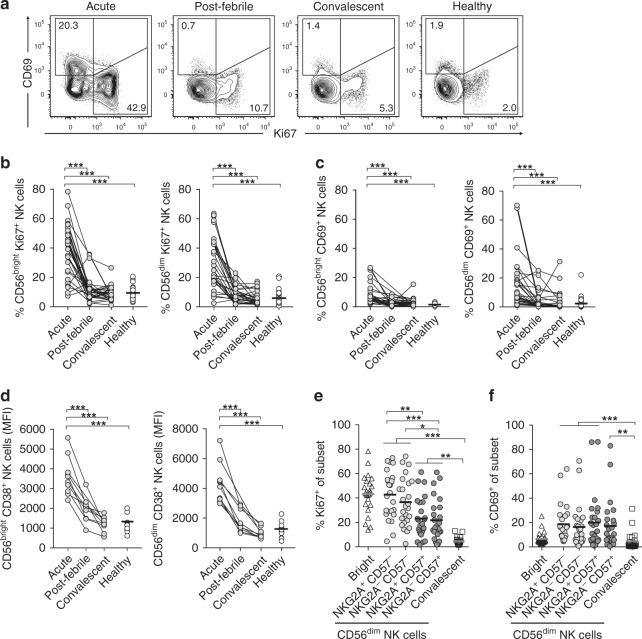
Despite animal models showing that natural killer (NK) cells are important players in the early defense against many viral infections, the NK cell response is poorly understood in humans. Here we analyze the phenotype, temporal dynamics, regulation and trafficking of NK cells in a patient cohort with acute dengue virus infection. NK cells are robustly activated and proliferate during the first week after symptom debut. Increased IL-18 levels in plasma and in induced skin blisters of DENV-infected patients, as well as concomitant signaling downstream of the IL-18R, suggests an IL-18-dependent mechanism in driving the proliferative NK cell response. Responding NK cells have a less mature phenotype and a distinct chemokine-receptor imprint indicative of skin-homing. A corresponding NK cell subset can be localized to skin early during acute infection. These data provide evidence of an IL-18-driven NK cell proliferation and priming for skin-homing during an acute viral infection in humans.


Conflict of interest statement

The authors declare no competing interests.

Figures

Fig. 1
Fig. 1
Natural killer (NK) cells are robustly activated during the acute phase of dengue virus (DENV) infection. a Representative staining for CD69 and Ki67 expression on NK cells from one representative patient during the acute, post-febrile, and convalescent phase of DENV infection, and one healthy control. Summary of data showing b Ki67, c CD69 (acute, n = 31; post -febrile, n = 29; convalescent, n = 29; healthy control, n = 26), and d CD38 (acute, n = 10; post -febrile, n = 9; convalescent, n = 10; healthy control, n = 13) expression on CD56bright and CD56dim NK cells shown as median fluorescence intensity (MFI), respectively. e, f Summary of data on e Ki67 and f CD69 expression on CD56bright as well as CD56dim NK cell subsets, respectively. The CD56dim NK cells are stratified by differential expression of NKG2A and CD57. NK cells from DENV-infected patients at the acute (n = 25) and convalescent (n = 23) phases of infection. Statistical differences were tested using one-way analysis of variance (ANOVA) and Kruskal–Wallis test followed by Tukey’s multiple comparisons test or Dunn’s multiple comparisons test, respectively. Bars represent mean, *p < 0.05, **p < 0.01, ***p < 0.001. Source data are provided as a Source Data file
Fig. 2
Fig. 2
High-dimensional analysis of natural killer (NK) cells responding (Ki67+ and Ki67) during acute dengue virus (DENV) infection. a Barnes–Hut stochastic neighbor embedding (Bh-SNE) maps on total CD56bright NK cells and separated for responding (Ki67+) and non-responding (Ki67) cells. Residual plot showing the difference between responding and non-responding maps. Analysis is based on data from three representative patients at the acute phase of infection with 5000 events per subset and patient. b Relative expression intensities of the 11 indicated parameters that were used in the SNE analysis. Phenotypes within red circles are more common in responding NK cells and vice versa for blue circles in non-responding NK cells. c, d Similar analysis as in a, b but for CD56dim NK cells. e Representative flow cytometry staining for Bcl-2 and Ki67 expression of T cells, CD56bright NK cells, and CD56dim NK cells from one representative patient at the acute phase of infection. f Comparison of Bcl-2 expression using the median fluorescence intensity ratio (MFI, ratio of Ki67+ normalized to Ki67) within T cells, CD56bright NK cells, and CD56dim NK cells (n = 9). Lowest and highest observations are displayed with the median indicated as center line. Statistical differences in f were tested using one-way analysis of variance (ANOVA) followed by Holm–Sidak’s multiple comparison test. *P < 0.05 and ***p < 0.001. Source data are provided as a Source Data file
Fig. 3
Fig. 3
CD56dim natural killer (NK) cell responses during acute dengue virus (DENV) infection are uncoupled from NK cell education. a Gating strategy to identify NKG2A+CD57, NKG2ACD57, NKG2A+CD57+, and NKG2ACD57+ CD56dim NK cell subsets (first plot) expressing discrete combinations of KIR2DL1, KIR2DL1/S1, KIR2DL3, KIR2DL3/2DL2/2DS2, KIR2DS4, and KIR3DL1 (second to fifth plot). b Summary of data for frequency of Ki67+ CD56dim NK cells at the acute phase of DENV infection within educated (educated via expression of self-KIR and/or NKG2A) and uneducated subsets of cells (n = 16). Histocompatibility leukocyte antigen (HLA) genotyping was used to assign self and non-self-KIR+ subsets (see Supplementary Table 2 and Methods section). c Summary of data for frequency of Ki67+CD56dim NK cells subsets expressing no KIR, one non-self-KIR (Non-self-KIR) or one self-KIR (Self-KIR) (n = 16). d Flow cytometry plots showing two donors with NKG2C+CD57+ adaptive-like CD56dim NK cell expansions within the responding (Ki67+) and non-responding (Ki67) population. e Summary graphs highlighting the donors with adaptive-like expansions (red) as frequency of NKG2C+CD57+ CD56dim NK cells throughout infection (left), as overall CD56dim NK cell frequency out of lymphocytes (middle), and among responding (Ki67+) cells (right). f, g Frequency of Ki67+ and CD69+ NK cells stratified according to acute primary (n = 7) or acute secondary (n = 6) DENV infection. Statistical differences were tested using one-way analysis of variance (ANOVA) followed by Tukey’s multiple comparison test (b, c) or Mann–Whitney test (f, g); n.s. = not significant. Source data are provided as a Source Data file
Fig. 4
Fig. 4
Increased levels of interleukin-18 (IL-18) during the acute phase of dengue virus (DENV) infection. a Summary of data showing levels of plasma IL-18 (pg/ml) during the acute and convalescent phase of DENV-infected patients (n = 24) compared to healthy controls (n = 10). b Representative histograms of IL-18Rα expression (mean ± SD) on CD56bright natural killer (NK) cells, CD56dim NK cells, and T cells during the acute phase of DENV infection. c Mean IL-18Rα expression (median fluorescence intensity (MFI) on CD56dim NK cell subsets stratified for NKG2A and CD57 (black bars, left) during the acute phase of DENV infection is shown. These are compared to bulk CD56dim NK cells from indicated phases (gray and white bars), to T cells from the same stages (n = 10), and to healthy controls (n = 11). d Levels of NK cell-activating cytokines from skin blister fluid collected during the acute phase of DENV infection compared to matched plasma. e CD98 expression (MFI) on NK cell subsets from DENV-infected patients during the acute (n = 14), post-febrile (n = 12), and convalescent phase (n = 14) compared to healthy controls (n = 15). Lowest and highest observations are displayed with the median indicated as center line. Statistical differences were tested using paired t test or Wilcoxon’s matched-pairs signed-rank test. *P < 0.05, **p < 0.01, and ***p < 0.001. Source data are provided as a Source Data file
Fig. 5
Fig. 5
Changes in signaling downstream of the interleukin-18R (IL-18R) during acute dengue virus (DENV) infection. a Gating strategy to identify CD56bright and CD56dim natural killer (NK) cell subsets from total peripheral blood mononuclear cells (PBMCs) after methanol fixation. b Representative histograms showing staining for pNF-κB, pAKT, and pATF2 in CD56bright and CD56dim NK cell subsets from healthy controls, rested (blue) or cytokine primed, with (blue or red) or without (gray) the addition of IL-18. c Results summarized from experiments in b (n = 6). d Phosphoflow epitope staining of NKG2A+CD57 CD56dim NK cells from healthy controls that were pre-incubated with patient sera, from the acute or convalescent phase, with or without IL-18 stimulation. e Ex vivo expression of pNF-κB, pAKT, pATF2, and pFOXO3A in CD56bright and CD56dim NK cell subsets from the acute, post-febrile, and convalescent phase of DENV infection (n = 6). Statistical differences were tested using paired t test or Wilcoxon’s matched-pairs signed-rank test. Stars (*) indicate significant differences between the non-IL-18 control compared to the IL-18-stimulated condition (c) or significant differences between patients and healthy controls (e); hashes (#) indicate significant differences between the acute phase and follow-up time points of patients with DENV infection (e). #P < 0.05; *p < 0.05, **p < 0.01, and ***p < 0.001. Source data are provided as a Source Data file
Fig. 6
Fig. 6
Assessment of natural killer (NK) cell function during acute dengue virus (DENV) infection. a Representative flow cytometry staining shown as concatenated plots for CD107a, interferon-γ (IFNγ), tumor necrosis factor (TNF), macrophage inflammatory protein-1β (MIP-1β), and granulocyte–macrophage colony-stimulating factor (GM-CSF) for CD56bright and CD56dim NK cells after the indicated stimulations. Gates were set according to unstimulated cells (no target). Numbers within gates indicate percent positive cells. Rit, Rituximab®. b Heat map summarizing the frequency of CD56bright NK cells and CD56dim NK cells responding to the indicated stimulations (K562 cells, n = 4; 721.221 cells, n = 9; 721.221 cells + Rituximab®, n = 9; IL-12 + IL-18, n = 4; IL-12 + IL-18 + K562 cells, n = 4) during the acute, post-febrile, and convalescent phase of DENV infection, and healthy controls. c Pie charts showing the number of functions, as defined by Boolean gating, simultaneously exhibited by CD56bright (left panels) and CD56dim (right panels) NK cells either at the acute (upper panels) or convalescent phase (lower panels) of DENV infection in response to the indicated stimuli. The number of functions (one to five) is shown in different shades of gray, and the outer arcs indicate which functions were detected within each pie. d Frequency of CD56bright NK cells and CD56dim NK cells responding with IFNγ, TNF, and MIP-1β production upon in vitro infection of healthy donor peripheral blood mononuclear cells (PBMCs) with live DENV (DENV), DENV pre-incubated with the chimeric 4G2 monoclonal antibody (mAb) (DENV + Ab), ultraviolet (UV)-inactivated DENV (DENV UV), UV-inactivated DENV pre-incubated with the chimeric 4G2 mAb (DENV UV + Ab), and with 4G2 antibody only (Ab) for 24 h. Medium control was subtracted. Statistical differences were tested using paired t test or Wilcoxon’s matched-pairs signed-rank test. *P < 0.05 and **p < 0.01; n.s. not significant. Source data are provided as a Source Data file
Fig. 7
Fig. 7
Distinct chemokine receptor imprint of CD56bright natural killer (NK) cells during acute dengue virus (DENV) infection. a Representative histograms showing chemokine receptor staining on responding (Ki67+, red) and non-responding (Ki67, blue) CD56bright NK cells and the respective fluorescence minus one (FMO) controls (gray). b Heat map summarizing (median) the expression of each of the 12 chemokine receptors on CD56bright (left) and CD56dim (right) NK cells. This is subdivided into Ki67+/− (two left panels) and CD69+/− (two right panels) during the acute phase compared to the post-febrile and convalescent phase of DENV infection (n = 10–21) and healthy controls (n = 12–16). Frequencies are shown for all chemokine receptors except CLA, CX3CR1, and CCR10. Statistical differences were tested using paired t test or Wilcoxon’s matched-pairs signed-rank test and unpaired t test or Mann–Whitney test. Stars (*) represents Ki67+ and CD69+ compared to Ki67 and CD69, respectively. *P < 0.05, **p < 0.01, and ***p < 0.001. Hashes (#) represent Ki67+or CD69+ compared to healthy controls, #p < 0.05, ##p < 0.01, ###p < 0.001. Source data are provided as a Source Data file
Fig. 8
Fig. 8
CLA+CXCR3+ CCR5+ CD69+ natural killer (NK) cells are present in the skin during acute dengue virus (DENV) infection. a Representative plot showing CD56bright NK cells and CD56dim NK cells from isolated from skin blisters (red overlay) and matched peripheral blood (gray background) that is summarized in b (DENV patients n = 3, healthy controls n = 2). c Spearman’s correlation between number of NK cells isolated from skin blisters and the day of sample collection (day after symptom debut). d Representative staining for CD69 and CLA (upper panels) on NK cells from skin blister fluid (red overlay) and peripheral blood mononuclear cell (PBMC) (gray background) of three patients with acute DENV infection, and three healthy controls (lower panel). e Representative staining for CCR5, CXCR3 (upper panel), CCR7, and CCR10 (lower panel). f Summary data of d for CLA and CD69 expression on NK cells from DENV patients (n = 8) and healthy controls (n = 5). g Summary data of e for chemokine receptor expression on NK cells from DENV-infected patients (n = 3–5). Statistical differences were tested in using paired t test, Wilcoxon’s matched-pairs signed-rank test and Mann–Whitney test. **P < 0.01 and ***p < 0.001. Source data are provided as a Source Data file

References

    1. Cooper MA, Fehniger TA, Caligiuri MA. The biology of human natural killer-cell subsets. Trends Immunol. 2001;22:633–640. - PubMed
    1. Brandstadter JD, Yang Y. Natural killer cell responses to viral infection. J. Innate Immun. 2011;3:274–279. - PMC - PubMed
    1. Vivier E, Tomasello E, Baratin M, Walzer T, Ugolini S. Functions of natural killer cells. Nat. Immunol. 2008;9:503–510. - PubMed
    1. Lanier LL. Evolutionary struggles between NK cells and viruses. Nat. Rev. Immunol. 2008;8:259–268. - PMC - PubMed
    1. Orange JS. Human natural killer cell deficiencies. Curr. Opin. Allergy Clin. Immunol. 2006;6:399–409. - PubMed

Publication types