. 2019 Aug 29;10(1):3884.
doi: 10.1038/s41467-019-11785-7.

CSL controls telomere maintenance and genome stability in human dermal fibroblasts

Affiliations

CSL controls telomere maintenance and genome stability in human dermal fibroblasts

Giulia Bottoni et al. Nat Commun. .

Abstract

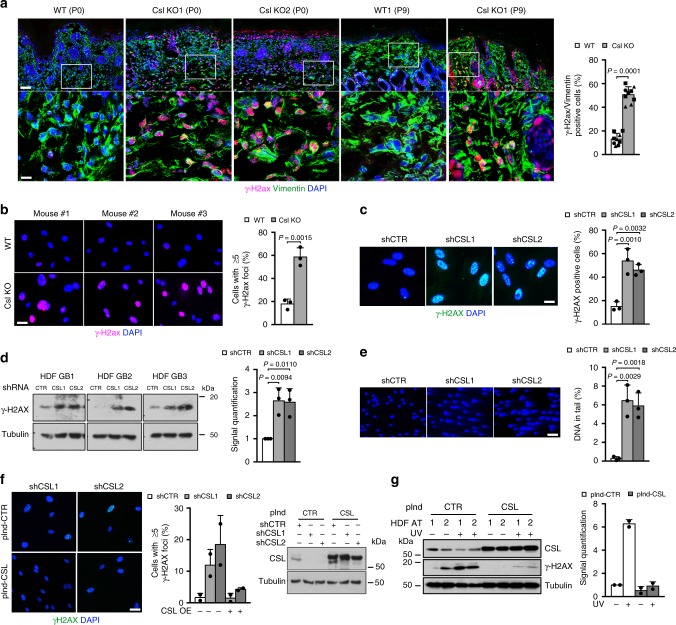
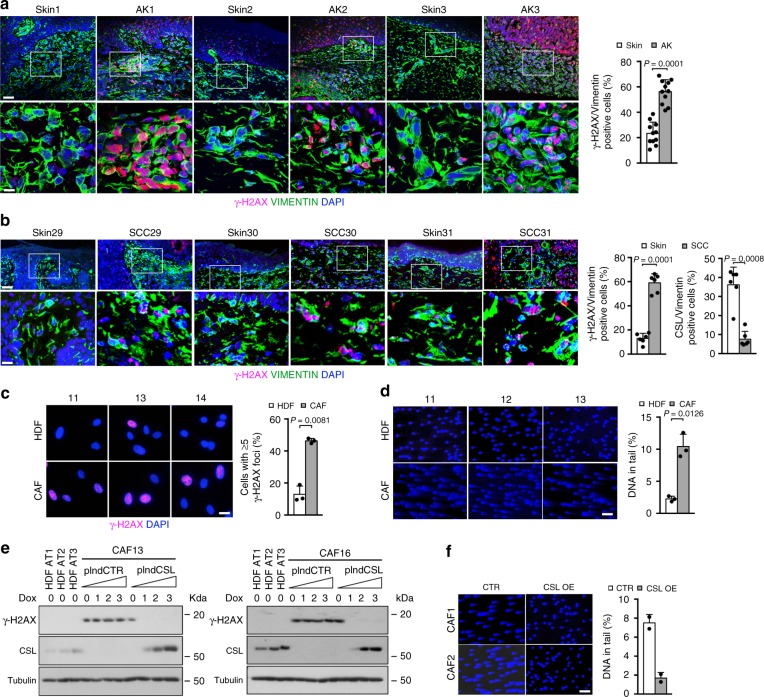
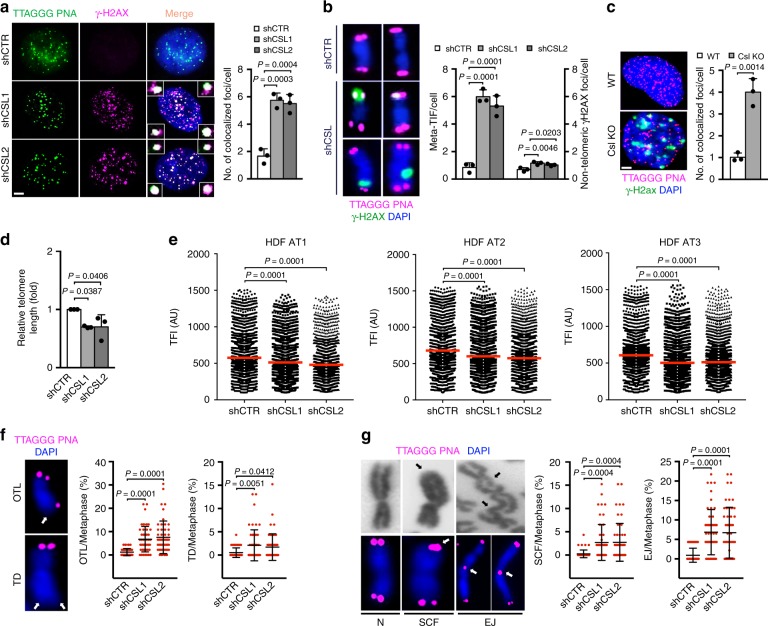
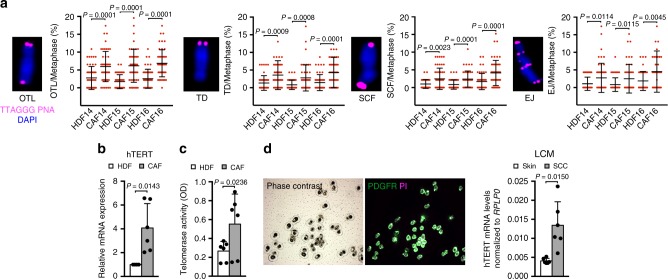
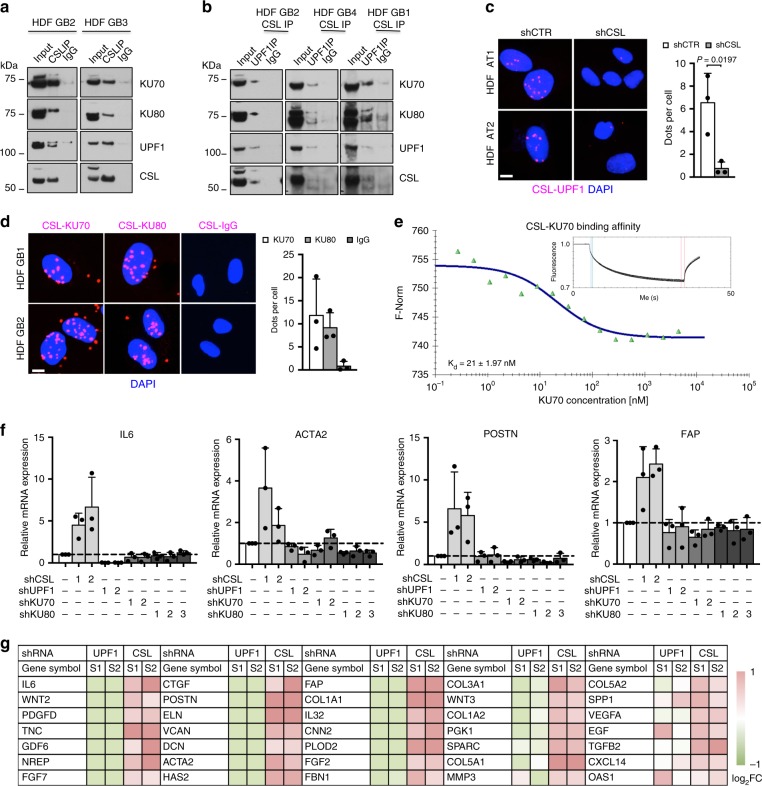
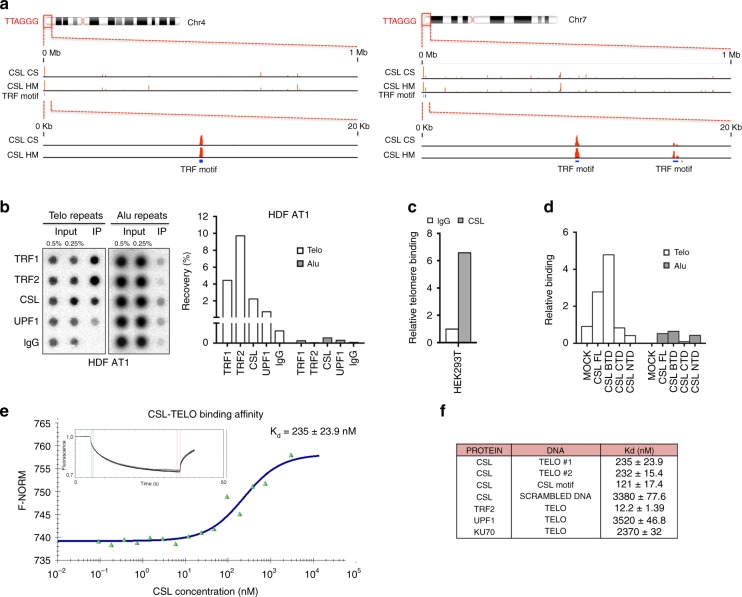
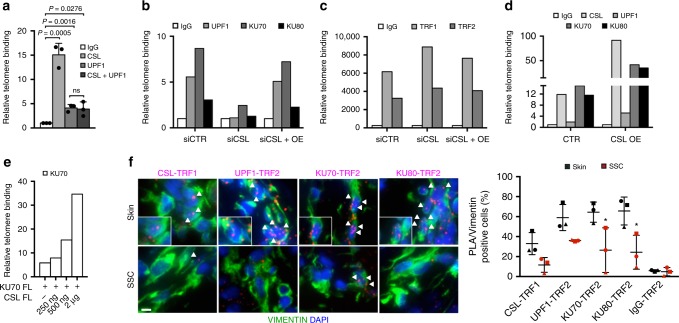
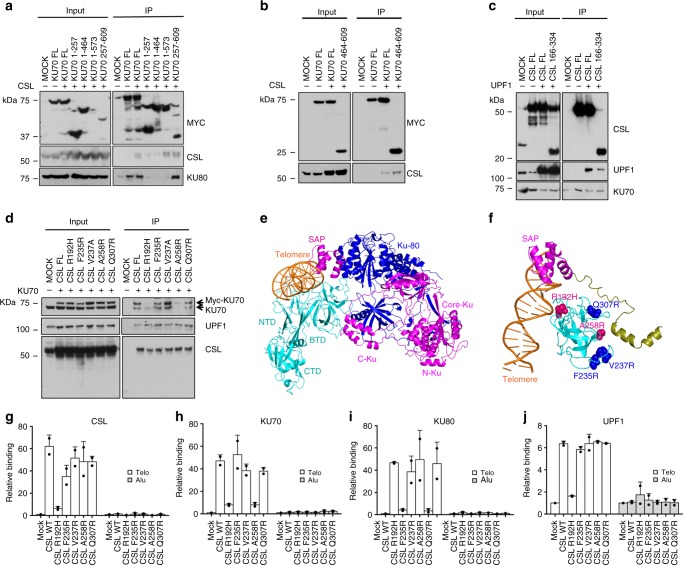
Genomic instability is a hallmark of cancer. Whether it also occurs in Cancer Associated Fibroblasts (CAFs) remains to be carefully investigated. Loss of CSL/RBP-Jκ, the effector of canonical NOTCH signaling with intrinsic transcription repressive function, causes conversion of dermal fibroblasts into CAFs. Here, we find that CSL down-modulation triggers DNA damage, telomere loss and chromosome end fusions that also occur in skin Squamous Cell Carcinoma (SCC)-associated CAFs, in which CSL is decreased. Separately from its role in transcription, we show that CSL is part of a multiprotein telomere protective complex, binding directly and with high affinity to telomeric DNA as well as to UPF1 and Ku70/Ku80 proteins and being required for their telomere association. Taken together, the findings point to a central role of CSL in telomere homeostasis with important implications for genomic instability of cancer stromal cells and beyond.


Conflict of interest statement

The authors declare no competing interests.

Figures

Fig. 1
Fig. 1. CSL loss induces DNA damage in mouse and human dermal fibroblasts.
a γ-H2ax (magenta) and Vimentin (green) immunostaining of the skin of mice plus/minus mesenchymal Csl deletion (WT/KO) at the indicated days after birth (P0-9). Shown are representative low and high magnification images (scale bars, 100 and 10 μm) and quantification of double positive γ-H2ax and Vimentin cells. Circles, triangles, and squares represent P0, P6, and P9 mice, respectively. >100 Vimentin positive cells were counted in each case. n(WT P0) = 2, n(WT P6) = 3, n(WT P9) = 4, n(KO P0) = 2, n(WT P6) = 3, n(WT P9) = 4, ****p = 0.0001, two-tailed unpaired t-test. b γ-H2ax immunostaining and quantification of early passage dermal fibroblasts derived from mice plus/minus mesenchymal Csl deletion (WT/KO). Scale bar, 10 μm. >300 cells were counted per sample. n(WT) = 3, n(KO) = 3, **p < 0.01, two-tailed unpaired t-test. c γ-H2AX immunostaining and quantification of HDFs plus/minus infection with two CSL silencing lentiviruses versus empty vector control for 5 days. Scale bar, 5 μm. >245 cells were counted per sample. n(strain) = 3, **p < 0.01, one-way ANOVA. d Immunoblot and densitometric quantification (after γ-TUBULIN normalization) of γ-H2AX protein levels in HDFs plus/minus CSL silencing as in c. n(strain) = 3, *p < 0.05, one-way ANOVA. e Comet assays of HDFs plus/minus shRNA-mediated CSL silencing as in c. Scale bar, 20 μm. >40 cells were analyzed per sample. n(strain) = 3, **p < 0.01, one-way ANOVA. f γ-H2AX immunostaining and immunoblot of CSL levels (with γ-TUBULIN normalization) in HDFs with CSL silencing and concomitant overexpression. HDFs stably infected with CSL-inducible lentiviral vector (pInd-CSL) or empty-vector control (pInd-CTR) were infected with two CSL silencing lentiviruses versus control for 5 days and concomitantly treated with doxycycline (500 ng ml−1). Scale bar, 10 μm. >100 cells were counted per sample. n(strain) = 2. g Immunoblot and densitometric quantification (after γ-TUBULIN normalization) of γ-H2AX and CSL protein levels in two HDF strains (HDF AT1 and AT2) infected with an empty-vector control versus CSL-inducible virus plus/minus UVA treatment. After 5 days of doxycycline (500 ng ml−1) treatment for CSL induction, HDFs were irradiated with UVA (0, 2 J cm−2) and protein lysates were collected 6 h after exposure. n(strain) = 2. Bars represent mean ± SD
Fig. 2
Fig. 2. DNA damage induction in CAFs can be counteracted by CSL overexpression.
a γ-H2AX (magenta) and VIMENTIN (green) immunostaining of AK underlying stroma versus flanking unaffected skin from multiple patients. Shown are representative low and high magnification images (scale bars, 50 and 10 μm) and quantification of double positive γ-H2AX and VIMENTIN cells. Decreased CSL expression and limited leukocytes infiltration were previously shown for five lesions and for the remaining they were assessed by double immunostaining with anti-VIMENTIN and anti-CSL/anti-CD45 antibodies (Supplementary Fig. 1a). >120 VIMENTIN positive cells were counted per sample. n(AK/Skin) = 11, ****p = 0.0001, two-tailed paired t-test. b γ-H2AX (magenta) and VIMENTIN (green) immunostaining of SCC underlying stroma versus flanking unaffected skin from multiple patients. Shown are representative low and high magnification images (scale bars, 50 and 10 μm) and quantification of double positive γ-H2AX and VIMENTIN cells. Decreased CSL expression and limited leukocytes infiltration were assessed by double immunostaining with anti-VIMENTIN and anti-CSL/anti-CD45 antibodies (right panel and Supplementary Fig. 1b). >77 VIMENTIN positive cells were counted per sample. n(SCC) = 6, n(Skin) = 6, ***p < 0.001, two-tailed paired t-test. c γ-H2AX immunostaining of CAFs derived from three skin SCCs and matched HDFs from unaffected skin of the same patients. Scale bar, 10 μm. >175 cells were counted per sample. n(CAF strain) = 3, n(matched HDF strain) = 3, **p < 0.01, two-tailed paired t-test. d Comet assays of three CAF and matched HDF strains. Scale bar, 50 μm. >135 cells were analyzed per sample. n(CAF strain) = 3, n(matched HDF strain) = 3, *p < 0.05, two-tailed paired t-test. e Immunoblot of γ-H2AX and CSL protein levels (with γ-TUBULIN normalization) in two CAF strains infected with an inducible CSL overexpressing lentivirus versus empty vector control and treated with increasing concentrations of doxycycline for 5 days. 0, 1, 2, and 3 represent 0, 50, 200, and 500 ng ml−1 of doxycycline, respectively. Three untreated HDF strains were analyzed in parallel as a reference. n(CAF strain) = 2. f Comet assays of two CAF strains infected with a constitutive CSL overexpressing retrovirus versus empty vector control for 5 days. Scale bar, 50 μm. > 303 cells were analyzed per sample. n(CAF strain) = 2. Bars represent mean ± SD
Fig. 3
Fig. 3. CSL depletion triggers telomere loss and genomic instability in HDFs and MDFs.
a Telomeric DNA Q-FISH (TTAGGG PNA, green) and γ-H2AX immunostaining (magenta) colocalization signals (foci) in HDFs plus/minus CSL silencing (5 days). Scale bar, 1 μm. Fifty cells per sample were scored. n(strain) = 3, ***p < 0.001, one-way ANOVA. b Telomeric DNA Q-FISH (magenta) and γ-H2AX immunostaining (green) colocalization signals (telomere dysfunction-induced foci, meta-TIF) and nontelomeric γ-H2AX foci in metaphase chromosome spreads from HDFs plus/minus CSL silencing. Additional images are in Supplementary Fig. 2a. Forty spreads per sample were scored. n(strain) = 3, *p < 0.05, one-way ANOVA. c Telomeric DNA-FISH (magenta) and γ-H2ax immunostaining (green) colocalization signals (foci) in dermal fibroblasts from multiple mice plus/minus mesenchymal Csl deletion (WT/KO). Scale bar, 1 μm. >25 cells per sample were scored. n(WT) = 3, n(KO) = 3, **p < 0.01, two-tailed unpaired t-test. d qPCR analysis of average telomere length normalized to the ALBUMIN gene in HDFs plus/minus CSL silencing. n(strain) = 3, *p < 0.05, one-way ANOVA. e Analysis of telomere length by Q-FISH in HDFs plus/minus CSL silencing. Scatter plots show distribution of telomere fluorescence intensity (TFI) in arbitrary units (AU). >3000 telomeres were quantified per sample. Histograms with telomere length distribution are in Supplementary Fig. 2b. n(telomere) > 3000, n(strain) = 3, ****p = 0.0001, one-way ANOVA. f Representative images of one telomere loss (OTL) and terminal deletion (TD) (white arrows) and quantification of the percentage of chromosomes carrying OTLs or TDs per metaphase in HDFs plus/minus CSL silencing. Additional images are in Supplementary Fig. 2c. Mean ± SD, n(spread) = 50, n(strain) = 2, *p < 0.05, one-way ANOVA. g Representative phase contrast (top) and telomere FISH (bottom) images of normal chromosomes (N), chromosomes with sister chromatid fusion (SCF) or with chromosomal end joining (EJ) (arrows), and quantification of the percentage of chromosomes carrying SCFs or EJs per metaphase in HDFs plus/minus CSL silencing. Additional images are in Supplementary Fig. 2c. Mean ± SD, n(spread) = 50, n(strain) = 2, ***p < 0.001, one-way ANOVA. Bars represent mean ± SD
Fig. 4
Fig. 4. CAFs display persistent genomic instability and hTERT reactivation.
a Representative images and quantification of the percentage of chromosomes carrying OTLs, TDs, SCFs, and EJs per metaphase in three CAF and matched HDF strains. Data are shown as in Fig. 3f, g. Mean ± SD, n(spread) = 47, n(CAF strain) = 3, n(matched HDF strain) = 3, *p < 0.05, two-tailed unpaired t-test. b RT-qPCR analysis of hTERT expression, normalized to RPLP0, in six CAF and matched HDF strains. n(CAF strain) = 6, n(matched HDF strain) = 6, *p < 0.05, two-tailed paired t-test. c Telomerase activity measured in the same six CAF and matched HDF strains as in b. n(CAF strain) = 6, n(matched HDF strain) = 6, *p < 0.05, two-tailed paired t-test. d RT-qPCR analysis of hTERT expression, normalized to RPLP0, of in situ SCCs, and matched unaffected skin sections (from which CAFs and HDFs in Fig. 4b were derived) processed for fluorescence-guided laser capture microdissection (LCM) utilizing anti-PDGFRα-FITC conjugated antibodies (green) and propidium iodide (PI, magenta) staining for nuclei identification. Shown are also representative images of cells captured on LCM caps. n(SCC CAF) = 6, n(matched HDF) = 6, *p < 0.05, two-tailed paired t-test. Bars represent mean ± SD
Fig. 5
Fig. 5. CSL binds to Ku70, Ku80, and UPF1 forming a multiprotein complex.
a Co-immunoprecipitation (co-IP) analysis of HDFs with anti-CSL antibodies or non-immune IgG followed by immunoblotting with antibodies against the indicated proteins. n(strain) = 2. b Sequential co-IP analysis of HDFs with antibodies against CSL followed by IP with antibodies against UPF1 or non-immune IgG, and immunoblotting with antibodies against the indicated proteins. n(strain) = 3. c Proximity ligation assays (PLAs) of CSL and UPF1 association. HDFs with silenced CSL were used as negative control. Scale bar, 2 μm. Number of dots per cell was counted. n(cells) > 43 per condition, n(strain) = 3, *p < 0.05, two-tailed unpaired t-test. d PLAs of CSL and Ku70 and Ku80 association. Scale bar, 2 μm. Number of dots per cell was counted. n(cells) > 54 per condition, n(strain) = 3. e Binding of recombinant CSL and Ku70 proteins as measured by microscale thermophoresis (MST). Inset: thermophoretic movement of fluorescently-labeled CSL. Specificity controls are in Supplementary Fig. 5c, d. f RT-qPCR of CAF effector genes in HDFs plus/minus UPF1/Ku70/Ku80 versus CSL gene silencing for 6 days. Silencing controls are in Supplementary Fig. 6a. g RNA-seq analysis of CAF effector genes in HDFs plus/minus UPF1 versus CSL gene silencing for 7 days. Heatmap of differentially expressed genes in HDFs with CSL or UPF1 silencing relative to control is in log2 scale. Bars represent mean ± SD
Fig. 6
Fig. 6. CSL binds to telomeres.
a Position of CSL binding peaks (red) at telomeric ends of two chromosomes (chr4 and chr7) as revealed by Chromatin IP combined with DNA sequencing (ChIP-seq) analysis with two different anti-CSL antibodies (CS, Cell Signaling; HM, HomeMade). Chromosomal regions of CSL binding are shown at two different scales together with the predicted position of TRF binding motifs (blue bars). Complete list and position of CSL binding sites at chromosome ends detected by ChIP-seq analysis in HDFs is provided in Supplementary Data 2. b Densitometric quantification of CSL binding to telomeres by ChIP assays of a HDF strain (AT1) with antibodies against the indicated proteins in parallel with non-immune IgG followed by DNA dot blot hybridization with probes detecting telomeric (Telo) or Alu repeats. Similar experiments with two other HDF strains (AT2 and AT3) are in Supplementary Fig. 7a. c Telomere binding assay by ChIP/qPCR with antibodies against endogenous CSL, in parallel with non-immune IgG, in HEK293T cells. d Telomere binding assays of HEK293T cells expressing FLAG-tagged CSL full length (FL), CSL BTD, CSL CTD, or CSL NTD domains by ChIP/qPCR with anti-FLAG antibodies followed by qPCR with telomere- and alu-specific primers. Non-immune IgGs were used for normalization. A second independent experiment is shown in Supplementary Fig. 7b. e Binding of recombinant CSL protein to telomeric repeat DNA (TELO) as measured by MST. Inset: thermophoretic movement of fluorescently-labeled TELO. A second independent experiment and specificity controls are shown in Supplementary Fig. 7c–f. f Summary table of dissociation constants (Kd) of the indicated proteins from TELO DNA as determined by MST assays. SCRAMBLED DNA was used as specificity control
Fig. 7
Fig. 7. UPF1/Ku70/Ku80 recruitment to telomeres is impaired by CSL loss.
a Telomere binding assay by ChIP/qPCR with antibodies against CSL and UPF1, individually or sequentially (CSL+UPF1), in parallel with non-immune IgG, in HDFs as in,. n(strain) = 3, *p < 0.05, two-tailed unpaired t-test. b Telomere binding assays by ChIP/qPCR with antibodies against the indicated proteins in HDFs (GB1) plus/minus siRNA-mediated CSL silencing (3 days) or CSL silencing and concomitant lentivirally induced CSL overexpression (OE). Similar experiments with two additional HDF strains (GB3 and GB4) are in Supplementary Fig. 8b. c Telomere binding assays by ChIP/qPCR analysis of the same cells as in b with antibodies against TRF1/TRF2. Similar experiments with two additional HDF strains (GB3 and GB4) are in Supplementary Fig. 8c. d Telomere binding assays by ChIP/qPCR with antibodies against the indicated proteins in HDFs (GB1) plus/minus lentivirally induced CSL overexpression (OE) for 3 days. Similar experiments with two additional HDF strains (GB3 and GB4) are in Supplementary Fig. 8d. e Telomere binding assays by ChIP/qPCR with anti FLAG-tag antibodies in HEK293T cells expressing increasing amounts (0, 250 ng, 500 ng, and 2 μg) of FLAG-tagged full length (FL) CSL together with full length (FL) Ku70 (2 μg). Non-immune IgGs were used for normalization. A second independent experiment is in Supplementary Fig. 8e. f PLAs of stromal fibroblasts (identified by VIMENTIN staining) from unaffected skin versus flanking SCC with TRF1 or TRF2 antibodies in combination with antibodies against the other indicated proteins. Scale bar, 5 μm. Quantification of CSL and UPF1/Ku70/Ku80/TRF1/TRF2 levels in the same samples are in Fig. 2b and Supplementary Fig. 8f, respectively. Triangles, circles, and squares point to values from flanking skin (black) and corresponding SCC (red) from three patients. Non-immune IgGs were used as control. Mean ± SD, n(cells) > 77 per condition, n(SCC) = 3, n(matched Skin) = 3, *p < 0.05, two-tailed paired t-test. Bars represent mean ± SD
Fig. 8
Fig. 8. Mapping, mutagenesis and docking analysis of CSL/UPF1/Ku70/Ku80 interaction.
a Co-IP analysis of HEK293T cells expressing MYC-tagged full length (FL) Ku70 and 1-257, 1-464, 1-573, or 257–609 domains plus/minus full length (FL) CSL with anti-MYC magnetic beads followed by immunoblotting with antibodies against the indicated proteins. b Co-IP analysis of HEK293T cells expressing MYC-tagged full length (FL) Ku70 or its 464–609 domain plus/minus full length (FL) CSL with anti-MYC magnetic beads followed by immunoblotting with antibodies against the indicated proteins. c Co-IP analysis of HEK293T cells expressing FLAG-tagged full length (FL) CSL and CSL BTD (166–334) domains plus/minus full length (FL) UPF1 with anti-FLAG magnetic beads followed by immunoblotting with antibodies against the indicated proteins. A second independent experiment is in Supplementary Fig. 9a. d Co-IP analysis of HEK293T cells expressing FLAG-tagged full length (FL) CSL and CSL point mutants (R192H, F235R, V237R, A258R, and Q307R) plus/minus full length (FL) Ku70 with anti-FLAG magnetic beads followed by immunoblotting with antibodies against the indicated proteins. Additional information on CSL point mutants is in Supplementary Fig. 9b. e Cartoon representation showing the docking complex between CSL (cyan)—Telomere DNA (orange)—Ku70 (magenta) and Ku80 (blue) using HDOCK server. Ku70 is shown to interact with CSL-BTD domain and bind to CSL bound telomere DNA through its SAP domain, while Ku80 binds indirectly through Ku70. f Close up view of the docking complex between CSL—Telomere DNA—Ku70 showing the α-helix of C-Ku domain (olive) interacting with CSL-BTD domain (cyan), and Ku70 SAP domain (magenta) interacting with telomere DNA (orange). The “hot spot” mutations that abrogate CSL-Ku70 interaction and Ku70-telomeric DNA association as in d are shown in pink (A258R and R192H). Additional non-interfering mutations are labeled in blue (F235R, V237R, and Q307R). gj Telomeric binding assays with antibodies against the indicated proteins followed by qPCR with telomere- and alu-specific primers in HEK293T cells expressing CSL full length (WT) and point mutants (R192H, F235R, V237R, A258R, and Q307R). Non-immune IgGs were used for normalization. Bars represent mean ±  SD

References

    1. Martincorena I, et al. Tumor evolution. High burden and pervasive positive selection of somatic mutations in normal human skin. Science. 2015;348:880–886. doi: 10.1126/science.aaa6806. - DOI - PMC - PubMed
    1. Dotto GP. Multifocal epithelial tumors and field cancerization: stroma as a primary determinant. J. Clin. Investig. 2014;124:1446–1453. doi: 10.1172/JCI72589. - DOI - PMC - PubMed
    1. Hanahan D, Weinberg RA. Hallmarks of cancer: the next generation. Cell. 2011;144:646–674. doi: 10.1016/j.cell.2011.02.013. - DOI - PubMed
    1. Tuhkanen H, et al. Frequent gene dosage alterations in stromal cells of epithelial ovarian carcinomas. Int J. Cancer. 2006;119:1345–1353. doi: 10.1002/ijc.21785. - DOI - PubMed
    1. Pelham RJ, et al. Identification of alterations in DNA copy number in host stromal cells during tumor progression. Proc. Natl Acad. Sci. USA. 2006;103:19848–19853. doi: 10.1073/pnas.0609635104. - DOI - PMC - PubMed

Publication types

MeSH terms