. 2019 Aug 29;10(1):3887.
doi: 10.1038/s41467-019-11638-3.

Oligodendrocyte precursor cells present antigen and are cytotoxic targets in inflammatory demyelination

Affiliations

Oligodendrocyte precursor cells present antigen and are cytotoxic targets in inflammatory demyelination

Leslie Kirby et al. Nat Commun. .

Abstract

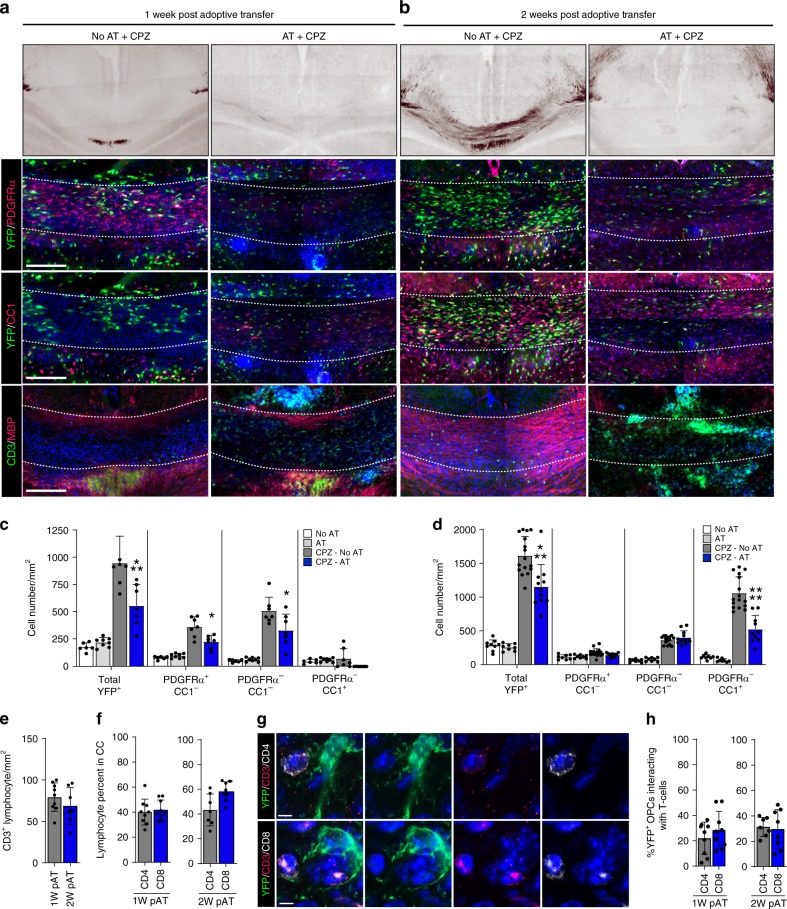
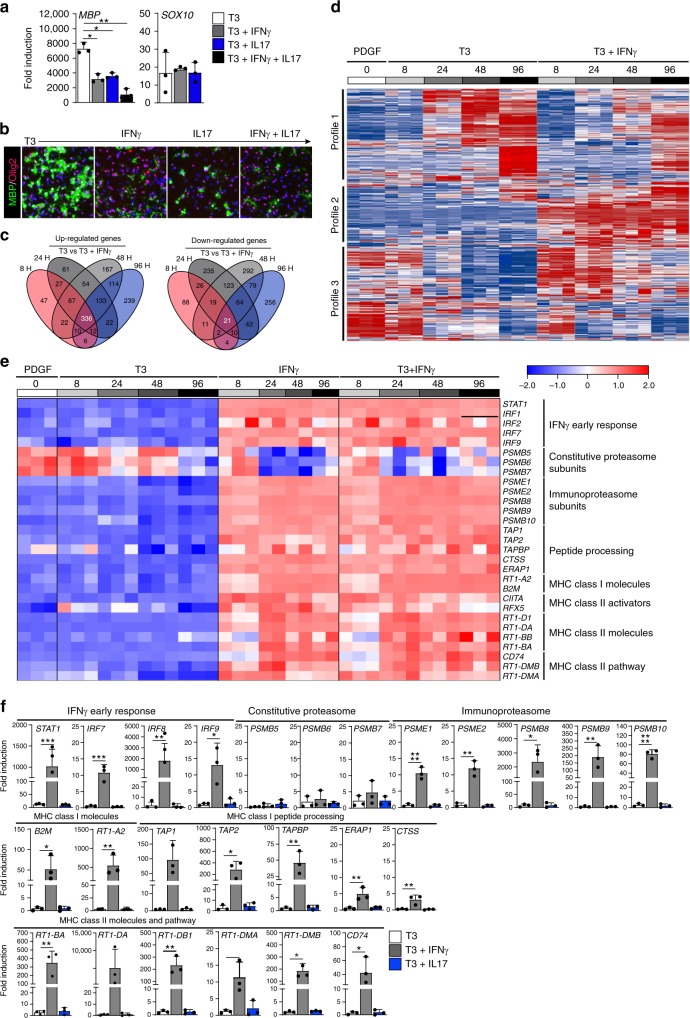
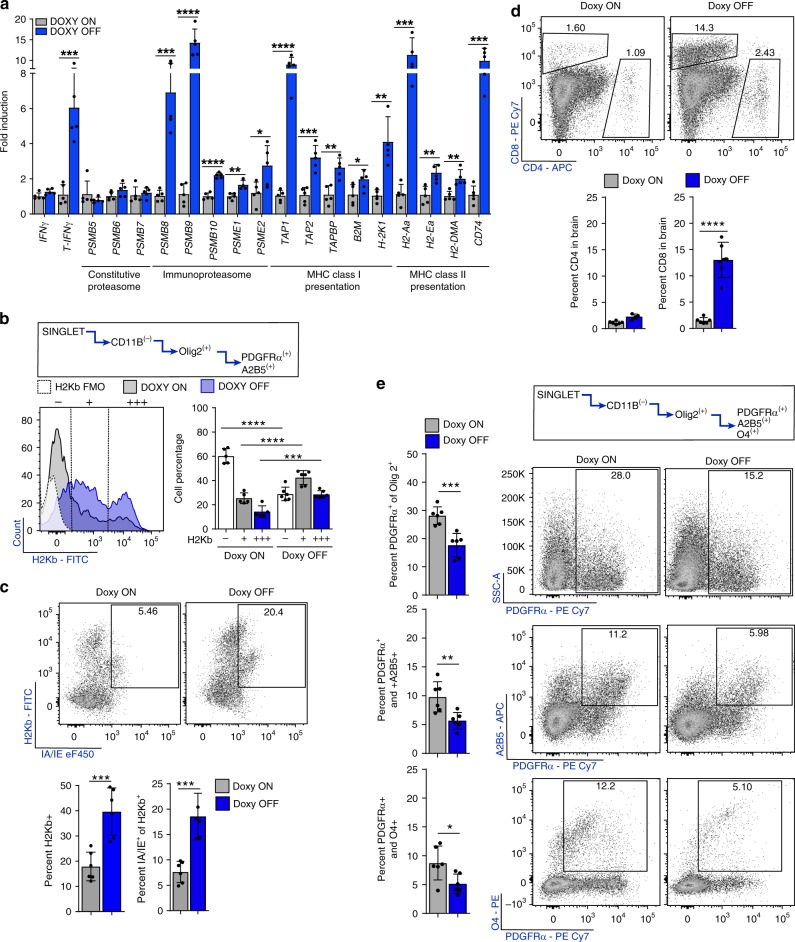
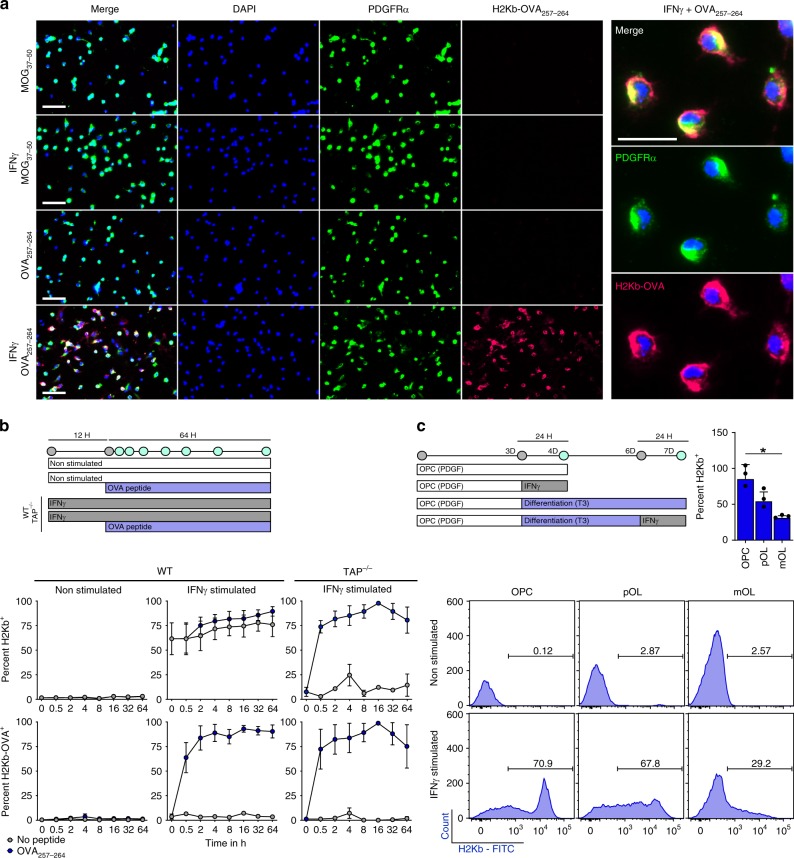
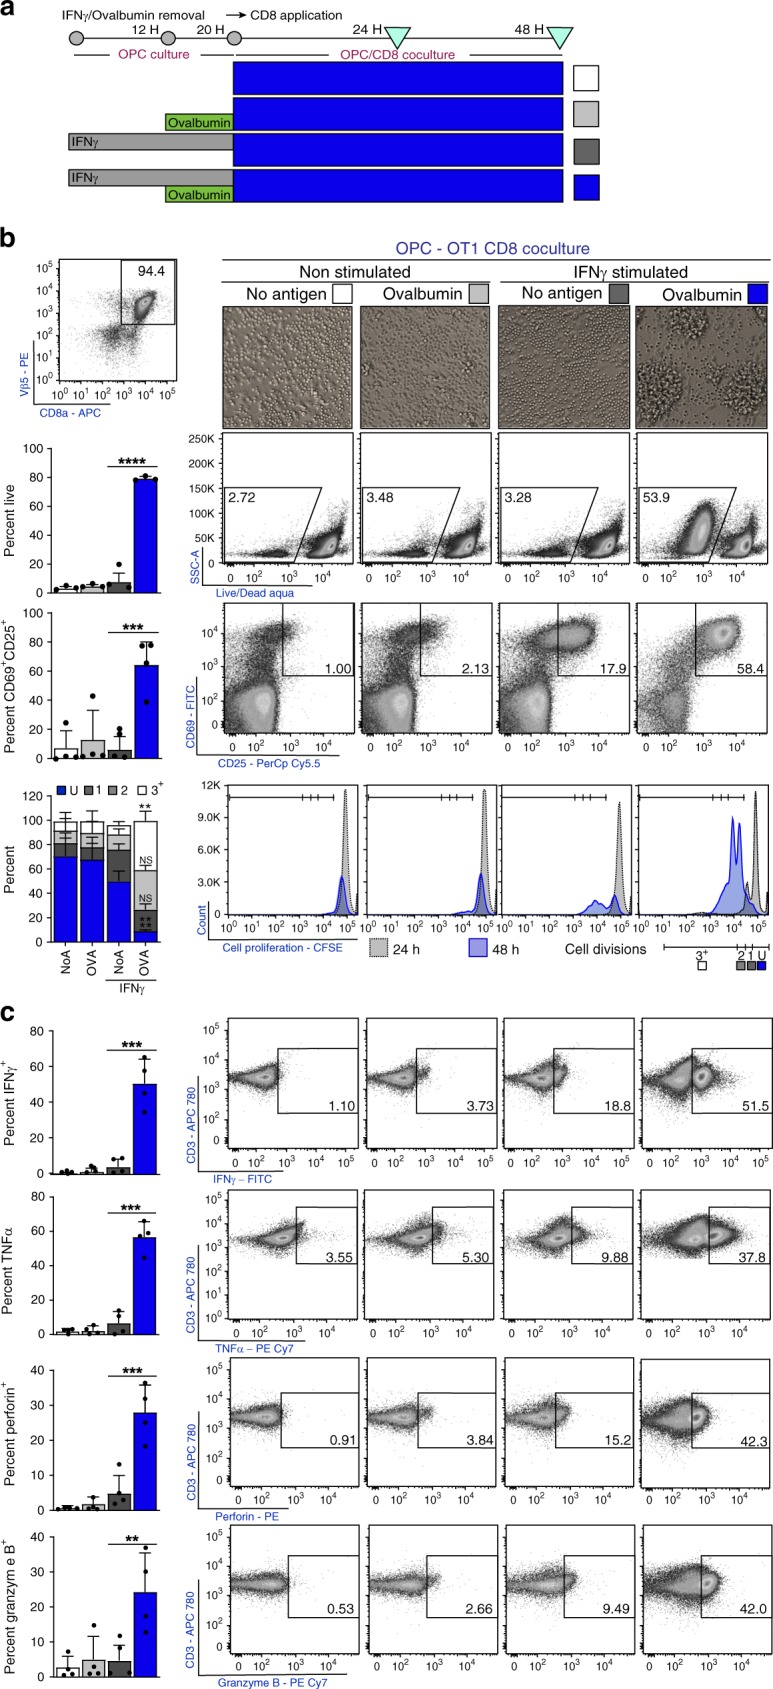
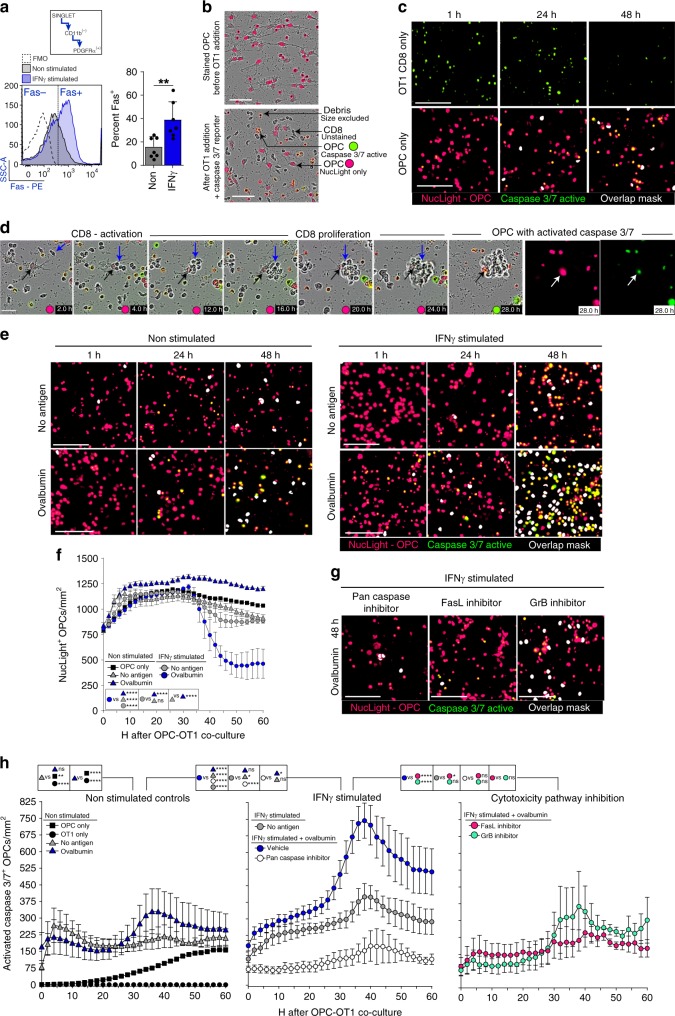
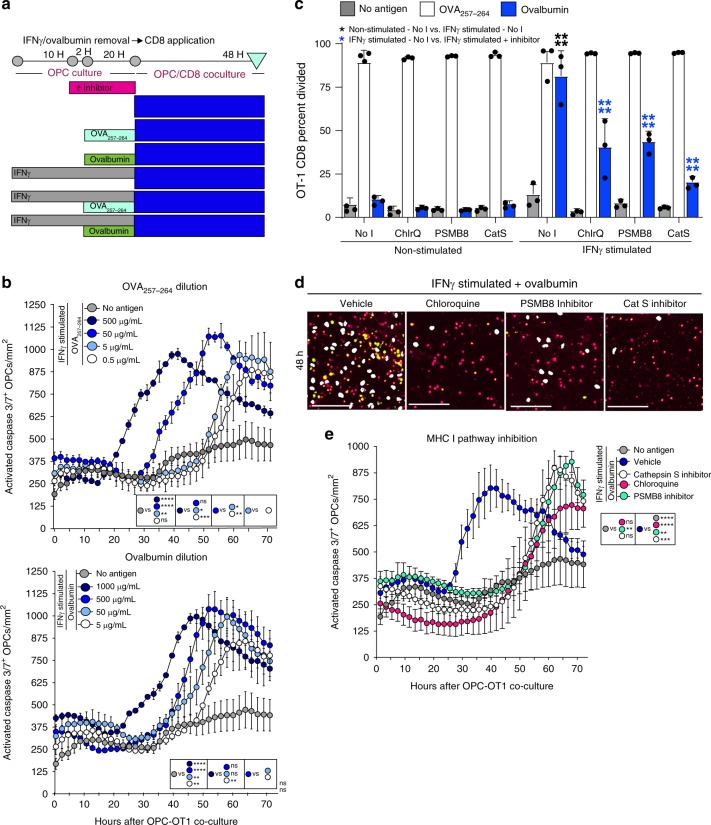
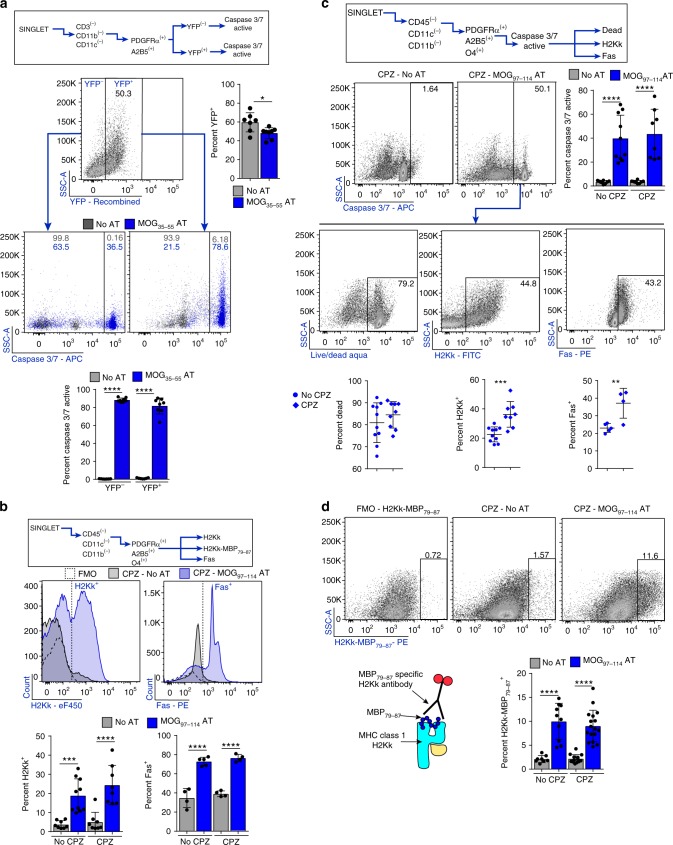
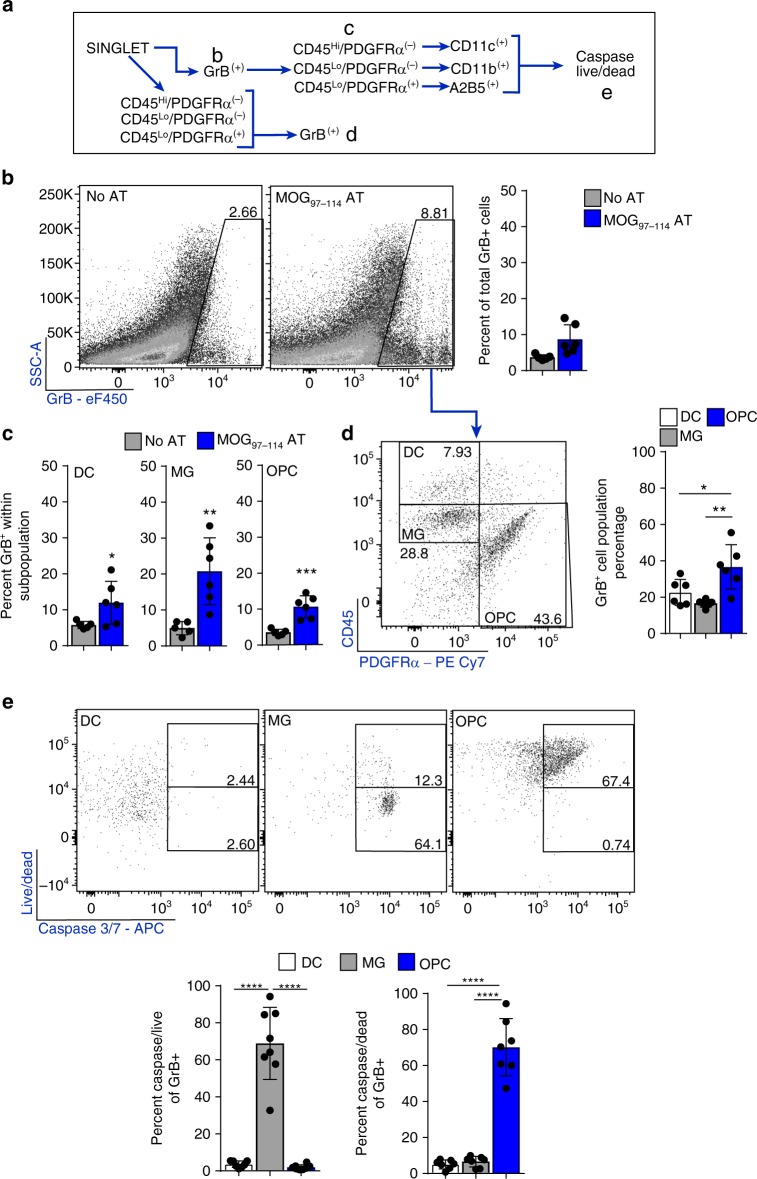
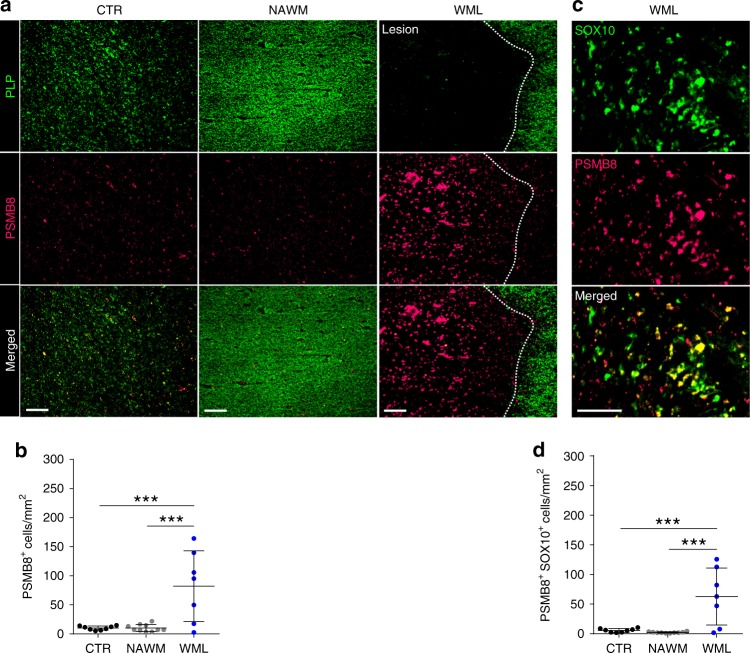
Oligodendrocyte precursor cells (OPCs) are abundant in the adult central nervous system, and have the capacity to regenerate oligodendrocytes and myelin. However, in inflammatory diseases such as multiple sclerosis (MS) remyelination is often incomplete. To investigate how neuroinflammation influences OPCs, we perform in vivo fate-tracing in an inflammatory demyelinating mouse model. Here we report that OPC differentiation is inhibited by both effector T cells and IFNγ overexpression by astrocytes. IFNγ also reduces the absolute number of OPCs and alters remaining OPCs by inducing the immunoproteasome and MHC class I. In vitro, OPCs exposed to IFNγ cross-present antigen to cytotoxic CD8 T cells, resulting in OPC death. In human demyelinated MS brain lesions, but not normal appearing white matter, oligodendroglia exhibit enhanced expression of the immunoproteasome subunit PSMB8. Therefore, OPCs may be co-opted by the immune system in MS to perpetuate the autoimmune response, suggesting that inhibiting immune activation of OPCs may facilitate remyelination.


Conflict of interest statement

The authors declare no competing interests.

Figures

Fig. 1
Fig. 1
Effector T cells inhibit remyelination by targeting OPCs. PDGFRα-CreER x Rosa26-YFP were kept on a 0.2% CPZ diet for a total of 4-weeks. 4HT injection at 3-weeks allowed for tracking of OPCs through the remyelination process. Approximately 8–10 million MOG35-55 specific T cells were injected into recipient mice at 4-weeks. a 1-week (scale bar 400 μm) and b 2-week images of Black Gold myelin staining (1st row). Representative images of the corpus callosum of brain sections (a, b 2nd row–4th row) stained with YFP/PDGFRα (a, b-2nd row) allowed tracking of recombined OPCs, stained with YFP/CC1 identified recombined mature oligodendrocytes (a, b-3rd row) and stained with CD3/MBP show the distribution of lymphocytes and myelin (a, b-4th row). c, d Quantification of 1-week (c) and 2-week (d) immunohistochemistry data to identify different stages of oligodendrocyte differentiation using the markers YFP, PDGFRα, and CC1. Oligodendrocyte lineage populations were compared between groups; No-CPZ (white; n = 6,8), No-CPZ+AT (gray; n = 8,8), CPZ (charcoal; n = 7,16), and CPZ+AT (blue; n = 7,11). Significance for quantified data c, d was assessed by one-way ANOVA analysis followed by Tukey’s multiple comparison analysis (α = 0.05, *≤0.05, **≤0.01, ***≤0.001, ****≤0.0001) [(Total YFP+ mean diff; 5w = 387.2; 95% CI = 153.3–621.1, CC1/PDGFRα+ mean diff; 5w = 136.8; 95% CI = −28–301.6, CC1/PDGFRα mean diff; 5w = 178.2; 95% CI = 13.39–343), (Total YFP+ mean diff; 6w = 461; 95% CI = 206−716.1, CC1+/PDGFRα mean diff; 6w = 535.9; 95% CI = 353.2–718.7)]. e Quantification of immunohistochemistry staining of total CD3 in the corpus callosum at 1-week and 2-week post AT (left). f Of the total CD3+ percent CD4+ (gray; n = 9,7) and CD8+ (blue; n = 9,8) was quantified at 1-week (middle) and 2-week (right). g Representative confocal images of CD3+/CD4+ T cell interaction (top) and CD3+/CD8+ T cell interaction (bottom) with YFP+ oligodendrocyte lineage cell (scale bar = 2 μm). h Proximity analysis of OPC interaction with CD4+/CD8+ T cells at 1 week and 2-weeks post AT. OPC to T cell interaction was determined using Imaris microscopy image analysis software and the percent of YFP+ OPCs interacting with either a CD4+ or CD8+ T cells indicates that OPCs do not preferentially interact with one T cell type at either 1 week or 2-weeks post AT. The range of YFP+ cells interacting with T cells is between 20 and 30% (CD4+ 1-week; 21.9%, 95% CI = 12.2–31.7 CD8+ 1-week; 28.4%, 95% CI = 17.1–39.8, CD4+ 2-week; 31.3% 95% CI = 24.5–38.2, CD8+ 2-week; 25.6%, 95% CI = 16.7–42.4), as analyzed by an unpaired Student’s t-test (P*≤0.05, **≤0.01, ***≤0.001, ****≤0.0001)
Fig. 2
Fig. 2
IFNγ promotes antigen cross-presentation in OPCs. Isolated and PDGF (20 ng/mL) expanded postnatal rat OPCs (P4-P6) were differentiated with T3 (white), T3+IFNγ (10 ng/mL; charcoal), T3+IL17 (50 ng/mL; blue), or T3+IFNγ+IL-17 (black) for 96 h prior to assessment using qPCR (a) and ICC staining for MBP and Olig2 (b). Isolated and PDGF (20 ng/mL) expanded postnatal rat OPCs (P4-P6) were left undifferentiated (0 h; white) or differentiated with T3 (10 nM), IFNγ (10 ng/mL), T3 + IFNγ, for 8 hrs (light gray), 24 hrs (medium gray), 48 h (charcoal) and 96 hrs (black) to compare gene expression between groups while obtaining information at multiple time points. ce Affymetrix gene arrays analysis was performed from three independent biological replicates. c Venn diagram summarizing the number and overlap of up-regulated (left) and down-regulated (right) genes based on time point. d Global heat map of all probes clustered into three gene expression patterns comparing PDGF, T3, and T3+IFNγ at all time points. e Targeted heat map comparing PDGF, T3, IFNγ, and T3+IFNγ at all time points. Displayed genes were identified from GSEA analysis (supplement 3). f Quantitative PCR validation of OPCs differentiated with T3 (white), T3+IFNγ (10 ng/mL; gray), or T3+IL17 (50 ng/mL; blue) for 96 h prior to assessment. Error bars represent the standard deviation from three independent primary isolations and experiments. Significance for qPCR analysis was determined by one-way ANOVA analysis followed by Dunnett’s multiple comparison analysis where T3+IFNγ or T3+IL17 were compared to T3 alone control (P*≤0.05, **≤0.01, ***≤0.001, ****≤0.0001)
Fig. 3
Fig. 3
CNS restricted IFNγ promotes CD8 infiltration and MHC on OPCs. TRE/IFNγ × GFAP/tTA mice were fed CPZ for 6 weeks and either maintained on doxycycline (gray; n = 5) or removed from doxycycline (blue; n = 5) to induce IFNγ expression. Two-weeks after CPZ withdrawal the corpus callosum was dissected and qPCR analysis was performed (a). Significance for qPCR was determined by two-tailed, unpaired t-test between doxycycline and no doxycycline conditions. b Whole brains from TRE/IFNγ × GFAP/tTA mice under the same experimental paradigm were isolated for flow cytometric analysis. The OPC population was determined by CD11b negativity and Olig2, A2B5, and PDGFRα positivity. H2Kb expression is shown in the histogram plot in which the staining control FMO (white) is compared to mice kept on doxycycline (gray; n = 5) and mice removed from doxycycline (blue; n = 5). Significance for flow cytometry was determined by two-tailed, unpaired Student’s t-test between doxycycline and no doxycycline conditions (H2Kb mean diff = −31.3 ± 3.5; 95% CI = 39.3–(–)23.4, H2Kb+ mean diff = 17.0 ± 3.2, 95% CI = 9.9–24.2, H2Kb+++ mean diff = 14.3 ± 2.4, 95% CI = 8.8–19.7). c The same gating strategy was used to determine MHC Class II (IA/IE) expression by H2Kb. Significance for flow cytometry was determined by two-tailed, unpaired t-test between doxycycline (gray; n = 6) and no doxycycline (blue; n = 6) conditions were compared (IAIE+ of H2Kb+ mean diff = 10.9 ± 2.1, 95% CI = 6.3–15.5). CD4+/CD8+ populations were also analyzed within the whole brain tissue as determined by flow cytometry. The CD4+ population remains unchanged between doxycycline (gray; n = 6) and doxycycline removal (blue; n = 6). However, the removal of doxycycline significantly increased the number of CD8+ cells in the brain. Significance for flow cytometry was determined by two-tailed, unpaired Student’s t-test between doxycycline and no doxycycline conditions were compared, (CD8+ T cell mean diff = 11.55 ± 1.399, 95% CI = 8.429–14.66). e Percent OPC numbers were also analyzed for PDGFRα, A2B5, and O4. PDGFRα+ (top), PDGFRα+/A2B5+ (middle), and PDGFRα+/O4+ (bottom) OPC percentages were all significantly decreased in animals in which doxycycline was removed. Significance for flow cytometry was determined by two-tailed, unpaired Student’s t-test between doxycycline and no doxycycline conditions were compared (PDGFRα+ mean diff = −10.5 ± 2.1, 95% CI = −15.3–(−)5.8, PDGFRα+/A2B5+ mean diff = −4.1 ± 1.2, 95% CI = −6.9–(−)1.4, PDGFRα+/O4+ mean diff = −3.6 ± 1.4, 95% CI = −6.7–(−)0.5). All error bars represent standard deviation. (P*≤0.05,**≤0.01,***≤0.001,****≤0.0001)
Fig. 4
Fig. 4
IFNγ induces peptide processing and presentation in OPCs. a Immunocytochemical staining of primary C57BL/6 mouse OPCs which were cultured under PDGF conditions (20 ng/mL) or with IFNγ (10 ng/mL) for 12 h prior to addition of the MHC class I restricted MOG37–50 peptide (50 μg/mL) or OVA257–264 peptide (50 μg/mL) (scale bar = 50 μm). MCH class I restricted ovalbumin peptide presentation on OPCs was determined using PDGFRα and H2Kb-OVA257–264 antibodies. The right panel shows high magnification (25 μm) of IFNγ + OVA257-264 culture. b Time course experiments of WT and TAP−/− OPCs cultured with/without IFNγ and with/without OVA257–264 peptide. Treatment of IFNγ was completed for 12 h prior to the addition of no peptide (gray) or OVA257–264 peptide (blue) (c). MHC class I expression was determined from three stages of oligodendrocyte lineage cells either unstimulated or stimulated with IFNγ for 24 h. Oligodendrocyte lineage populations were defined by PDGFRα, A2B5, and O4 markers under proliferative or differentiating conditions (OPC vs. pOL mean diff = 30.9, 95% CI = −13.6–75.5, OPC vs. mOL mean diff = 54.1, 95% CI = 5.2–102.9)
Fig. 5
Fig. 5
OPCs cross-present ovalbumin and activate CD8+ T cells. a Timeline and experimental design. OPCs were cultured in PDGF to inhibit differentiation and stimulated with IFNγ (10 ng/mL) for 12 h prior to Ovalbumin (500 μg/mL) protein addition. Both IFNγ and Ovalbumin protein were incubated with OPCs for a total of 8 h prior to washing the cultures to remove unprocessed Ovalbumin. OT-1 CD8+ T cells were isolated by magnetic sorting then stained with Cell Proliferation Dye eFluor 450 (10 μM) prior to initiation of CD8/OPC co-culture. In all, 24–48 h after the start of the co-culture CD8 were analyzed for activation. (b; top left) CD8 percentage, at 24 h after the co-culture was initiated, was determined using Vβ5, CD3, and CD8, and subsequently used as a parent gate for all flow plots in the figure. b CD8 morphology (top), survival (2nd row) (mean diff = −71.6, 95% CI = −107.7 to −35.6), activation status using CD25+/CD69+ (3rd row) (mean diff = −58.1, 95% CI = −32.7 to −6.6), and proliferation (bottom) (Undivided mean diff = 41.1, 95% CI = 17.8–64.4, 3+ Division mean diff = −32.8, 95% CI = −56.1 to −9.5) with quantification (left to each panel) of OT-1s cultured with OPCs; no peptide (white; n = 4), Ovalbumin (light gray; n = 4), IFNγ + no peptide (gray; n = 4), and IFNγ + Ovalbumin (blue; n = 4). c Cytokine and granular protein profiling of OT-1s; IFNγ (1st row) (mean diff = −46.5, 95% CI = −73.4 to −19.36), TNFα (2nd row) (mean diff = −50.1, 95% CI = −72.9 to −27.3), perforin (3rd row) (mean diff = −23.2, 95% CI = −35.6−(−)10.8) and granzyme B (4th row) (mean diff = −32.7, 95% CI = −32.7–(−)6.6). Significance for all quantified data was assessed by one-way ANOVA analysis followed by Tukey’s multiple comparison analysis (P*≤0.05, **≤0.01, ***≤0.001, ****≤0.0001). Error bars represent standard deviation for four biological replicates
Fig. 6
Fig. 6
Caspase3/7 increases in OPCs that activate OT-1 CD8+ T cells. a Fas surface expression on OPCs, either not stimulated (gray) or IFNγ stimulated (blue), as determined by flow cytometry for PDGFRα+/CD11b (FMO; white). Significance was determined by unpaired, two-tailed Student’s t-test (P = 0.0046). Error bars represent standard deviation; 7 independent experiments. b Descriptive images of the cytotoxicity assay using NucLight stained OPCs and a Caspase 3/7 reporter. c Single cell controls of OT-1 CD8s (black circle) and OPCs (black square) cultured separately for a total of 60 hours with caspase 3/7 detection reagent and nuclear staining in OPCs. Representative images for 0 h, 24 h, and 48 h are shown and quantified from 0 to 60 h (h). d Time-lapse phase contrast and fluorescence imaging of OPC-CD8 co-cultures. At 2.0 h CD8s have an elongated/clustering morphology. At 20.0–28.0 h, CD8 cluster with the underlying caspase3/7 active OPC. e Time-lapse imaging of OPC-CD8 co-cultures; no antigen (gray triangle), ovalbumin protein (blue triangle), IFNγ stimulated OPC only (white circle). IFNγ+no antigen (gray circle) and IFNγ+ovalbumin protein (blue circle) [(IFNγ+no antigen vs. IFNγ+ovalbumin mean diff = −11410; 95% CI = −16239–(−)6581)] (h). f Total NucLight positive OPC quantification of the time course of the OPC-OT-1 co-culture. IFNγ stimulated OPCs that were pulsed with ovalbumin protein before the co-culture have a significant increase in number by 46 h. g At the time of CD8+ T cell addition to OPCs stimulated with IFNγ+ovalbumin, pan caspase inhibitor (white circle;Q-VD-OPH; 10 μM) [(Vehicle vs. Q-VD-OPH mean diff = 21686; 95% CI = 15771–27601)], granzyme B inhibitor (green circle; 300 nM) [(Vehicle vs. GrB inhibitor mean diff = 16369; 95% CI = 10454–22284)] and FasL decoy receptor (pink circle; DcR3; 300 nM) [(Vehicle vs. DcR3 mean diff = 17751; 95% CI = 11836–23666)] were applied to the co-culture to determine the contribution of CD8 cytotoxicity pathways to OPC caspase activity. Significance of differences between conditions is shown in the legend for each figure. Significance for all quantified data was determined by area under the curve analysis followed by one-way ANOVA and Tukey’s multiple comparisons test (P*≤0.05, **≤0.01, ***≤0.001, ****≤0.0001). All Error bars represent standard deviation from 3 to 5 experiments (unless otherwise specified)
Fig. 7
Fig. 7
Antigen concentration and antigen pathway inhibitors modulate cytotoxicity. a Timeline of experimental methodology and treatment times. b Quantification of time-lapse imaging of OVA257–264 peptide (0.5–500 μg range) (top) [(500 μg/mL vs.5.0 μg/mL mean diff = 10320; 95% CI = 1902–18738)] and ovalbumin (5–1000 μg range) (bottom) [(1000 μg/mL vs.50 μg/mL mean diff = 12641; 95% CI = 4199–21083)] concentrations added to OPCs stimulated with IFNγ and antigen prior to CD8 addition. c Proliferation analysis of OPC-CD8 co-cultures treated with antigen cross-presentation pathway inhibitors. No inhibitor (No I) or each inhibitor were added to OPC culture for two hours prior to the addition of OVA257–264 (white) or Ovalbumin (blue), and then left in wells during processing and presentation phase. Chloroquine was added at 100 μM. ONX-0914, PSMB8 inhibitor was added at 30 nM. Cathepsin S inhibitor was added at 10 nM. In all, 48 h after CD8 co-culture was initiated cell proliferation of the Vβ5, CD3, CD8a population of CD8s was analyzed for cell division and total percent divided. Significance for all quantified data was either assessed by two-way ANOVA analysis followed by a Tukey’s multiple comparison analysis [(NoT vs. Chloroquine mean diff = 40.8; 95% CI = 27.1–54.4, NoT vs. ONX-0914 mean diff = 37.6; 95% CI = 24.0–51.3, NoT vs. Cathepsin S inhibitor mean diff = 60.9; 95% CI = 47.2–74.6)]. Error bars in all graphs represent standard deviation from three experiments. d, e Time-lapse images and quantification of from 0 to 60 h with the antigen presentation pathway inhibitors; Chloroquine (pink circle; 300 μM) [(mean diff = 18203; 95% CI = 11864–24542)], Cathepsin S inhibitor (white circle; 30 nM) [(mean diff = 9775; 95% CI = 3436–16114)], PSMB8 inhibitor (green circle; ONX-0914; 30 nM) [(mean diff = 13059; 95% CI = 6720–19398)]. Significance of differences between conditions is shown in the legend for each figure. Significance was determined by area under the curve analysis followed by one-way ANOVA and Tukey’s multiple comparisons test. Error bars represent standard deviation from 3 to 5 experiments. (P*≤0.05, **≤ 0.01, ***≤0.001, ****≤0.0001)
Fig. 8
Fig. 8
OPCs express myelin peptide on MHC class I and are cytotoxic targets in vivo. C57BL/6 PDGFRα-CreER × Rosa26-YFP were kept on a CPZ diet for 4 weeks. After 3 weeks, 4-HT was injected to induce Cre recombination in PDGFRα expressing cells and MOG35-55 reactive T cells were AT. Cells were isolated ex vivo and analyzed by flow cytometry. a The OPC population was distinguished based on YFP and YFP+ expression and analyzed for caspase 3/7 activity, quantification below; CPZ (gray) and CPZ+MOG35-55 AT (blue). b–d Alternatively, C3HeB/FeJ donor mice were immunized with whole recombinant rat MOG1-125 to induce EAE, and myelin-specific CD4 T cells were isolated ex vivo and reactivated with peptide. Syngeneic recipient mice were fed a CPZ diet for 6 weeks before AT. b H2Kk (left) [No CPZ vs. AT mean diff = −15.2, 95% CI = −24.7–(−)5.6, CPZ vs. CPZ+AT mean diff = −19.3, 95% CI = −29.4–(−)9.3], and Fas (right) (No CPZ vs. AT mean diff = −38.1, 95% CI = −49.6–(−)26.7, CPZ vs. CPZ+AT mean diff = −37.4, 95% CI = −49.5–(−)25.3) expression from the OPC population was determined by flow cytometry analysis with quantification below each flow histogram; no AT (gray; n = 8,8,4), MOG97-114 AT (blue; n = 9,10,5), CPZ+no AT (gray; n= 8,12,4), and CPZ + MOG97-114 AT (blue; n = 8,17,4). Statistical significance was determined by one-way ANOVA analysis followed by Tukey’s multiple comparisons. Error bars represent the standard deviation. c Caspase 3/7 activity was determined by flow cytometry [No CPZ vs. AT mean diff = −36.4, 95% CI = −55.4–(−)17.5, CPZ vs. CPZ+AT mean diff = −39.9, 95% CI = −59.9–(−)20.0]. Further population analysis was done from the caspase 3/7 active population by Live/Dead staining (top), H2Kk expression (middle) (Diff between means = 13.7 ± 3.3, 95% CI = 6.7–20.7) and FAS expression (bottom) (Diff between means = 14.1 ± 3.9, 95% CI = 4.8–23.4). d H2Kk-MBP79-87 staining from OPCs with FMO staining control and quantification below. At peak disease flow cytometry was completed on whole brain tissue to assess intracellular granzyme b staining in target cells (No CPZ vs. AT mean diff = −7.9, 95% CI = −11.3 to −4.5, CPZ vs. CPZ + AT mean diff = −6.9, 95% CI = −9.5 to −4.3)
Fig. 9
Fig. 9
OPCs are targets for granzyme B mediated cytotoxicity in vivo. C3HeB/FeJ donor mice were immunized with whole recombinant rat MOG1–125 to induce EAE, and myelin-specific CD4 T cells were isolated ex vivo and reactivated with peptide. Syngeneic recipient mice received MOG97–114 T cell AT then killed at peak disease. a Cells gating strategy for flow cytometry analysis. b Total granzyme b staining from the initial cell and singlet gates. Percent granzyme B positive staining is compared between No AT (gray; n = 5) and MOG97–114 AT (blue; n = 6) (Diff between means = 5.0 ± 1.9, 95% CI = 0.8–9.2). c Percent granzyme B staining within designated target cell populations were compared between No AT (gray; n = 5) and MOG97–114 AT (blue; n = 6) (DC diff between mean = 6.2 ± 2.7, 95% CI = 0.1-12.4, Microglia diff between means = 15.8 ± 4.3, 95% CI = 6.2–25.4, OPC diff between means = 7.1 ± 1.4, 95% CI = 3.9–10.4) . d Total granzyme B positive cell population, within the AT group, was identified using PDGFRα and CD45 levels and quantified below (DC vs. microglia mean diff = −25.8, 95% CI = −41.2–(−)10.5, DC vs. OPC mean diff = −18.6, 95% CI = −33.9–(−)3.2). e DC, MG, and OPCs populations from the total granzyme B positive population was assessed by caspase 3/7 reporter and live/dead staining to determine viability of each population and quantified for caspase+/live and caspase+/dead populations as shown by bottom and top box gates (respectively) in flow plots. Quantification of data is shown below (caspase+/dead; microglia vs. OPC mean diff = −65.2, 95% CI = −75.9–(−)54.5, DC vs. OPC mean diff = −66.0, 95% CI = −76.7–(−)55.3). Significance for all quantified data was either assessed by one-way ANOVA analysis followed by Tukey’s multiple comparison analysis or unpaired, two-tailed t-test (P*≤0.05, **≤ 0.01, ***≤0.001, ****≤0.0001). Error bars in all graphs represent standard deviation
Fig. 10
Fig. 10
MS lesions have high PSMB8 expression in oligodendrocytes lineage cells. a Postmortem tissue from healthy controls or MS patients’ normal appearing white matter (NAWM) and white matter lesions (WML) was analyzed for the immunoproteasome specific subunit, PSMB8 and proteolipid protein (PLP) (scale bar 200 μm). b PSMB8 staining colocalization with SOX10 staining. c, d Quantification of imaging. A total of eight healthy controls, ten NAWM and seven WML sections were counted. Significance was determined by one-way ANOVA analysis followed by Tukey’s multiple comparison analysis (P*≤0.05, **≤0.01, ***≤0.001, ****≤0.0001). Error bars in all graphs represent standard deviation

References

    1. Hughes EG, Kang SH, Fukaya M, Bergles DE. Oligodendrocyte progenitors balance growth with self-repulsion to achieve homeostasis in the adult brain. Nat. Neurosci. 2013;16:668–676. doi: 10.1038/nn.3390. - DOI - PMC - PubMed
    1. Kirby BB, et al. In vivo time-lapse imaging shows dynamic oligodendrocyte progenitor behavior during zebrafish development. Nat. Neurosci. 2006;9:1506–1511. doi: 10.1038/nn1803. - DOI - PubMed
    1. Bergles ,DE, Richardson ,WD. Oligodendrocyte development and plasticity. Cold Spring. Harb. Perspect. Biol. 2015;8:a020453. doi: 10.1101/cshperspect.a020453. - DOI - PMC - PubMed
    1. Chang A, Nishiyama A, Peterson J, Prineas J, Trapp BD. NG2-positive oligodendrocyte progenitor cells in adult human brain and multiple sclerosis lesions. J. Neurosci. 2000;20:6404–6412. doi: 10.1523/JNEUROSCI.20-17-06404.2000. - DOI - PMC - PubMed
    1. Wang C, et al. IL-17 induced NOTCH1 activation in oligodendrocyte progenitor cells enhances proliferation and inflammatory gene expression. Nat. Commun. 2017;8:15508. doi: 10.1038/ncomms15508. - DOI - PMC - PubMed

Publication types

MeSH terms