. 2020 Jan;100(1):161-173.
doi: 10.1038/s41374-019-0309-7. Epub 2019 Aug 29.

The NanoSuit method: a novel histological approach for examining paraffin sections in a nondestructive manner by correlative light and electron microscopy

Affiliations

The NanoSuit method: a novel histological approach for examining paraffin sections in a nondestructive manner by correlative light and electron microscopy

Hideya Kawasaki et al. Lab Invest. 2020 Jan.

Abstract

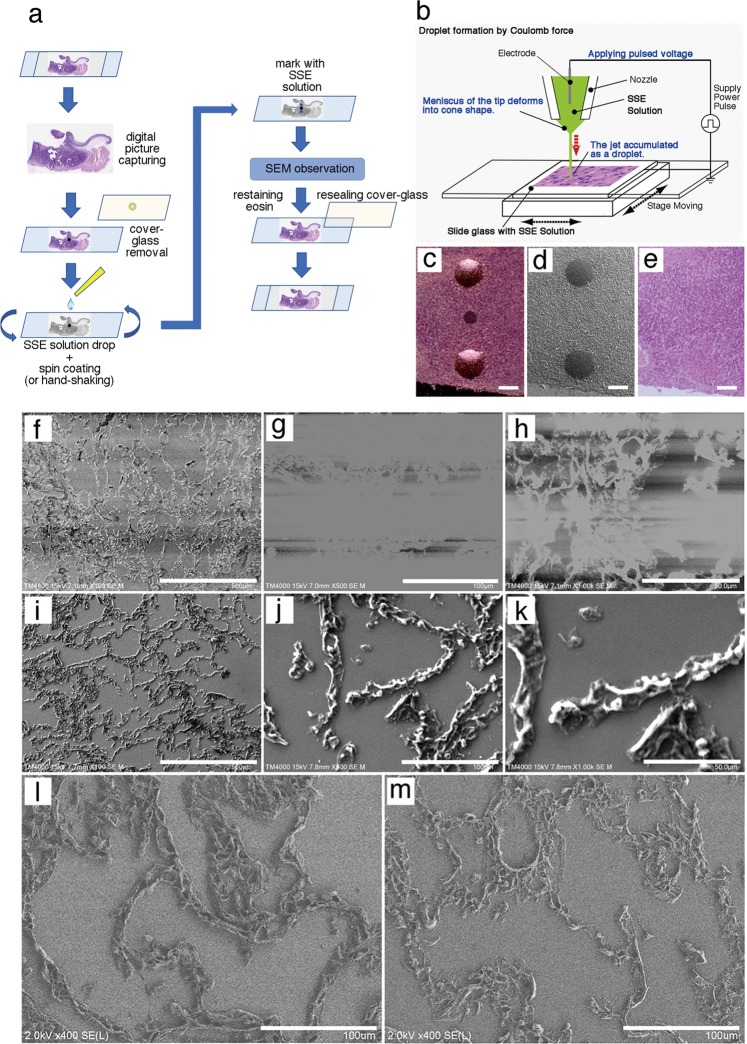
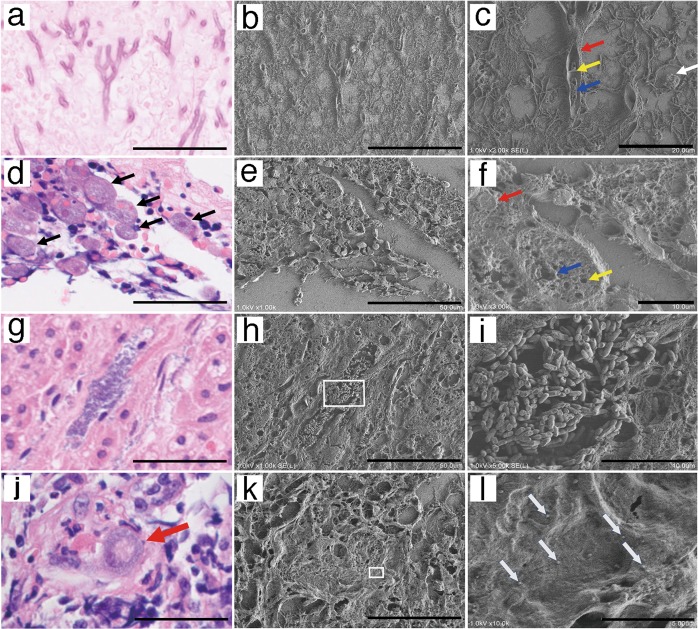
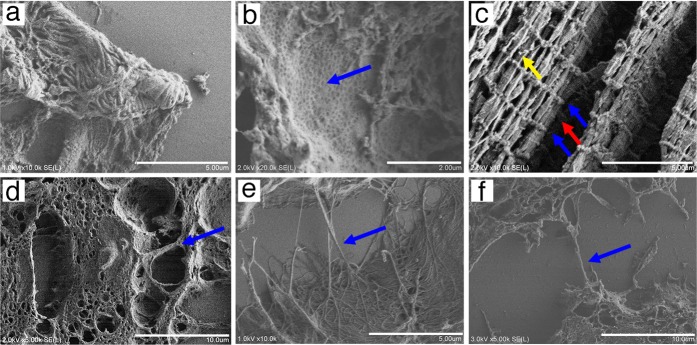
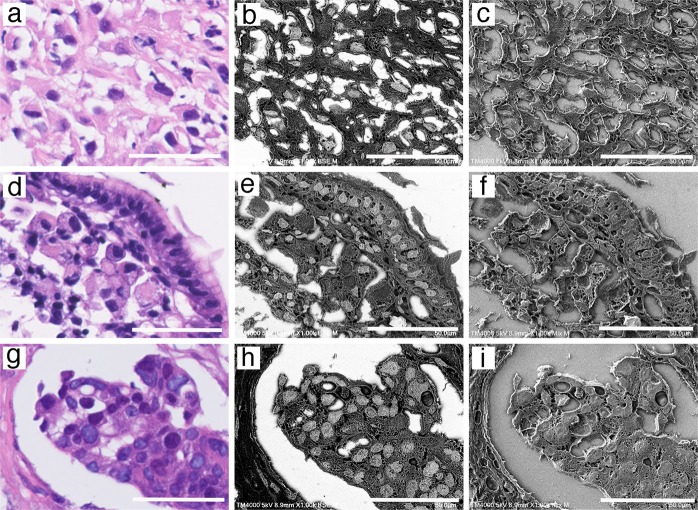
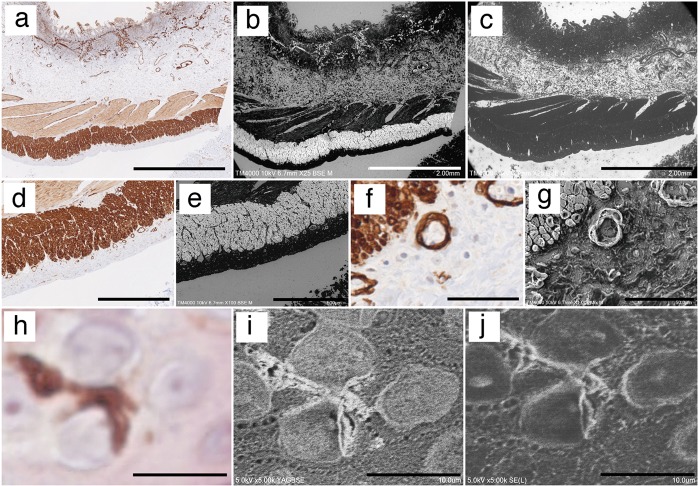
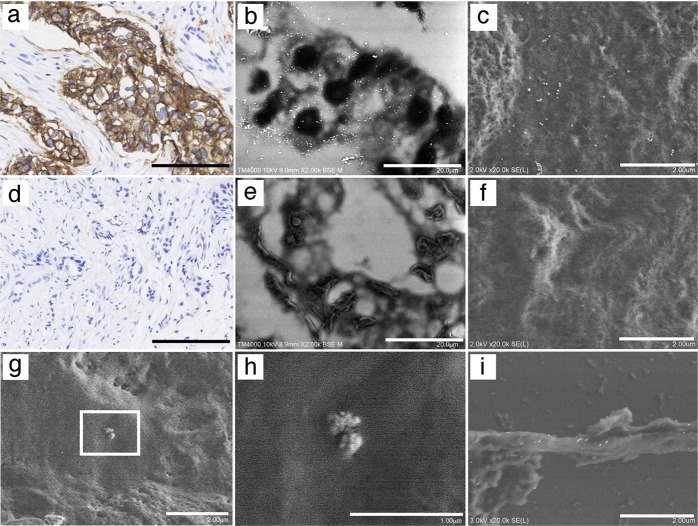
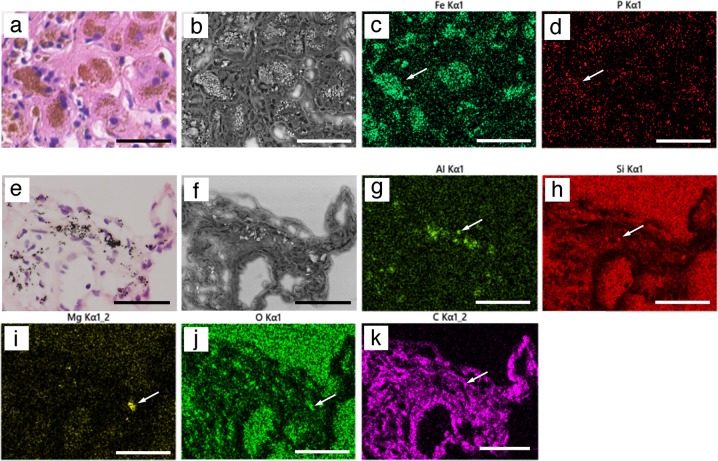
Histological examination using the light microscopy is currently the gold standard for life science research and diagnostics. However, magnified observations are limited because of the limitations intrinsic to light microscopy. Thus, a dual approach, known as correlative light and electron microscopy (CLEM), has emerged, although several technical challenges remain in terms of observing myriad stored paraffin sections. Previously, we developed the NanoSuit method, which enabled us to keep multicellular organisms alive/wet in the high vacuum of a scanning electron microscope by encasing the sample in a thin, vacuum-proof membrane. The approach uses the native extracellular substance (ECS) or an ECS-mimicking substance to polymerize a membrane by plasma or electron beam irradiation. Since the resulting NanoSuit is flexible and dense enough to prevent a living organism's bodily gas and liquids from evaporating (which we refer to as the "surface shield enhancer" (SSE) effect), it works like a miniature spacesuit with sufficient electron conductivity for an SEM observation. Here, we apply the NanoSuit method to CLEM analysis of paraffin sections. Accordingly, the NanoSuit method permits the study of paraffin sections using CLEM at low and high magnification, with the following features: (i) the integrity of the glass slide is maintained, (ii) three-dimensional microstructures of tissue and pathogens are visualized, (iii) nuclei and 3,3'-diaminobenzidine-stained areas are distinct because of gold chloride usage, (iv) immunohistochemical staining is quantitative, and (v) contained elements can be analyzed. Removal of the SSE solution after observation is a further advantage, as this allows slides to be restained and stored. Thus, the NanoSuit method represents a novel approach that will advance the field of histology.


Conflict of interest statement

The authors declare that they have no conflict of interest.

Figures

Fig. 1
Fig. 1
NanoSuit method for observing paraffin sections by scanning electron microscopy (SEM). a Workflow for correlative microscopy analysis of paraffin sections with the NanoSuit method. b On-demand droplet spotter system used to place marks around the region of interest using surface shield enhancer (SSE) solution. Droplets of undiluted SSE stock solution were identified as markers around the region of interest (black mark) and imaged using a light microscope (c) and a low-vacuum scanning electron microscopy (Lv-SEM) (d). e Image of a tissue section restained with hematoxylin and eosin after SEM observation and removing the SSE solution markings. The white bars shown in c–e represent 1 mm. fh High charging effects of control sections without SSE solution (Lv-SEM in the secondary electron image). ik SSE solution-coated sections showing a reduced charging effect (Lv-SEM in the secondary electron image). l, m field emission-scanning electron microscope (FE-SEM) secondary electron image of lung alveolar tissue. l NanoSuit-coated lung tissue. m Carbon-coated lung tissue. The scale bars represent 500 (f, i), 100 (g, j, l, m), and 50 μm (h, k)
Fig. 2
Fig. 2
Application of the NanoSuit method to pathogens in paraffin sections. ac Lung infection with Aspergillus a hematoxylin and eosin (H&E) image. b Identical field emission-scanning electron microscope (FE-SEM) secondary electron image. c Enlarged FE-SEM secondary electron image. Sporangium (white arrow), cross-sectional three-dimensional (3D) structure of Aspergillus hyphae including the cell wall (red arrow), septum (yellow allow), and nuclei (blue arrow). df Entamoeba histolytica infection of the colon. d H&E image. Multiple amoeba bodies (black arrows). e Identical FE-SEM secondary electron image. f Enlarged FE-SEM secondary electron image. Cross-sectional 3D structures of an amoeba body including vacuolar structures (contractile vacuole [blue arrow], food vacuole [yellow arrow]) in the cytoplasm and the nucleus (red arrow). gi Bacterial infection. g H&E image. h Identical FE-SEM secondary electron image of g. i Magnified FE-SEM secondary electron image of h (white square). jl Cytomegalovirus (CMV) infection of a kidney. j A cytomegalic inclusion body of an H&E section is shown (red arrow). k Identical FE-SEM secondary electron image. The white square is magnified in l. l Enlarged FE-SEM secondary electron image. Multiple human CMV-like particles adjacent to a cytomegalic inclusion body. The scale bars represent 50 (a, b, d, e, g, h, j, k), 20 (c), 10 (f, i), and 5 μm (l)
Fig. 3
Fig. 3
Microstructures of paraffin section tissues visualized by the NanoSuit method in field emission-scanning electron microscopy secondary electron images. a Kidney podocyte. b Inner aspect of fenestrated endothelium (blue arrow) of the glomerular capillary. c Skeletal muscle tissue. Striated pattern of myofibrils (Z lines within I-band [blue arrows] and M lines within an A-band [red arrow]) and spherical mitochondria (yellow arrow). d Projection structure in a malignant mesothelioma specimen (blue arrow). e Collagenous fibril in the perivascular area of colon tissue. f Connecting fibers between malignant breast cancer cells (tunneling nanotubes [TnT]-like structures). The scale bars represent 10 (d, f), 5 (a, c, e), and 2 μm (b)
Fig. 4
Fig. 4
Identification of the nucleus in paraffin sections with gold (III) chloride using the NanoSuit method. Microscopic examination of: ac malignant mesothelioma sample, df gastric carcinoma sample (signet ring cell carcinoma), and gi breast cancer sample. The panels represent: hematoxylin and eosin (H&E) staining (a, d, g), Low-vacuum scanning electron microscopy (Lv-SEM) image of a sample stained using 1% gold (III) chloride, taken in BSE mode (b, e, h), and mixed Lv-SEM image of a sample stained with 1% gold (III) chloride (c, f, i). The scale bars represent 50 μm
Fig. 5
Fig. 5
Identifying 3,3′-diaminobenzidine (DAB)-stained regions using the NanoSuit method. ag Colon tissue immunostained using an antibody against smooth muscle actin with color development via DAB staining (brown). b Staining of the section shown in a with 1% gold (III) chloride. The DAB-staining intensity of the low-vacuum scanning electron microscopy (Lv-SEM) image was selectively enhanced as white color, taken in backscattered electron (BSE) mode. c Image of a control section without gold (III) chloride treatment. d DAB staining of the muscularis propria of a colon tissue section. e Lv-SEM image, taken in BSE mode. f DAB-stained section of a magnified area of the muscularis propria and blood vessels. g Three-dimensional (3D) structure of the correlative region shown in f. Lv-SEM image, taken in mixed BSE and SE mode. h DAB-stained dendritic cells (DCs) of the human epidermis. i Field emission-scanning electron microscopy (FE-SEM) image of DAB-stained DCs after treatment with 1% gold chloride, taken in yttrium–aluminum–garnet BSE mode. j 3D structure of DAB-stained DCs in an FE-SEM image, taken in secondary electron mode. The scale bars represent 2 mm (ac), 500 (d, e), 50 (f, g), and 10 μm (hj)
Fig. 6
Fig. 6
Direct observation of gold particles in immunostained sections using the NanoSuit method. ac Staining of a breast cancer section with a human epidermal growth factor receptor 2 (HER2) score of 3+. a HER2 expression detected by 3,3′-diaminobenzidine (DAB) staining (brown). HER2 expression observed by detection of 40-nm gold particle signals as multiple white dots in a low-vacuum scanning electron microscopy (Lv-SEM) image taken in backscattered electron (BSE) mode (b), or in an FE-SEM taken in secondary electron mode (c). Staining of a breast cancer section with a HER2 score of 0. No HER2 expression was detected by DAB staining (brown) (d), in an Lv-SEM image taken in BSE mode (e), or in an FE-SEM image taken in secondary electron mode (f). g, h Detection of human cytomegalovirus (CMV) with an anti-gB antibody conjugated with 40-nm gold particles. The white square in g was magnified and multiple 40-nm gold particles on the surface of human CMV particles are shown in h. i F-actin detected with 40-nm gold particles on TNT-like structures. The scale bars represent 200 (a, d), 20 (b, e), 2 (c, f, g, i), and 1 μm (h)
Fig. 7
Fig. 7
Energy-dispersive X-ray (EDX) analysis of paraffin sections. ad Paraffin sections from patients with siderosis. a In hematoxylin and eosin (H&E) sections, putative iron-deposition areas (brown) were identified by light microscopy. b A clear backscattered electron (BSE) image (15 kV) was obtained without electric charge. Iron deposition (green, c) and phosphorous deposition (red, d) were observed by scanning electron microscopy (SEM)/EDX analysis. White arrows show the representative element deposition. ek Anthracosis of the lung. With multiple foreign depositions (brown) observed in H&E-stained tissue (e). Many of depositions had a strong BSE signal (f). Aluminum (green, g), silicon (red, h), magnesium (yellow, i), oxygen (green, j), and carbon (purple, k) were analyzed by SEM/EDX. The scale bars represent 100 μm

Similar articles

Cited by

References

    1. Inaga S, Kato M, Hirashima S, Munemura C, Okada S, Kameie T, et al. Rapid three-dimensional analysis of renal biopsy sections by low vacuum scanning electron microscopy. Arch Histol Cytol. 2010;73:113–25. doi: 10.1679/aohc.73.113. - DOI - PubMed
    1. Inaga S, Hirashima S, Tanaka K, Katsumoto T, Kameie T, Nakane H, et al. Low vacuum scanning electron microscopy for paraffin sections utilizing the differential stainability of cells and tissues with platinum blue. Arch Histol Cytol. 2009;72:101–6. doi: 10.1679/aohc.72.101. - DOI - PubMed
    1. Sawaguchi A, Kamimura T, Yamashita A, Takahashi N, Ichikawa K, Aoyama F, et al. Informative three-dimensional survey of cell/tissue architectures in thick paraffin sections by simple low-vacuum scanning electron microscopy. Sci Rep. 2018;8:7479. doi: 10.1038/s41598-018-25840-8. - DOI - PMC - PubMed
    1. Siklos L, Rozsa M, Zombori J. A simple method for correlative light, scanning electron microscopic and X-ray microanalytical examination of the same section. J Microsc. 1986;142:107–10. doi: 10.1111/j.1365-2818.1986.tb02743.x. - DOI - PubMed
    1. Ledford JH, Richardson PE. Light and scanning electron microscopy of greenbug aphid damage in wheat using the same section. Biotech Histochem. 1994;69:342–47. doi: 10.3109/10520299409106315. - DOI - PubMed

Publication types