. 2019 Jul 28:2019:5451038.
doi: 10.1155/2019/5451038. eCollection 2019.

The Lysine Demethylase KDM5B Regulates Islet Function and Glucose Homeostasis

Affiliations

The Lysine Demethylase KDM5B Regulates Islet Function and Glucose Homeostasis

Marie Balslev Backe et al. J Diabetes Res. .

Abstract

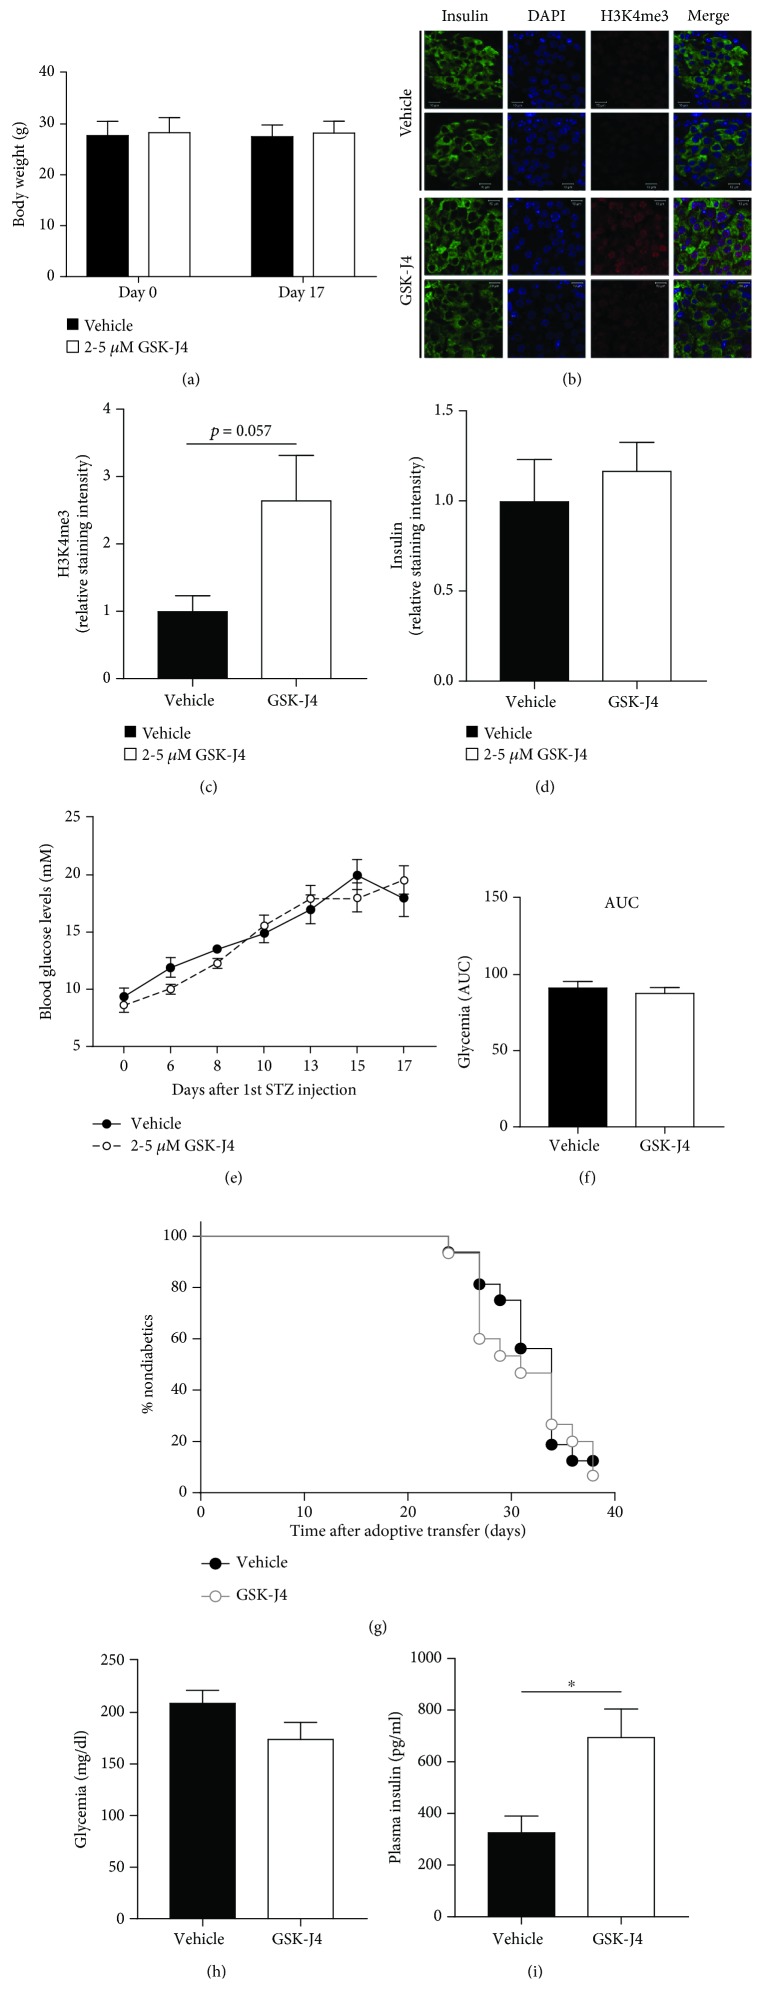
Aims: Posttranslational modifications of histones and transcription factors regulate gene expression and are implicated in beta-cell failure and diabetes. We have recently shown that preserving H3K27 and H3K4 methylation using the lysine demethylase inhibitor GSK-J4 reduces cytokine-induced destruction of beta-cells and improves beta-cell function. Here, we investigate the therapeutic potential of GSK-J4 to prevent diabetes development and examine the importance of H3K4 methylation for islet function.

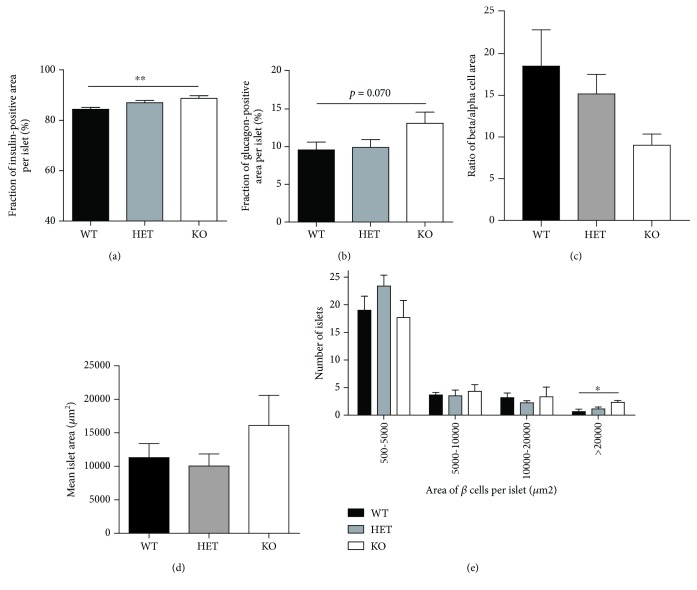
Materials and methods: We used two mouse models of diabetes to investigate the therapeutic potential of GSK-J4. To clarify the importance of H3K4 methylation, we characterized a mouse strain with knockout (KO) of the H3K4 demethylase KDM5B.

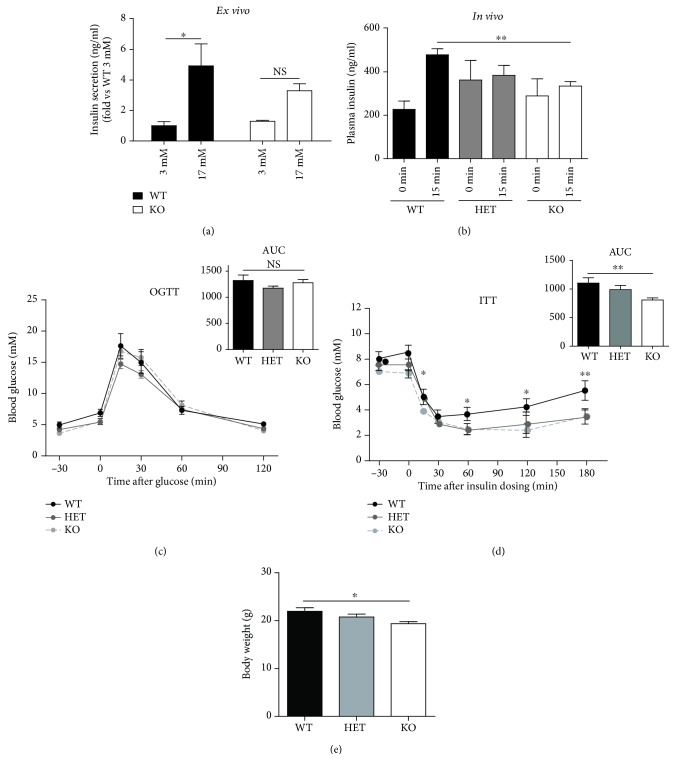
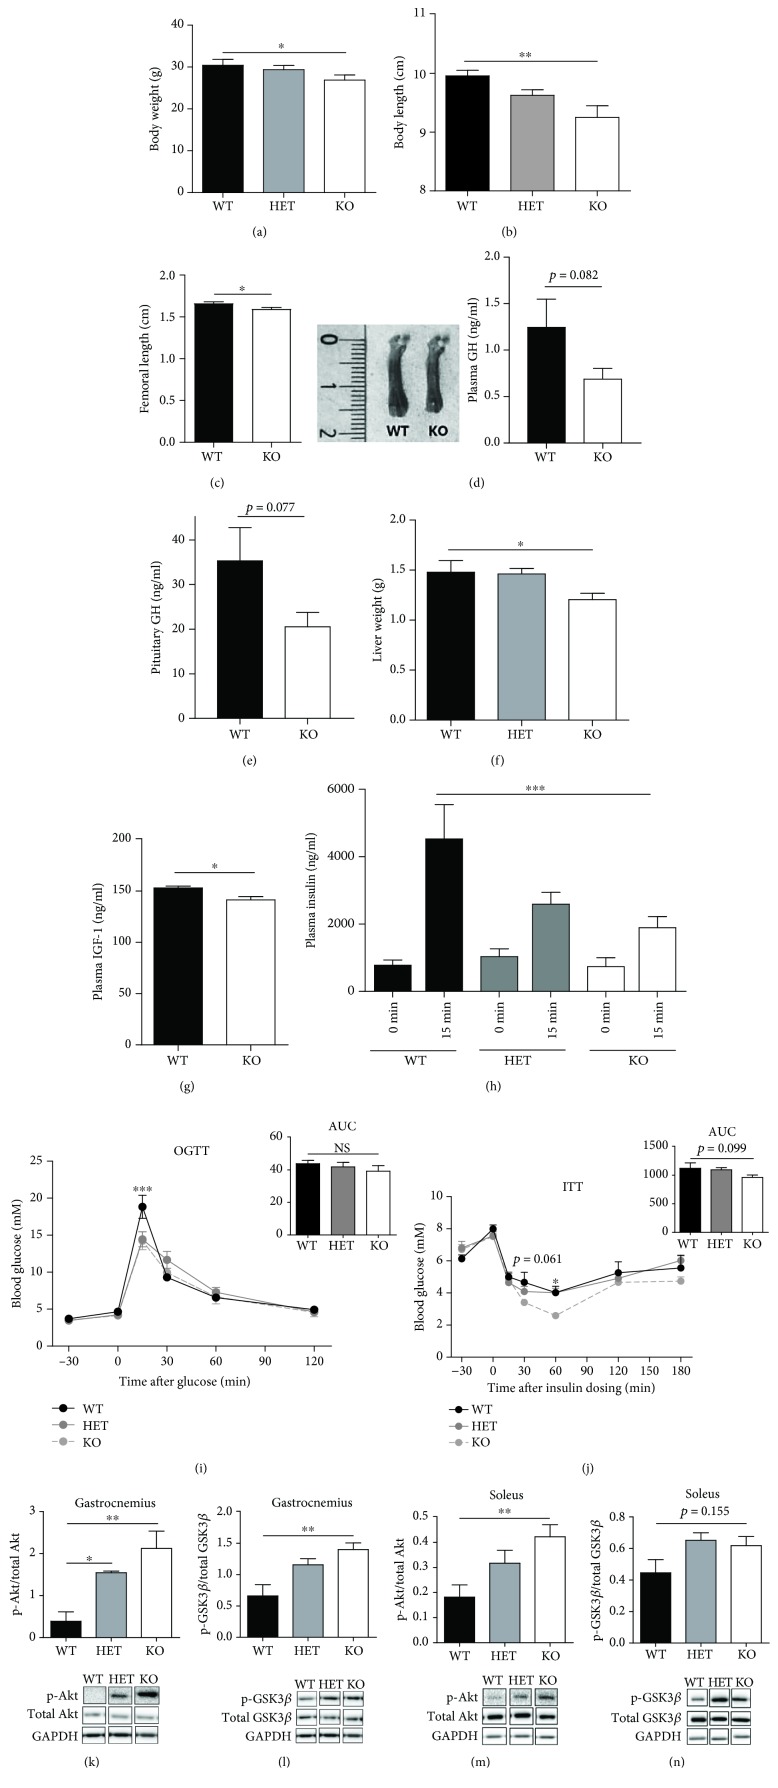
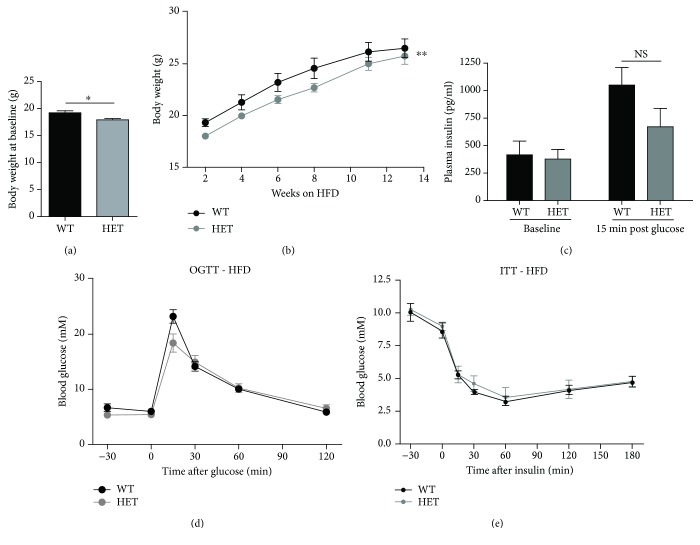
Results: GSK-J4 administration failed to prevent the development of experimental diabetes induced by multiple low-dose streptozotocin or adoptive transfer of splenocytes from acutely diabetic NOD to NODscid mice. KDM5B-KO mice were growth retarded with altered body composition, had low IGF-1 levels, and exhibited reduced insulin secretion. Interestingly, despite secreting less insulin, KDM5B-KO mice were able to maintain normoglycemia following oral glucose tolerance test, likely via improved insulin sensitivity, as suggested by insulin tolerance testing and phosphorylation of proteins belonging to the insulin signaling pathway. When challenged with high-fat diet, KDM5B-deficient mice displayed similar weight gain and insulin sensitivity as wild-type mice.

Conclusion: Our results show a novel role of KDM5B in metabolism, as KDM5B-KO mice display growth retardation and improved insulin sensitivity.


Conflict of interest statement

We declare no conflict of interest that could be perceived as prejudicing the impartiality of the research reported.

Figures

Figure 1
Figure 1
In vivo administration of GSK-J4. (a-f) Multiple low doses of streptozotocin (STZ) were employed to induce autoimmune diabetes in C57BL/6 mice (vehicle n = 11, GSK-J4 n = 15). (a) Body weight (g). (b) Representative images of pancreatic sections stained for insulin, DAPI, and H3K4me3 (n = 3‐4). Images are from two different mice. (c) Quantification of the H3K4me3 signal. (d) Quantification of the insulin signal. (e) Glycemic levels from day 0 to day 17. (f) AUC of glycemic levels. (g) Diabetes incidence as determined by hyperglycemia following adoptive transfer of diabetogenic splenocytes from overtly diabetic NOD mice into NODscid mice (vehicle n = 16, GSK-J4 n = 15). (h, i) Glycemia and insulin levels measured in C57BL/6 mice 3 days after 1st GSK-J4 (n = 6) or vehicle (n = 4) injection. Results are shown as means + SEMs. Statistical significance was determined using two-way ANOVA or unpaired t-test. p < 0.05.
Figure 2
Figure 2
(a-d) The relative fraction of insulin- or glucagon-positive cells, ratio of β/α cells, and area of immunoreactive cells were measured in six randomly selected islets per section. (e) Quantification of area of all islets in each section using the software Zen Black. Results are shown as means + SEMs. Statistical significance was determined using one-way ANOVA. ∗∗ p < 0.01, p < 0.05.
Figure 3
Figure 3
Phenotypic characterization of young KDM5B-KO mice. (a) Glucose-stimulated insulin secretion was measured ex vivo in isolated islets from WT and KO mice (n = 3‐4). (b, c) OGTT. Female mice (n = 5‐7) aged approximately 9 weeks were fasted overnight (16-18 hours) with access to water ad libitum. Blood samples were taken from a tail puncture at the indicated time points for measurement of glucose. (b) For measurement of insulin, a blood sample was taken from orbital sinus at time points -30 and 15 min for each genotype during OGTT. (c) Glucose excursion curves are shown for each genotype. AUC is shown for comparison of differences in glucose excursions. (d) ITT. Female mice (n = 3‐4) aged approximately 9 weeks were fasted 2 hours prior to ITT with access to water ad libitum. Insulin was injected i.p. at dosage 0.75 U/kg body weight. (e) Body weight (g) (n = 5‐8). Results are shown as means + SEMs. Statistical significance was determined by two-way ANOVA with Tukey's multiple comparisons test. ∗∗ p < 0.01, p < 0.05.
Figure 4
Figure 4
Phenotypic characterization of KDM5B-KO mice aged 30-35 weeks. (a) Body weight (g) (n = 5‐8). (b) Body length was measured between nose tip and tail root in anesthetized female mice (n = 2‐4) of 30-35 weeks of age. (c) Femoral length (cm) (n = 5) and representative image from a WT and a KO. (d) Plasma GH levels (n = 4‐6). (e) Pituitary GH levels (n = 3‐5). (f, g) Liver weight (n = 5‐8) and plasma IGF-1 levels (n = 4‐6) were measured in female mice of age 37-42 weeks. (h, i) OGTT. Female mice (n = 5‐8) aged 30-35 weeks were fasted overnight (16-18 hours) with access to water ad libitum. Blood samples were taken from a tail puncture at the indicated time points for measurement of glucose. (h) For measurement of insulin, a blood sample was taken from orbital sinus at time points -30 and 15 min for each genotype during OGTT. (i) Glucose excursion curves are shown for each genotype. AUC is shown for comparison of differences in glucose excursions. (j) ITT. Female mice (n = 5‐8) aged 30-35 weeks were fasted 2 hours prior to ITT with access to water ad libitum. Insulin was injected i.p. at dosage 0.75 U/kg body weight. (k-n) Protein expression levels of Akt and GSK-3β as determined by quantification of western blots on muscle samples from female mice (n = 4‐5) of age 37-42 weeks. Results are shown as means + SEMs. Statistical significance was determined by two-way ANOVA with Tukey's multiple comparison test. Results are shown as means + SEMs. Statistical significance was determined by unpaired t-test, one-way or two-way ANOVA. p < 0.05, ∗∗ p > 0.01, and ∗∗∗ p < 0.001.
Figure 5
Figure 5
HFD cohort–phenotypic characterization. Wild-type (n = 9) and haploinsufficient mice (n = 7) were fed HFD (consisting of 60% fat compared to 11% in normal chow) for 13 weeks from age of 2-5 weeks. (a) Body weight at day 0 of HFD diet. (b) Body weight during 13 weeks of HFD. (c, d) OGTT. Following 13 weeks of HFD, mice were fasted overnight (16-18 hours) with access to water ad libitum. Blood samples were taken from a tail puncture at the indicated time points for measurement of glucose. (c) For measurement of insulin, a blood sample was taken from orbital sinus at time points -30 and 15 min for each genotype during OGTT. (d) Glucose excursion curves are shown for each genotype. AUC is shown for comparison of differences in glucose excursions. (e) ITT. Mice were fasted 2 hours prior to ITT with access to water ad libitum. Insulin (0.75 U/kg body weight) was injected i.p. Results are shown as means + SEMs. Statistical significance was determined using one- or two-way ANOVA. p < 0.05.

References

    1. Defronzo R. A. Pathogenesis of type 2 diabetes mellitus. The Medical Clinics of North America. 2004;88(4):787–835. doi: 10.1016/j.mcna.2004.04.013. - DOI - PubMed
    1. Cnop M., Welsh N., Jonas J. C., Jorns A., Lenzen S., Eizirik D. L. Mechanisms of pancreatic β-cell death in type 1 and type 2 diabetes: many differences, few similarities. Diabetes. 2005;54(Supplement 2):S97–107. doi: 10.2337/diabetes.54.suppl_2.S97. - DOI - PubMed
    1. Prentki M., Nolan C. J. Islet β cell failure in type 2 diabetes. The Journal of Clinical Investigation. 2006;116(7):1802–1812. doi: 10.1172/JCI29103. - DOI - PMC - PubMed
    1. Willcox A., Richardson S. J., Bone A. J., Foulis A. K., Morgan N. G. Analysis of islet inflammation in human type 1 diabetes. Clinical and Experimental Immunology. 2009;155(2):173–181. doi: 10.1111/j.1365-2249.2008.03860.x. - DOI - PMC - PubMed
    1. Kouzarides T. Chromatin modifications and their function. Cell. 2007;128(4):693–705. doi: 10.1016/j.cell.2007.02.005. - DOI - PubMed

MeSH terms

LinkOut - more resources