. 2020 Jan;594(2):209-226.
doi: 10.1002/1873-3468.13589. Epub 2019 Sep 17.

Notch signalling is a potential resistance mechanism of progenitor cells within patient-derived prostate cultures following ROS-inducing treatments

Affiliations

Notch signalling is a potential resistance mechanism of progenitor cells within patient-derived prostate cultures following ROS-inducing treatments

John R Packer et al. FEBS Lett. 2020 Jan.

Abstract

Low Temperature Plasma (LTP) generates reactive oxygen and nitrogen species, causing cell death, similarly to radiation. Radiation resistance results in tumour recurrence, however mechanisms of LTP resistance are unknown. LTP was applied to patient-derived prostate epithelial cells and gene expression assessed. A typical global oxidative response (AP-1 and Nrf2 signalling) was induced, whereas Notch signalling was activated exclusively in progenitor cells. Notch inhibition induced expression of prostatic acid phosphatase (PAP), a marker of prostate epithelial cell differentiation, whilst reducing colony forming ability and preventing tumour formation. Therefore, if LTP is to be progressed as a novel treatment for prostate cancer, combination treatments should be considered in the context of cellular heterogeneity and existence of cell type-specific resistance mechanisms.

Keywords: Low temperature plasma; Notch signalling; Therapy resistance; progenitor cells; prostate cancer; reactive oxygen species.


Figures

Figure 1
Figure 1
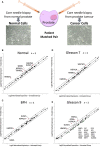
LTP activates oxidative stress responsive gene expression in primary prostate epithelial cell cultures. (A) Retrieval of targeted needle biopsies from prostate tumour and from adjacent non‐cancerous (normal) tissue. Average gene expression of 12 patient cultures of confirmed tissue pathology; (B) Normal (n = 3), (C) BPH (n = 3), (D) Gleason 7 (n = 3), (E) Gleason 9 (n = 3) at 2 h post 3 min LTP treatment. Each gene is represented by a single dot; black – unchanged, red – upregulated ≥ 2‐fold and green – downregulated ≥ 2‐fold. The solid black diagonal line represents no change between untreated to treated expression, the flanking dashed lines – a ≥ 2‐fold expression change.
Figure 2
Figure 2
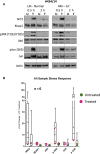
LTP causes accumulation of Nrf2 and activation of AP‐1. (A) Western blot analysis of stress activated transcription factors in untreated (U) and treated (T) cells, 0.5 and 2 h after treatment. Three matched pairs were tested with one example represented here and two further examples in Fig. S5. (B) Boxplot densitometry analysis of the protein data. All six patient samples (normal n = 3, cancer n = 3) are plotted as single points and mean fold change represented by (−). The red dotted line represents a 2‐fold change.
Figure 3
Figure 3
Whole transcriptome analysis reveals activation of multiple signalling pathways by LTP. Microarray analysis of gene expression 2 h after 3 min LTP dose in primary prostate cultures. Patient samples were grown in culture from normal prostate (two samples), Gleason 7 (two samples) and Gleason 9 cancer (two samples). Gene expression was assessed 2 h after 3‐min LTP dose. (A) Volcano plot of significantly changed gene expression (P =≤ 0.05, fold change cut‐off is ≥ 2‐fold) in Treated versus Untreated samples. 645 transcripts were altered by LTP – 544 upregulated, 101 – downregulated. (B) Heat map of genes of interest across the six samples tested. (C) Expression plot showing genes that passed LIMMA.
Figure 4
Figure 4
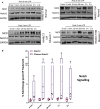
LTP activates Notch signalling in primary prostate epithelial cell cultures. (A) Western blot time‐course of protein alterations in Notch signalling pathways following 3 min plasma treatment in two matched pairs of normal and cancer biopsies (one shown here and one in Fig. S7). (B) Densitometry analysis of Notch1 activation by LTP in all four samples.
Figure 5
Figure 5
Protein and RNA expression of Notch in primary prostate epithelial cell cultures. (A) and (B) – Expression of Notch receptors and target genes in primary prostate epithelial SC and CB cells. Silenced gene PDYN and Active gene RPLP0 are provided as negative and positive expression controls respectively. (Data obtained from Birnie et al. 16), (Significance; *P ≤ 0.05, **P ≤ 0.01, ***P ≤ 0.001, ****P ≤ 0.0001). (C) Expression of Notch receptors and target proteins in primary prostate epithelial cells (one patient culture shown).
Figure 6
Figure 6
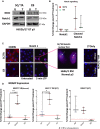
Notch signalling is more active in the SC/TA population, than in CB cells, after LTP treatment. (A), (B) Western blot and densitometry analysis of Notch1 activation in prostate epithelial sub‐populations 30 min after 3 min LTP dose (one sample shown, two more samples shown in Fig. S8). (C) Immunofluorescence images of Notch1 in prostate epithelial sub‐population cells 30 min after 3 min LTP dose. Validation of cellular fractionation is shown by the CD49b staining of SC/TA. Nuclear foci in SC/TA population highlighted in expanded box (white arrows). (D) Gene expression boxplots of sub‐population NRARP expression 2 h after 3 min LTP dose. Each biological repeat (n = 3) is plotted as a point and the mean expression value is represented as a (−). The red line shows a 2‐fold change in expression. Unpaired t‐tests (one‐tailed) were performed between each subpopulation. White scale bars = 25 μm. (*P < 0.05, **P < 0.01).
Figure 7
Figure 7
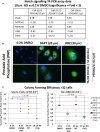
Exposure of primary prostate epithelial cells to a gamma‐secretase inhibitor results in Notch inhibition, cell differentiation and a reduced colony forming ability (A) Primary prostate epithelial cell cultures were treated with 10 μm RO and the gene expression assessed using Qiagen Notch Signalling PCR Array. Shown are the fold changes of a selection of Notch1 signalling genes. (B) Inhibition of Notch using two different gamma‐secretase inhibitors (DAPT, DBZ) results in increased prostatic acid phosphase (PAP) protein expression. (C) Colony forming efficiency of CD133+ and CD133 prostate epithelial cell fractions treated with gamma secretase inhibitors alone or with radiation (2 Gy) (n = 5). White scale bars = 25 μm.
Figure 8
Figure 8
Use of gamma‐secretase inhibitor to treat patient‐derived xenograft cells results in reduced or (A) Tumour growth in vivo of cells derived from patient‐derived xenografts after ex vivo treatment (24 h) with and without gamma‐secretase treatment. (B) PAP immunofluorescence in human cells extracted from patient‐derived xenograft tumours, with and without gamma‐secretase inhibitor treatment. White scale bars = 25 μm.
Figure 9
Figure 9
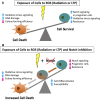
Proposed model for mechanism of action of Notch Inhibitors in Combination with ROS‐inducing Treatments. There is a heterogeneous cell response to ROS‐inducing treatments (Radiation or LTP). (A) Some cells will succumb to increased ROS, DNA damage and cell death. Other cells, typically early progenitor cells have Notch signaling as a resistance mechanism resulting in maintenance of SC phenotype, resistance to treatment and cell survival. (B) Our results propose that a combination of Notch inhibition with ROS‐inducing treatment results in reduced Notch signaling and progenitor cell differentiation thus leading to increased susceptibility, reduced resistance and increased cell death.

References

    1. Hirst AM, Simms MS, Mann VM, Maitland NJ, O'Connell D and Frame FM (2015) Low‐temperature plasma treatment induces DNA damage leading to necrotic cell death in primary prostate epithelial cells. Br J Cancer 112, 1536–1545. - PMC - PubMed
    1. Kang SU, Cho JH, Chang JW, Shin YS, Kim KI, Park JK, Yang SS, Lee JS, Moon E, Lee K et al (2014) Nonthermal plasma induces head and neck cancer cell death: the potential involvement of mitogen‐activated protein kinase‐dependent mitochondrial reactive oxygen species. Cell Death Dis 5, e1056. - PMC - PubMed
    1. Ma Y, Ha CS, Hwang SW, Lee HJ, Kim GC, Lee KW and Song K (2014) Non‐thermal atmospheric pressure plasma preferentially induces apoptosis in p53‐mutated cancer cells by activating ROS stress‐response pathways. PLoS One 9, e91947. - PMC - PubMed
    1. Kalghatgi S, Kelly CM, Cerchar E, Torabi B, Alekseev O, Fridman A, Friedman G and Azizkhan‐Clifford J (2011) Effects of non‐thermal plasma on mammalian cells. PLoS One 6, e16270. - PMC - PubMed
    1. Klaunig JE, Kamendulis LM and Hocevar BA (2010) Oxidative stress and oxidative damage in carcinogenesis. Toxicol Pathol 38, 96–109. - PubMed

Publication types

MeSH terms