. 2019 Sep;6(9):1858-1871.
doi: 10.1002/acn3.50886. Epub 2019 Aug 30.

Early prediction of phenotypic severity in Citrullinemia Type 1

Collaborators, Affiliations

Early prediction of phenotypic severity in Citrullinemia Type 1

Matthias Zielonka et al. Ann Clin Transl Neurol. 2019 Sep.

Abstract

Objective: Citrullinemia type 1 (CTLN1) is an inherited metabolic disease affecting the brain which is detectable by newborn screening. The clinical spectrum is highly variable including individuals with lethal hyperammonemic encephalopathy in the newborn period and individuals with a mild-to-moderate or asymptomatic disease course. Since the phenotypic severity has not been predictable early during the disease course so far, we aimed to design a reliable disease prediction model.

Methods: We used a newly established mammalian biallelic expression system to determine residual enzymatic activity of argininosuccinate synthetase 1 (ASS1; OMIM #215700) in 71 individuals with CTLN1, representing 48 ASS1 gene variants and 50 different, mostly compound heterozygous combinations in total. Residual enzymatic ASS1 activity was correlated to standardized biochemical and clinical endpoints available from the UCDC and E-IMD databases.

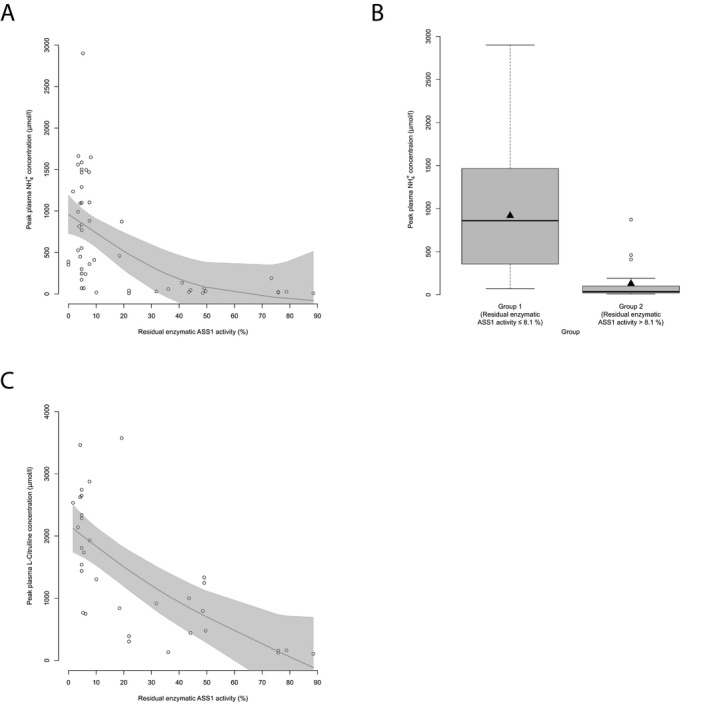
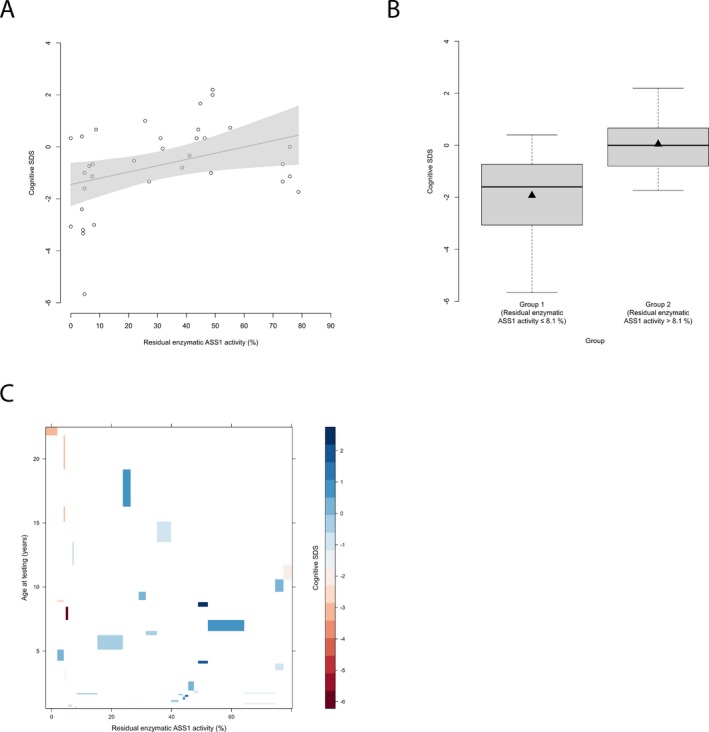
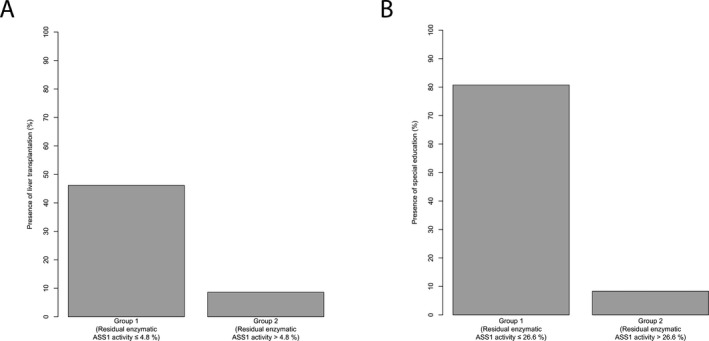
Results: Residual enzymatic ASS1 activity correlates with peak plasma ammonium and L-citrulline concentrations at initial presentation. Individuals with 8% of residual enzymatic ASS1 activity or less had more frequent and more severe hyperammonemic events and lower cognitive function than those above 8%, highlighting that residual enzymatic ASS1 activity allows reliable severity prediction. Noteworthy, empiric clinical practice of affected individuals is in line with the predicted disease severity supporting the notion of a risk stratification-based guidance of therapeutic decision-making based on residual enzymatic ASS1 activity in the future.

Interpretation: Residual enzymatic ASS1 activity reliably predicts the phenotypic severity in CTLN1. We propose a new severity-adjusted classification system for individuals with CTLN1 based on the activity results of the newly established biallelic expression system.


Conflict of interest statement

SK receives funding from Horizon Pharma Ireland Limited for the European Post‐Authorization Registry for Ravicti® (glycerol phenylbutyrate) oral liquid in partnership with the E‐IMD (RRPE) (EU PAS Register no. EUPAS17267; http://www.encepp.eu/). The sponsors have in no way influenced the design, conductance, analysis and report of the present study. All other authors declare that they have no conflict of interest.

Figures

Figure 1
Figure 1
Residual enzymatic ASS1 activity correlates with initial biochemical parameters. (A) NH4 + max (µmol/L) subject to residual enzymatic ASS1 activity (%) as determined in the biallelic expression system. Each point represents a single patient (n = 52). Gray line displays estimated regression curve. GAM‐analysis, P < 0.001, R 2 = 0.29. (B) Boxplot illustrating NH4 + max (µmol/L) with a residual enzymatic ASS1 activity below or equal to 8.1% (n = 32) and above 8.1% (n = 20). Data are shown as median (black thick line) and mean (triangle), length of the box corresponds to interquartile range (IQR), upper and lower whiskers correspond to max. 1.5 × IQR, each point represents an outlier. Recursive partitioning, P < 0.001. (C) Peak plasma L‐citrulline concentration subject to residual enzymatic ASS1 activity (%). Each point represents a single patient (n = 33). Gray line displays estimated regression curve. GAM‐analysis, P < 0.001, R 2 = 0.46. ASS1, argininosuccinate synthetase 1.
Figure 2
Figure 2
Residual enzymatic ASS1 activity predicts number and severity of HAEs. (A) Number of HAEs (NH4 + max ≥ 100 µmol/L) per year subject to residual enzymatic ASS1 activity (%). Each point represents a single patient (n = 43). Gray line displays estimated regression curve. GAM‐analysis, P = 0.002, R 2 = 0.26. (B) Boxplot illustrating number of HAEs (NH4 + max ≥ 100 µmol/L) per year with a residual enzymatic ASS1 activity below or equal to 8.1% (n = 17) or above 8.1% (n = 26). Data are shown as median (black thick line) and mean (triangle), length of the box corresponds to IQR, upper and lower whiskers correspond to max. 1.5 × IQR, each point represents an outlier. Recursive partitioning, P = 0.003. (C) NH4 + max during most severe HAE subject to residual enzymatic ASS1 activity (%). Each point represents a single patient (n = 26). Gray line displays estimated regression curve. GAM‐analysis, P = 0.007, R 2 = 0.23. (D) Boxplot illustrating NH4 + max during most severe HAE with a residual enzymatic ASS1 activity below or equal to 8.1% (n = 17) or above 8.1% (n = 9). Data are shown as median (black thick line) and mean (triangle), length of the box corresponds to IQR, upper and lower whiskers correspond to max. 1.5 × IQR, each point represents an outlier. Recursive partitioning, P = 0.01. ASS1, argininosuccinate synthetase 1.
Figure 3
Figure 3
Residual enzymatic ASS1 activity correlates with cognitive outcome. (A) Cognitive SDS subject to residual enzymatic ASS1 activity (%). Each point represents a single patient (n = 34). Grey line indicates linear regression curve. Linear regression, P = 0.029, R 2 = 0.14. (B) Boxplot illustrating cognitive SDS with a residual enzymatic ASS1 activity below or equal to 8.1% (n = 13) and above 8.1% (n = 21). Data are shown as median (black thick line) and mean (triangle), length of the box corresponds to IQR, upper and lower whiskers correspond to max. 1.5 × IQR. Recursive partitioning, P = 0.031. (C) Levelplot for cognitive SDS, residual enzymatic ASS1 activity and age at testing (years). Cognitive SDS values are indicated by color coding in grading from blue to red with descending cognitive SDS. ASS1, argininosuccinate synthetase 1.
Figure 4
Figure 4
Residual enzymatic ASS1 activity predicts organ‐specific manifestations. (A) Boxplot illustrating presence of movement disorders (%) for individuals with a residual enzymatic ASS1 activity below or equal to 19.3% (n = 34) and above 19.3% (n = 26). Gray shading corresponds to individuals with movement disorders in each group. Recursive partitioning, P = 0.03. (B) Boxplot displaying presence of hepatocellular injury (%) for individuals with a residual enzymatic ASS1 activity below or equal to 3.9% (n = 7) and above 3.9% (n = 48). Gray shading corresponds to individuals with episode(s) of hepatocellular injury in each group. Recursive partitioning, P = 0.039. ASS1, argininosuccinate synthetase 1.
Figure 5
Figure 5
Decision for liver transplantation and special education reflects risk‐stratification by residual enzymatic ASS1 activity. (A) Boxplot illustrating proportion of individuals (%) with a liver graft for those with a residual enzymatic ASS1 activity below or equal to 4.8% (n = 13) and above 4.8% (n = 58). Grey shading corresponds to individuals with liver graft in each group. Recursive partitioning, P = 0.011. (B) Boxplot displaying proportion of individuals (%) with special education for those with a residual enzymatic ASS1 activity below or equal to 26.6% (n = 26) and above 26.6% (n = 12). Gray shading corresponds to individuals with special education in each group. Recursive partitioning, P < 0.001. ASS1, argininosuccinate synthetase 1.

References

    1. Summar ML, Koelker S, Freedenberg D, et al. The incidence of urea cycle disorders. Mol Genet Metab 2013;110:179–180. - PMC - PubMed
    1. Posset R, Garbade SF, Boy N, et al. Transatlantic combined and comparative data analysis of 1095 patients with urea cycle disorders‐a successful strategy for clinical research of rare diseases. J Inherit Metab Dis 2019;42:93–106. - PMC - PubMed
    1. Kolker S, Garcia‐Cazorla A, Valayannopoulos V, et al. The phenotypic spectrum of organic acidurias and urea cycle disorders. Part 1: the initial presentation. J Inherit Metab Dis 2015;38:1041–1057. - PubMed
    1. Kolker S, Valayannopoulos V, Burlina AB, et al. The phenotypic spectrum of organic acidurias and urea cycle disorders. Part 2: the evolving clinical phenotype. J Inherit Metab Dis 2015;38:1059–1074. - PubMed
    1. Burgard P, Kolker S, Haege G, et al. Neonatal mortality and outcome at the end of the first year of life in early onset urea cycle disorders–review and meta‐analysis of observational studies published over more than 35 years. J Inherit Metab Dis 2016;39:219–229. - PubMed

Publication types