

Temporal Dynamics of Transdermal Alcohol Concentration Measured via New-Generation Wrist-Worn Biosensor
- PMID: 31469451
- PMCID: PMC6779481
- DOI: 10.1111/acer.14172
Temporal Dynamics of Transdermal Alcohol Concentration Measured via New-Generation Wrist-Worn Biosensor
Abstract
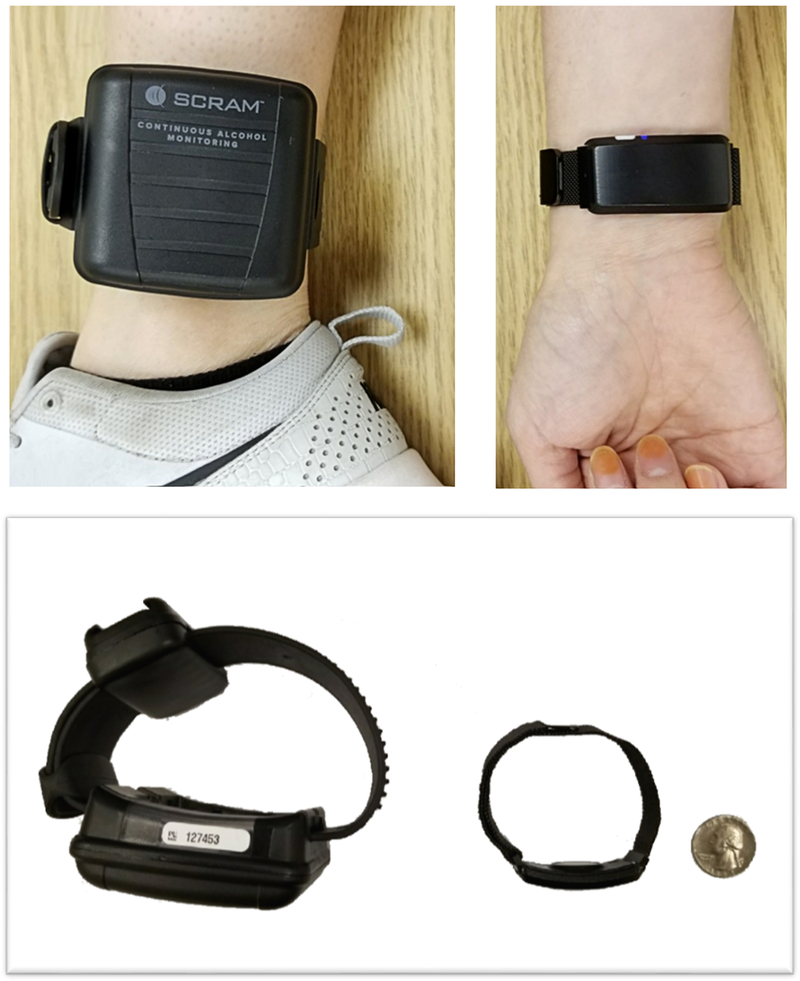
Background: The development of a transdermal alcohol biosensor could represent a tremendous advance toward curbing problematic drinking. But several factors limit the usefulness of extant transdermal technology, including relatively lengthy delays between blood alcohol concentration (BAC) and transdermal alcohol concentration (TAC), as well as the large/bulky designs of currently available transdermal sensors (e.g., ankle monitors). The current research examined the lag time between BAC and TAC using a prototype of BACtrack Skyn-a new-generation wrist-worn transdermal sensor featuring a compact design and smartphone integration.
Methods: Participants (N = 30) received either a dose of alcohol (target BAC 0.08%) or a nonalcoholic beverage in the laboratory while wearing both the AMS SCRAM ankle monitor and a Skyn prototype. Participants were monitored in the laboratory until breath alcohol concentration (BrAC) dropped below 0.025%.
Results: Device failure rates for Skyn prototypes were relatively high (18 to 38%) compared with nonprototype SCRAM devices (2%). Among participants with usable data, both Skyn- and SCRAM-measured TAC showed strong correlations with BrAC, and both Skyn and SCRAM devices detected alcohol within 30 minutes of first alcohol administration. Skyn-measured TAC peaked over 1 hour earlier than SCRAM-measured TAC (54 versus 120 minutes after peak BrAC, respectively), and time-series models suggested that, on average across all measured portions of the BrAC curve, Skyn TAC lagged behind BrAC by 24 minutes, whereas SCRAM TAC lagged behind BrAC by 69 minutes-all differences statistically significant at p < 0.001.
Conclusions: Results provide preliminary evidence for the validity of a new-generation wrist-worn transdermal sensor under controlled laboratory conditions and further suggest favorable properties of this sensor as they pertain to the latency of transdermal alcohol detection. The prototype version of Skyn employed here displayed a higher failure rate compared with SCRAM, and, in future, more reliable and robust Skyn prototypes will be required suitable to field testing across diverse environmental conditions.
Keywords: Alcohol; Biosensor; Blood Alcohol Concentration; Measurement; Transdermal.
© 2019 by the Research Society on Alcoholism.
Figures

References
-
- Anderson JC, & Hlastala MP (2006). The kinetics of transdermal ethanol exchange. Journal of Applied Physiology, 100(2), 649–655. - PubMed
-
- Barnett NP (2015). Alcohol sensors and their potential for improving clinical care. Addiction, 110(1), 1–3. - PubMed
-
- Barnett NP, Wei J, & Czachowski C (2009). Measured alcohol content in college party mixed drinks. Psychology of Addictive Behaviors, 23(1), 152–156. - PubMed
-
- Bendtsen P, Hultberg J, Carlsson M, & Jones AW (1999). Monitoring ethanol exposure in a clinical setting by analysis of blood, breath, saliva, and urine. Alcoholism: Clinical and Experimental Research, 23(9), 1446–1451. - PubMed
Publication types
MeSH terms
Substances
Grants and funding
LinkOut - more resources
Full Text Sources
Other Literature Sources
