. 2019 Aug 30;11(16):6175-6198.
doi: 10.18632/aging.102181. Epub 2019 Aug 30.

Cortical neurons develop a senescence-like phenotype promoted by dysfunctional autophagy

Affiliations

Cortical neurons develop a senescence-like phenotype promoted by dysfunctional autophagy

Daniel Moreno-Blas et al. Aging (Albany NY). .

Abstract

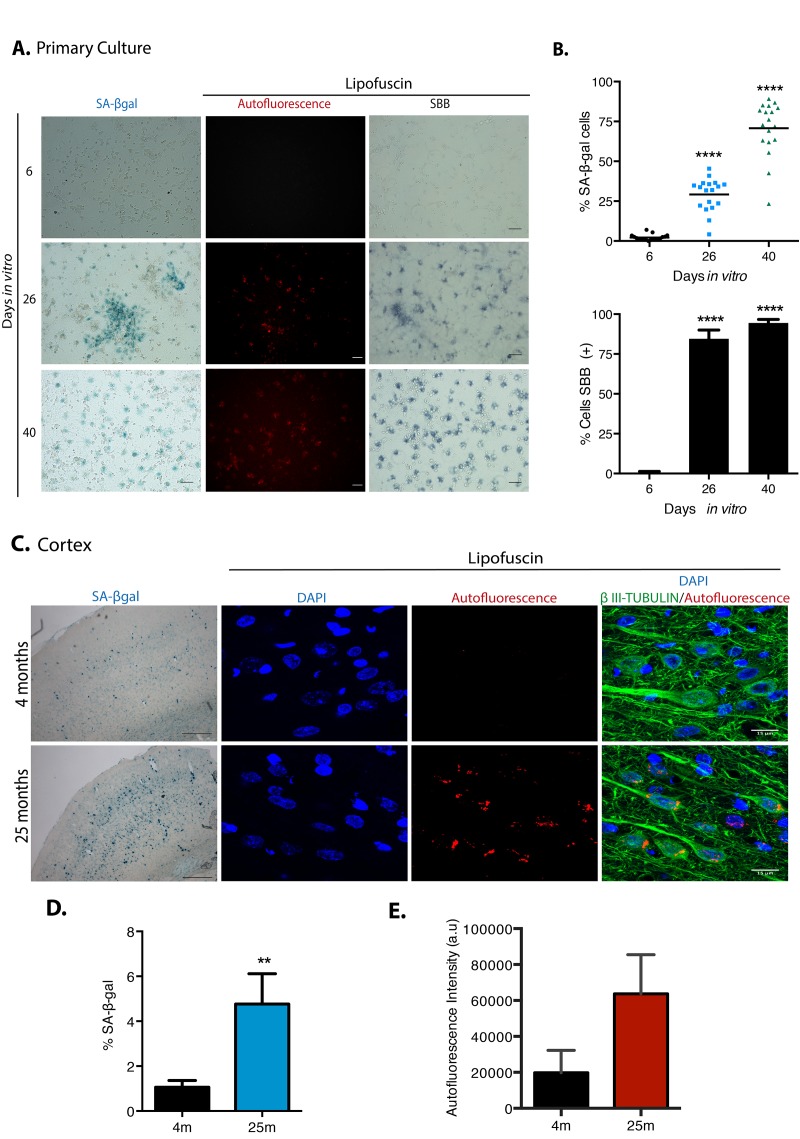
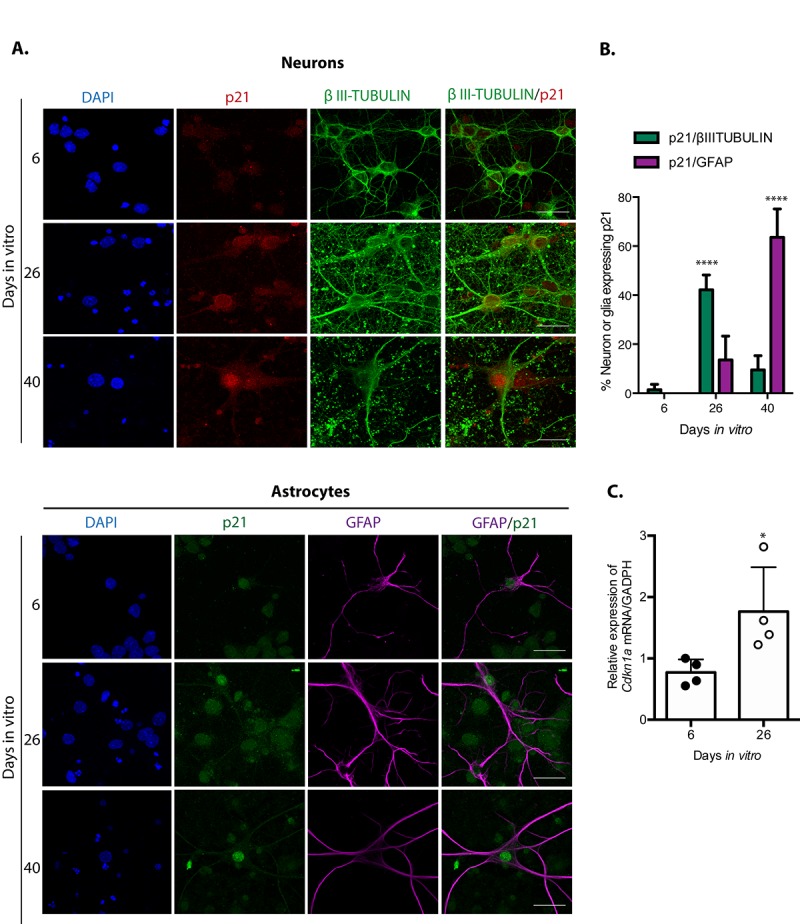
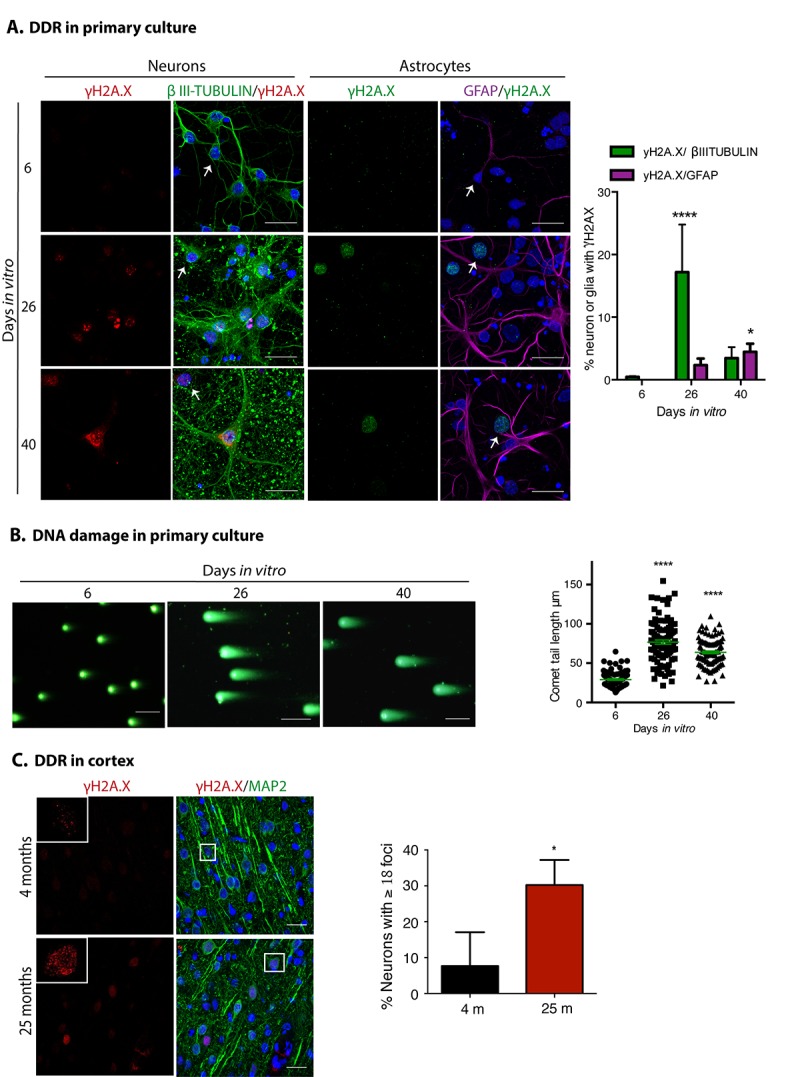
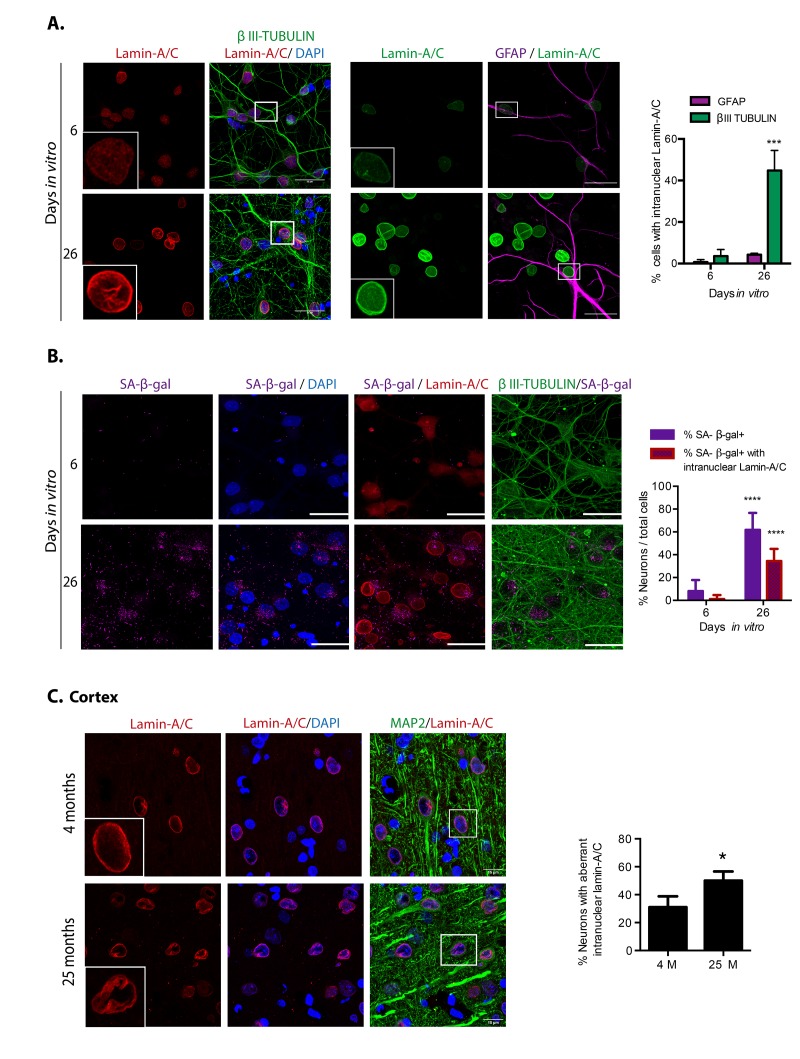
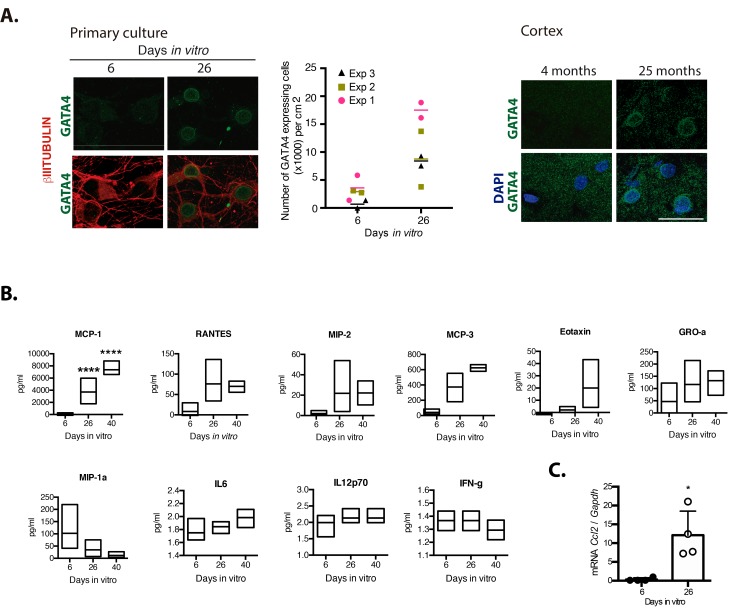
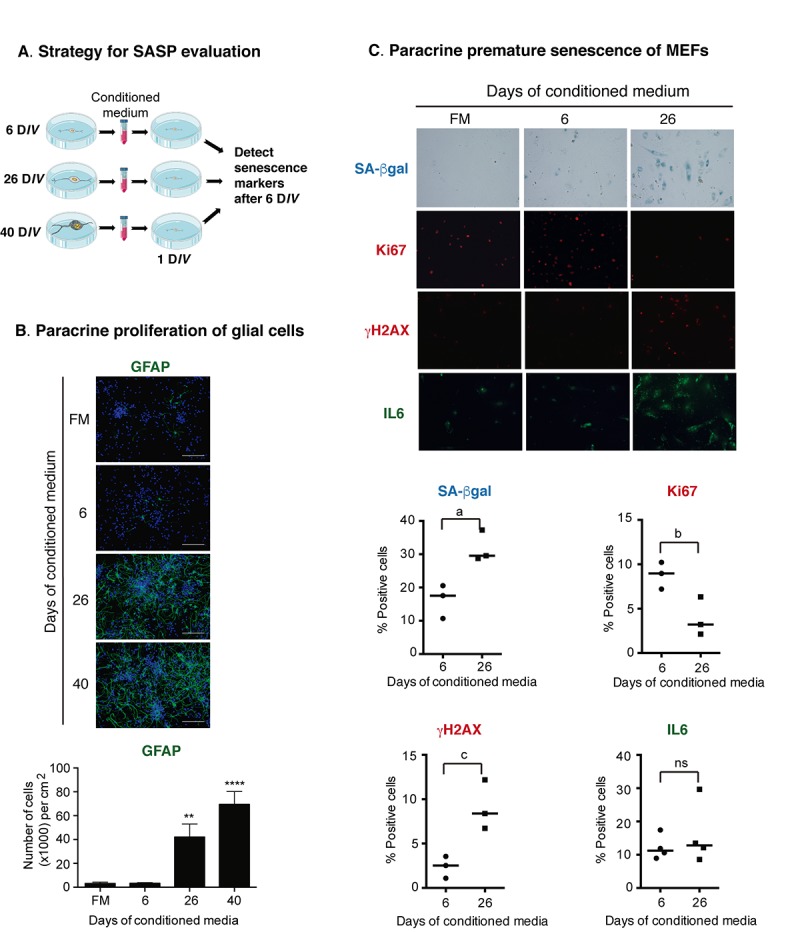
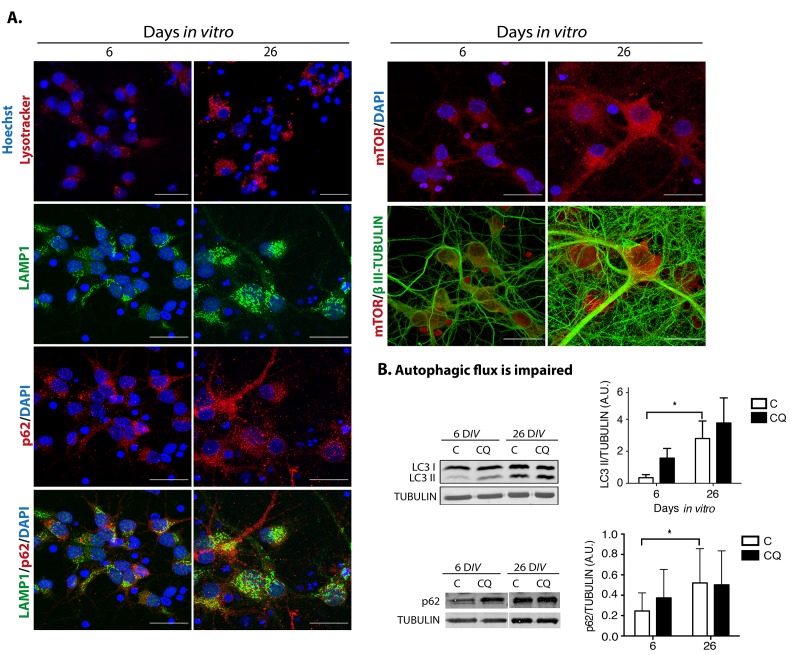
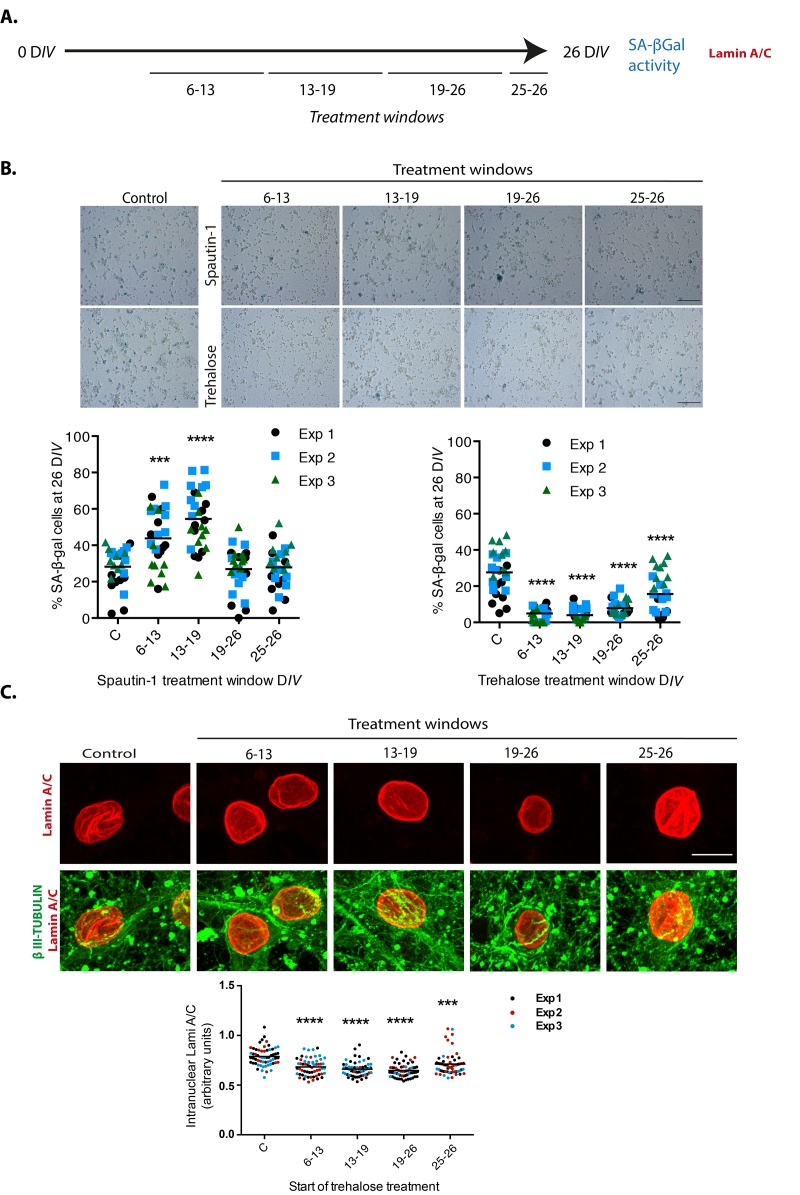
Senescent cells accumulate in various tissues and organs with aging altering surrounding tissue due to an active secretome, and at least in mice their elimination extends healthy lifespan and ameliorates several chronic diseases. Whether all cell types senesce, including post-mitotic cells, has been poorly described mainly because cellular senescence was defined as a permanent cell cycle arrest. Nevertheless, neurons with features of senescence have been described in old rodent and human brains. In this study we characterized an in vitro model useful to study the molecular basis of senescence of primary rat cortical cells that recapitulates senescent features described in brain aging. We found that in long-term cultures, rat primary cortical neurons displayed features of cellular senescence before glial cells did, and developed a functional senescence-associated secretory phenotype able to induce paracrine premature senescence of mouse embryonic fibroblasts but proliferation of rat glial cells. Functional autophagy seems to prevent neuronal senescence, as we observed an autophagic flux reduction in senescent neurons both in vitro and in vivo, and autophagy impairment induced cortical cell senescence while autophagy stimulation inhibited it. Our findings suggest that aging-associated dysfunctional autophagy contributes to senescence transition also in neuronal cells.

Keywords: SASP (senescence-associated secretory phenotype); autophagy; brain; neuron; senescence.


Conflict of interest statement

CONFLICTS OF INTEREST: The authors declare no conflict of interest.

Figures

Figure 1
Figure 1
Cortical cells in long-term culture and in old rat brains had higher SA-β-gal activity and accumulated lipofuscin. (A) SA-β-gal activity or lipofuscin accumulation detected by autofluorescence or by Sudan Black B (SBB) staining were detected in primary rat cortical cells cultured for the indicated DIV. Notice that cortical cells have higher SA-β-gal activity and lipofuscin from 26 DIV. Images are representative of at least three independent experiments. Scales bar represent 100 μm. (B) Percentage of SA-β-gal or SBB positive cells in the cultures incubated at the indicated DIV. Quantification was made using NIS Elements software. The mean of three independent experiments, each done by quintupled replicas, is graphed. Bars in graphs represent SEM. Two-way RM ANOVA analysis, with Dunnett´s multiple comparison test. **** p< 0.0001 in comparison with 6 DIV. (C) Cortical neurons in old brains had higher SA-β-gal activity (scale bars represent 500 μm) and accumulated lipofuscin. Scale bar represents 15 μm. (D) The percentage of SA-β-gal positive area within each brain section is plot. The average of three brains per age is graphed; 15 sections from each brain were quantified. Bars in graphs represent SEM. Unpaired t Test, ** p< 0.01. (E) Quantification of autofluorescence intensity per section (arbitrary units). Bars in graphs represent SD. The average of three brains per age is graphed; 15 sections from each brain were quantified. Even though there was an evident increase in autofluorescence, no statistical significance was obtained.
Figure 2
Figure 2
Neuronal cells in cortical long-term culture showed increased expression of p21CIP1/WAF1. (A) Immunofluorescence to detect p21CIP1/WAF1 (p21) in neurons (expressing βIII-TUBULIN) or astrocytes (expressing GFAP) in primary culture of cortical cells incubated during the indicated DIV. Notice that mostly neurons increased the abundance of p21CIP1/WAF1 at 26 DIV, indicating that neurons acquired senescent features before glial cells. Scale bar represents 25 μm. Arrows indicate examples of cells with healthy nuclei counted (not all the healthy cells are indicated). (B) Percentage of neurons or glial cells expressing p21CIP1/WAF1 over all cells. The mean of three independent experiments, each done by duplicate, is plotted. Bars represent standard deviation. Two-way RM ANOVA analysis, with Tukey´s multiple comparison test. **** p<0.0001. (C) qRT-PCR from total RNA purified from cortical primary cultures during the indicated days. The relative expression of Cdkn1a mRNA was normalized with Gapdh mRNA. Bars represent SD. * p=0.039 by unpaired t test two tailed. n=4.
Figure 3
Figure 3
Neuronal cells in cortical long-term culture and in the cortex from old rat brains had a sustained DNA damage response (DDR). (A) Immunofluorescence to detect γH2AX foci in neurons (expressing βIII-TUBULIN) or astrocytes (expressing GFAP) in primary culture of cortical cells incubated during the indicated DIV. Notice that mostly neurons have γH2AX foci at 26 DIV. Scale bar represents 25 μm. Right, quantification of the percentage of neurons or glial cells with γH2AX foci over all cells. The mean of three independent experiments, each done by duplicate, is plotted. Bars represent SEM. Two-way RM ANOVA analysis, with Dunnett´s multiple comparison test. **** p< 0.0001 26 DIV vs. 6 DIV; * p<0.05 40 DIV vs. 6 DIV. Arrows indicate examples of cells with healthy nuclei counted (not all the healthy cells are indicated). (B) Comet assay to detect double strand breaks in genomic DNA from cells collected at the indicated days. Scale bars represent 100 μm. Right, the length of the tail of the comets, indicative of level of DNA damage, is plotted. 50 nuclei from each treatment, from two independent experiments, were analyzed by RM one-way ANOVA with Dennett’s´ multiple comparison. **** p< 0.0001 between 26 DIV or 40 DIV in comparison with 6 DIV. (C) Immunofluorescence to detect γH2AX foci in cortical neurons (expressing MAP2) in rat brains from the indicated age. Nuclei were stained with DAPI. Scale bars represent 30 μm. Right, percentage of neurons with more than 18 foci per nucleus. More than 100 neurons were counted from 3 different brains of each age. Bars represent standard deviation. Unpaired t Test * p<0.01.
Figure 4
Figure 4
Cortical cells in long-term culture and in old rat brains had nuclear morphology abnormalities. (A) Immunofluorescence to detect Lamin-A/C in neurons (expressing βIII-TUBULIN) or astrocytes (expressing GFAP), in primary culture of cortical cells incubated during the indicated days in vitro. Squares indicate the magnified area shown in insets. Representative images of three independent experiments are shown. Scale bars represent 25 μm. Right, percentage of neurons or astrocytes with aberrant nuclear morphology over total cells. Bars represent SEM; two-way RM ANOVA analysis, *** p< 0.001 in comparison with 6 DIV. (B) Simultaneous detection of SA-β-gal activity (by confocal microscopy) and Lamina-A/C (by immunofluorescence) in neurons (expressing βIII-TUBULIN) in primary culture of cortical cells incubated during the indicated days in vitro. Representative images of three independent experiments are shown. Scale bars represent 25 μm. Right, percentage of neurons with visible SA-β-gal activity, and with both visible SA-β-gal activity and aberrant intranuclear Lamin-A/C over total cells. Five fields from three independent experiments were quantified. Bars represent SEM. Two-way RM ANOVA analysis, followed by Sidak´s multiple comparison test. **** p< 0.0001 in comparison with 6 DIV. C. Immunofluorescence to detect Lamin-A/C in cortical neurons in the internal pyramidal layer 5 from brain slices of the indicated age. Notice that also in vivo, neurons in old brains had nuclear deformations. Squares indicate the magnified area shown in insets. Scale bars represent 30 μm. Right, percentage of neurons in with aberrant nuclear morphology in cortical brain slices of the indicated age, as shown in (C). (n=3). Bars represent SD; unpaired t Test Student * p< 0.01.
Figure 5
Figure 5
Senescent neurons increased the expression of GATA4 and cortical cells secreted MCP-1. (A) Immunofluorescence to detect GATA4 in neurons (expressing βIII-TUBULIN) in primary culture of cortical cells either incubated during the indicated days in vitro or in rat brains of the indicated age. Scale bars represent 25 μm. The number of cells with increased GATA4 abundance from three independent experiments, each performed in duplicate, is graphed. The mean of each experiment is represented by horizontal bars. (B) Quantification by multiplex immunoassay of the indicated cytokines, from conditioned media from cultures of the indicated days from three independent experiments. The maximum and minimum values are graphed. Bars indicate the mean of the three independent experiments. Data were analyzed by two-way ANOVA followed by Tukey´s multiple comparisons test analysis, only MCP-1 was significant. **** p<0.0001 relative to 6 DIV. (C) qRT-PCR from total RNA purified from cortical primary cultures during the indicated days. The relative expression of Ccl2 mRNA was normalized with Gapdh mRNA. Bars represent SD. * p=0.0106 by unpaired t test two tailed. n=4.
Figure 6
Figure 6
Senescent cortical cells develop a functional SASP. (A) Experimental design to evaluate the presence of secreted molecules with SASP activity from senescent cortical cells. Conditioned media was collected from cortical cells that had been incubated from 1-6 (6), 19-26 (26) or 32-40 (40) DIV. Either primary prenatal cortical cells or MEFs were cultured for 24 hr (1 DIV) before adding conditioned media; senescence markers were evaluated 6 days later. (B) Conditioned media from senescent cortical cells induced paracrine proliferation of glial cells in primary culture of prenatal cortical cells. Representative immunofluorescences to detect GFAP in cortical cells are shown. Cells were incubated with conditioned media collected from cortical cells that had been incubated during the indicated DIV. FM stands for fresh medium. Notice that conditioned media from 26 DIV and 40 DIV induced high proliferation of glial cells. Scale bars represent 500 μm. The bottom graph is a quantification of the number of GFAP expressing cells in three independent experiments, each done in duplicate. Data were analyzed by one-way ANOVA, with Dunnett´s multiple comparison test. ** p<0.01; ****p<0.0001 compared to FM. (C) Conditioned media from senescent cortical cells induced paracrine premature senescence in MEFs. MEFs were incubated with conditioned media collected from cortical cells that had been incubated during the indicated DIV. FM stands for fresh medium. Notice that senescent markers were higher in cells incubated with conditioned media from cortical cells cultured for 26 days. The bottom graphs are quantifications of the percentage of cells with blue or fluorescent signals. The signal (either blue or fluorescent) from cells incubated with 6 DIV conditioned media plus one standard deviation was deducted from the signal obtained from the cells treated with 26 DIV conditioned media. Three independent experiments, each performed in duplicate were quantified. Data were analyzed by unpaired T test. a, p=0.0175; b, p=.0.0327; c, p=0.0191.
Figure 7
Figure 7
Autophagosomes accumulate during neuronal senescence. (A) Top row, autophagosomes were stained with CytoID® and nuclei with Hoechst in primary culture of cortical cells incubated during the indicated DIV; scale bars represent 15 μm. Middle rows, immunofluorescence to detect LC3 in neurons (expressing βIII-TUBULIN) of primary cortical cells cultivated during the indicated DIV. Scale bars represent 5 μm. Bottom rows, electron micrographs showing accumulation of autophagosomes in 26 DIV cortical cells, detected by immunogold localization of LC3 (arrow heads). Squares indicate the amplified area below. (B) Immunofluorescence to detect p62/SQSTM1 in cortical cells cultured during the indicated DIV. Nuclei were stained with DAPI. Notice that p62/SQSTM1 in neurons (expressing βIII-TUBULIN) accumulated at 26 DIV. Scale bars represent 5 μm. (C) Immunofluorescence to simultaneously detect LC3 and Lamin-A/C to observe intranuclear folds as a senescence marker, in cortical cells cultured during the indicated DIV. Scale bars represent 25 μm. (D) LC3 and p62/SQSTM1 also accumulate in cortical neurons (expressing βIII-TUBULIN or MAP2) form old rat brains. Scale bars represent 30 μm.
Figure 8
Figure 8
Dysfunctional autophagy contributes to neuronal senescence. (A) There was an accumulation of enlarged lysosomes and undigested p62/SQSTM1 in senescent neurons. Top row, lysosomes were detected with Lysotracker® and nuclei with Hoechst in primary culture of cortical cells incubated during the indicated DIV. Bottom rows, immunofluorescence to detect the indicated proteins in cortical cells cultured during 6 or 26 days. Nuclei were stained with DAPI. Notice that even though lysosomes and p62/SQSTM1 accumulated at 26 DIV, their intracellular distribution did not overlap. mTOR distribution did not change. Scale bars represent 25 μm. (B) The autophagic flux was impaired in senescent neurons. Western blot of total protein extracts from cortical cells cultured at 6 or 26 days, without (C) or with (CQ) 20 μM Chloroquine for 4 hr. Graphs represent the mean of densitometry analysis of four independent experiments. Bars represent SEM. Two-way RM ANOVA followed by Sidak´s multiple comparison test. *p<0.001.
Figure 9
Figure 9
Autophagy modulation alters cortical cells senescence. (A) Experimental design. (B) Early inhibition of autophagy with Spautin1 increased the number of cells with SA-β-gal activity, while early induction of autophagy by adding trehalose reduced them. Spautin1 or trehalose were added during periods of several days, at the indicated time intervals in days of culture (DIV); after 26 DIV all cultures (including control with no treatment) were fixed to quantify the percentage of cells showing high SA-β-gal activity. Scale bars represent 500 μm. The bars in graphs represent the mean of each independent experiment, each done by triplicates. Three fields from each replica were scored (9 fields per experiment), each dot represent the percentage of SA-β-gal positive cells per field. Data were analyzed by two-way RM ANOVA, followed by Dunnett´s multiple comparison test. ***p<0.001 Spautin1 added during 6-13 DIV in comparison with control; **** p< 0.0001 Spautin1 added during 13-19 DIV in comparison with control, and Trehalose treatments in comparison with control. (C) Autophagy induction with trehalose reduced the abundance of intranuclear fold with Lamin-A/C. Trehalose were added during periods of several days, at the indicated time intervals in days of culture (DIV); after 26 DIV all cultures (including control with no treatment) were fixed to detect Lamin-A/C by immunofluorescence. Scale bar represents 5 μm. Representative images of three independent experiments are shown. At least 60 cells per treatment were quantified as described in Methods. Bars in the bottom graph represents mean. Data were analyzed by two-way RM ANOVA, followed by Dunnett´s multiple comparison test. ***p<0.001; **** p< 0.0001 with respect to control.

References

    1. Soto-Gamez A, Demaria M. Therapeutic interventions for aging: the case of cellular senescence. Drug Discov Today. 2017; 22:786–95. 10.1016/j.drudis.2017.01.004 - DOI - PubMed
    1. Muñoz-Espín D, Serrano M. Cellular senescence: from physiology to pathology. Nat Rev Mol Cell Biol. 2014; 15:482–96. 10.1038/nrm3823 - DOI - PubMed
    1. Matjusaitis M, Chin G, Sarnoski EA, Stolzing A. Biomarkers to identify and isolate senescent cells. Ageing Res Rev. 2016; 29:1–12. 10.1016/j.arr.2016.05.003 - DOI - PubMed
    1. Lenain C, Gusyatiner O, Douma S, van den Broek B, Peeper DS. Autophagy-mediated degradation of nuclear envelope proteins during oncogene-induced senescence. Carcinogenesis. 2015; 36:1263–74. 10.1093/carcin/bgv124 - DOI - PubMed
    1. Acosta JC, Banito A, Wuestefeld T, Georgilis A, Janich P, Morton JP, Athineos D, Kang TW, Lasitschka F, Andrulis M, Pascual G, Morris KJ, Khan S, et al. A complex secretory program orchestrated by the inflammasome controls paracrine senescence. Nat Cell Biol. 2013; 15:978–90. 10.1038/ncb2784 - DOI - PMC - PubMed

Publication types

LinkOut - more resources