. 2019 Aug 29;8(9):1001.
doi: 10.3390/cells8091001.

Nutritional Stress in Head and Neck Cancer Originating Cell Lines: The Sensitivity of the NRF2-NQO1 Axis

Affiliations

Nutritional Stress in Head and Neck Cancer Originating Cell Lines: The Sensitivity of the NRF2-NQO1 Axis

Lidija Milković et al. Cells. .

Abstract

Nutritional stress disturbs the cellular redox-status, which is characterized by the increased generation of reactive oxygen species (ROS). The NRF2-NQO1 axis represents a protective mechanism against ROS. Its strength is cell type-specific. FaDu, Cal 27 and Detroit 562 cells differ with respect to basal NQO1 activity. These cells were grown for 48 hours in nutritional conditions (NC): (a) Low glucose-NC2, (b) no glucose, no glutamine-NC3, (c) no glucose with glutamine-NC4. After determining the viability, proliferation and ROS generation, NC2 and NC3 were chosen for further exploration. These conditions were also applied to IMR-90 fibroblasts. The transcripts/transcript variants of NRF2 and NQO1 were quantified and transcript variants were characterized. The proteins (NRF2, NQO1 and TP53) were analyzed by a western blot in both cellular fractions. Under NC2, the NRF2-NQO1 axis did not appear activated in the cancer cell lines. Under NC3, the NRF2-NQO1axis appeared slightly activated in Detroit 562. There are opposite trends with respect to TP53 nuclear signal when comparing Cal 27 and Detroit 562 to FaDu, under NC2 and NC3. The strong activation of the NRF2-NQO1 axis in IMR-90 resulted in an increased expression of catalytically deficient NQO1, due to NQO1*2/*2 polymorphism (rs1800566). The presented results call for a comprehensive exploration of the stress response in complex biological systems.

Keywords: IMR-90; NQO1 transcript variants; NRF2-NQO1 axis; ROS; TP53 mutation; glucose deprivation; glutamine deprivation; proliferation; rs1800566; viability.


Conflict of interest statement

The authors declare no conflict of interest.

Figures

Figure 1
Figure 1
Structure of the NQO1 gene, NG_011504.2.
Figure 2
Figure 2
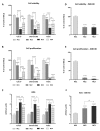
The viability, proliferation and generation of ROS in cancer cell lines (AC) and IMR-90 (DF) after exposure to NC1-NC4 and NC1-NC3, respectively, for 48 hours. One-way ANOVA with Tukey post-hoc test was used to test the differences with regard to nutrient conditions. The values are shown as the mean ± 95% CI. N = 3. * p < 0.05; ** p < 0.01; *** p < 0.001; **** p < 0.0001.
Figure 3
Figure 3
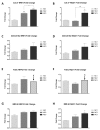
The quantification of target transcripts, NRF2 and NQO1, in real time (RT-qPCR). One-way ANOVA with Tukey post hoc test was used to test the differences with respect to the quantity of NRF2 and NQO1 mRNA, under different nutritional conditions. The values are shown as the mean ± SD. N = 3. * p < 0.05; ** p < 0.01; *** p < 0.001; **** p < 0.0001. * The Fold Change for NRF2 and NQO1 in FaDu under NC3 was estimated according to the Ct values.
Figure 4
Figure 4
The presence of three NQO1 splice variants in all four cell lines, under three nutritional conditions (35 PCR cycles). L: 100 bp DNA ladder (Invitrogen). A. IMR-90 and FaDu; B. Cal 27; C. Detroit 562. TV1: 685 bps, TV3: 571 bps and TV4: 469 bps.
Figure 5
Figure 5
The sequence analyses of amplicons obtained from the Cal 27 NQO1-cDNA amplified with the primer pair NQO1F/NQO1R (Table 1), presented in Figure 4, confirm the presence of transcript variants TV1 (A), TV3 (B), and TV4 (C). Eight nucleotides in the terminal part of the 3’ exon 3 are common to all three amplicons and are shown in blue. The sequences of TVs were identical in all cell lines.
Figure 6
Figure 6
The dependence of the TV1/TV3 ratio on NCs applied. One-way ANOVA with Tukey post-hoc test. The ascending trends were recorded in Cal 27 as contrasted with the other three cell lines. The values are shown as the mean ± SD. N = 3. * p < 0.05; ** p < 0.01; *** p < 0.001; **** p < 0.0001.
Figure 7
Figure 7
A. Single nucleotide variation C+G wass present in IMR-90, in NQO1 intron 1. The terminal part of the 3' exon 1 is shown in blue. The distance between the polymorphic locus, revealed to be rs 689,460 according to NCBI, and 3' of exon 1, is only 50 nts. B. All three cancer cell lines were homozygos, rs 689,460 G+G, as shown here, for Cal 27. C. Single nucleotide variant C+G in IMR-90 did not influence the NQO1 splicing. The amplicons obtained in IMR-90 under given conditions did not differ from those obtained in homozygos (G+G) cancer cell lines (only Cal 27 is shown). L: 100 bp DNA ladder. Lines 1–3 and lines 4–6: IMR-90 and Cal 27 under NC1, NC2 and NC3, respectively.
Figure 8
Figure 8
A. Single nucleotide variant, rs 689452, C+G in Cal 27 (also present in Detroit 562) is in intron 1, separated from the 5' part of exon 2 (labeled blue) by only 27 nts. B. In FaDu (shown by an arrow) and IMR-90 (not shown), the sequence was homozygous, C + C.
Figure 9
Figure 9
The presence of SNV rs1800566, in IMR-90 (NQO1*2/*2; (A)) and WI-38 (NQO1*1/*2; (C)). The homozygous triplet TCT, coding for Serine, replaces the CCT triplet coding for Proline, which was present in all cancer cell lines, as shown for Cal 27 (B).
Figure 10
Figure 10
The expression of NQO1, NRF2 and TP53 in cancer cell lines and IMR-90. The representative western blots of cytoplasmic and nuclear NQO1, NRF2 and TP53 content under different nutritional conditions: (A) NC2 (low glucose + l-glutamine); (B) NC3 (no glucose and no l-glutamine). The relative expression is calculated as compared to the control condition (NC1 – high glucose + l-glutamine) for: C-cytoplasmic and D-nuclear NQO1; E-cytoplasmic and F-nuclear NRF2; G-cytoplasmic and H-nuclear TP53. One-way ANOVA with Tukey post hoc test was used to test the differences in relative expression of selected proteins under different nutrient conditions. The values are shown as the mean ± SD. n = 3. * p < 0.05; ** p < 0.01; *** p < 0.001; **** p < 0.0001.
Figure 11
Figure 11
The cellular distribution and the rate of change of the NRF2, NQO1 and TP53 proteins in all four cell lines, under NC1-NC3.

References

    1. Bott A.J., Maimouni S., Zong W.-X. The pleiotropic effects of glutamine metabolism in cancer. Cancers. 2019;11:770. doi: 10.3390/cancers11060770. - DOI - PMC - PubMed
    1. Jeon S.-M., Chandel N.S., Hay N. AMPK regulates NADPH homeostasis to promote tumour cell survival during energy stress. Nature. 2012;485:661–665. doi: 10.1038/nature11066. - DOI - PMC - PubMed
    1. Wu C.-A., Chao Y., Shiah S.-G., Lin W.-W. Nutrient deprivation induces the Warburg effect through ROS/AMPK-dependent activation of pyruvate dehydrogenase kinase. Biochim. Biophys. Acta. 2013;1833:1147–1156. doi: 10.1016/j.bbamcr.2013.01.025. - DOI - PubMed
    1. Son J., Lyssiotis C.A., Ying H., Wang X., Hua S., Ligorio M., Perera R.M., Ferrone C.R., Mullarky E., Shyh-Chang N., et al. Glutamine supports pancreatic cancer growth through a KRAS-regulated metabolic pathway. Nature. 2013;496:101–105. doi: 10.1038/nature12040. - DOI - PMC - PubMed
    1. Lie S., Wang T., Forbes B., Proud C.G., Petersen J. The ability to utilise ammonia as nitrogen source is cell type specific and intricately linked to GDH, AMPK and mTORC1. Sci. Rep. 2019;9:1461. doi: 10.1038/s41598-018-37509-3. - DOI - PMC - PubMed

Publication types

MeSH terms