. 2019 Dec;16(12):1806-1816.
doi: 10.1080/15476286.2019.1661213. Epub 2019 Sep 5.

From reporters to endogenous genes: the impact of the first five codons on translation efficiency in Escherichia coli

Affiliations

From reporters to endogenous genes: the impact of the first five codons on translation efficiency in Escherichia coli

Mariana H Moreira et al. RNA Biol. 2019 Dec.

Abstract

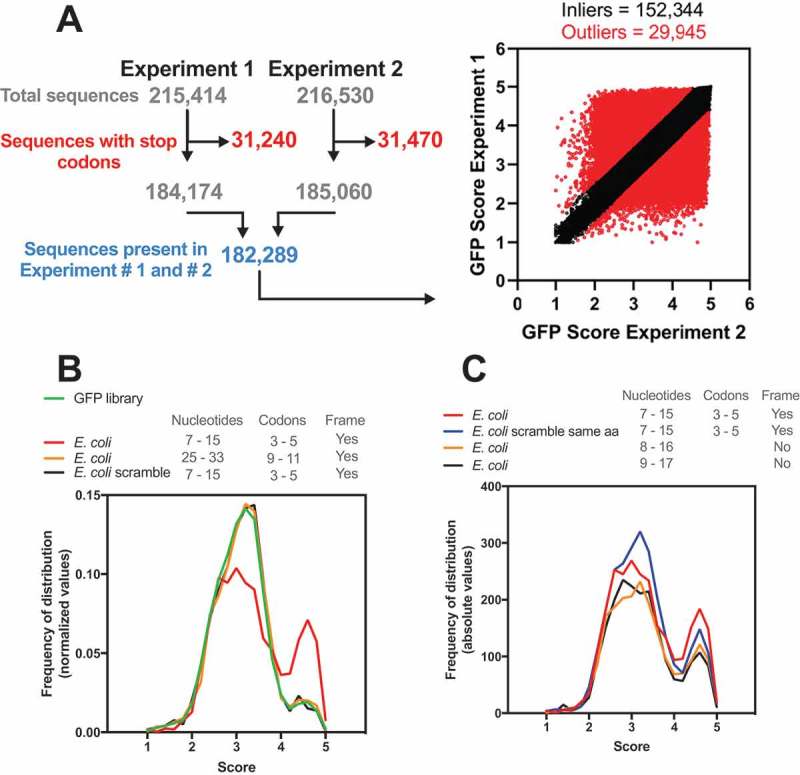
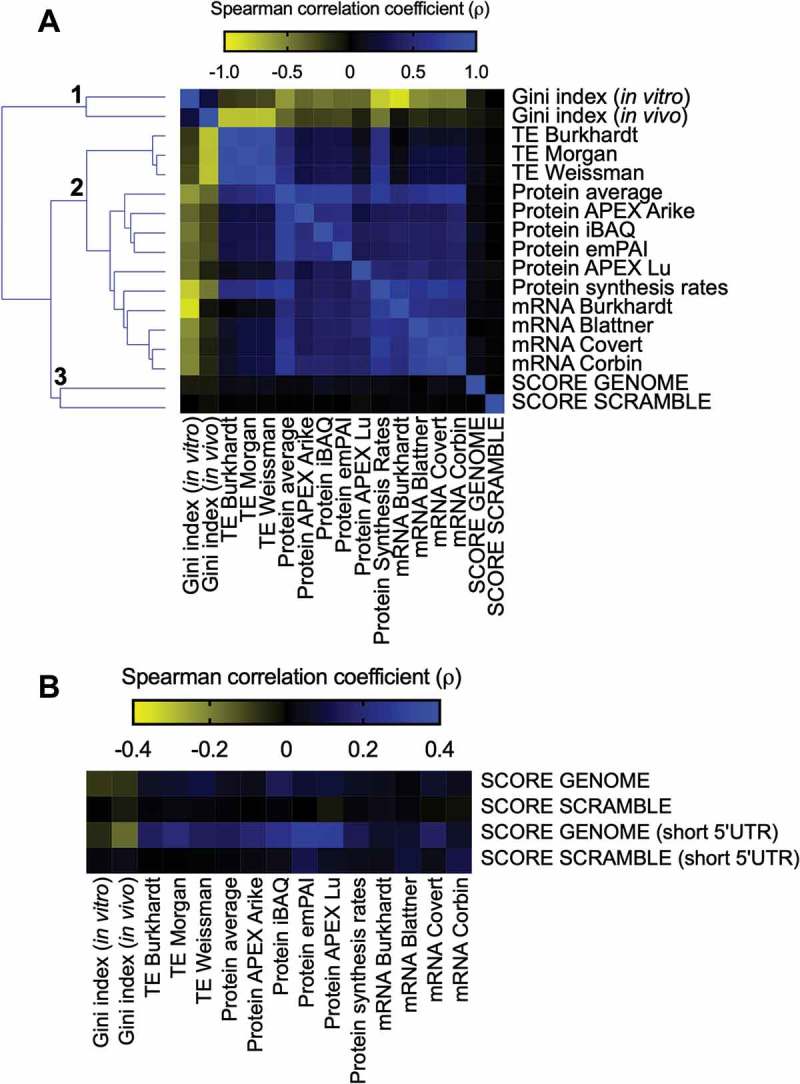
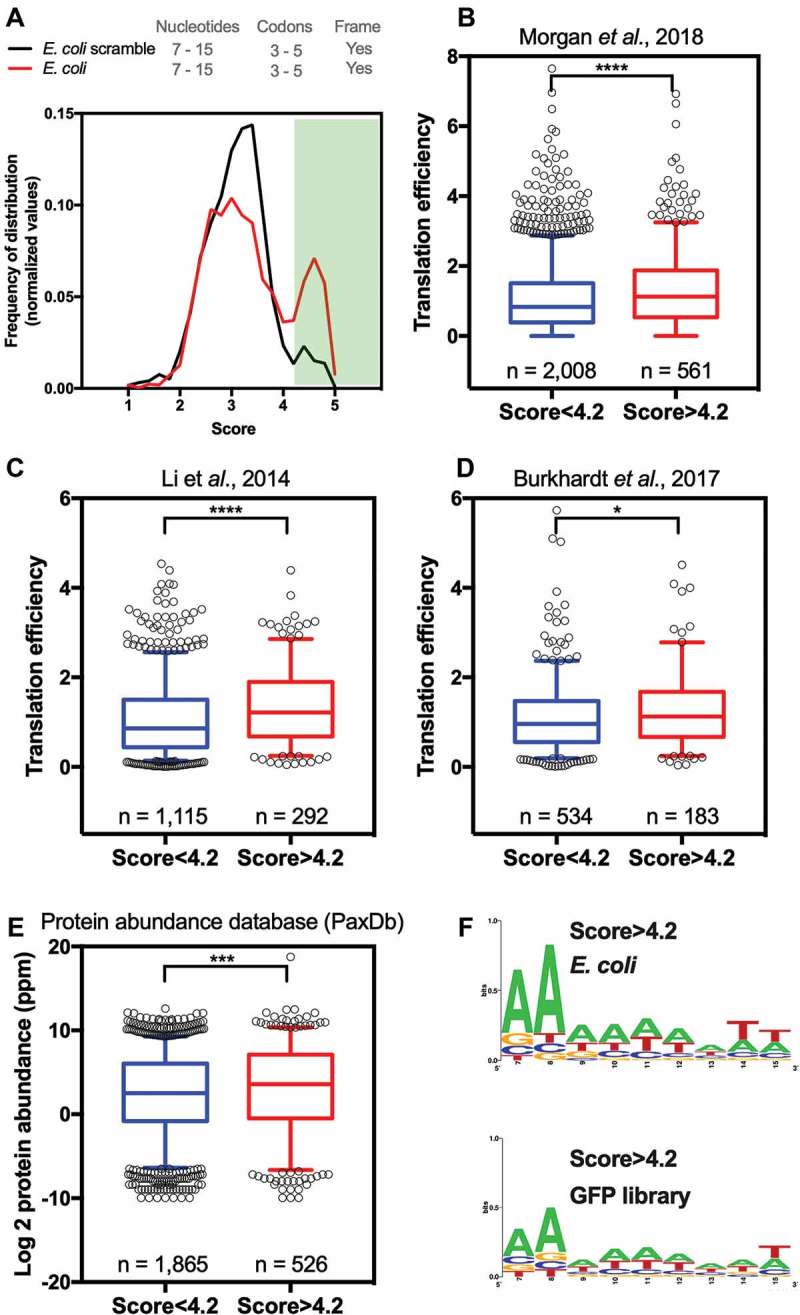
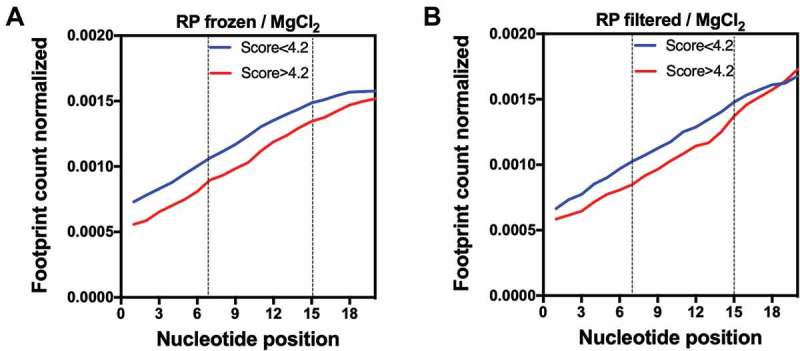
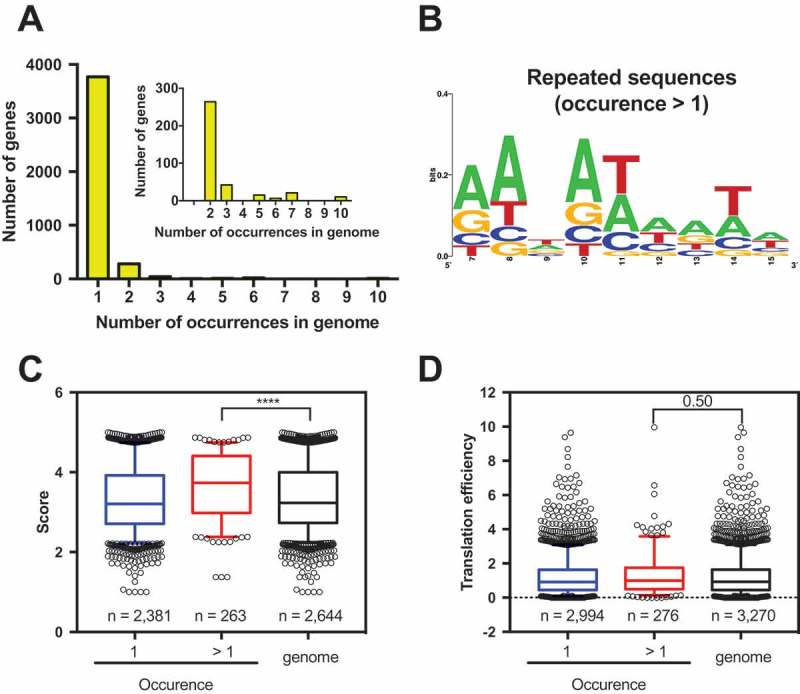
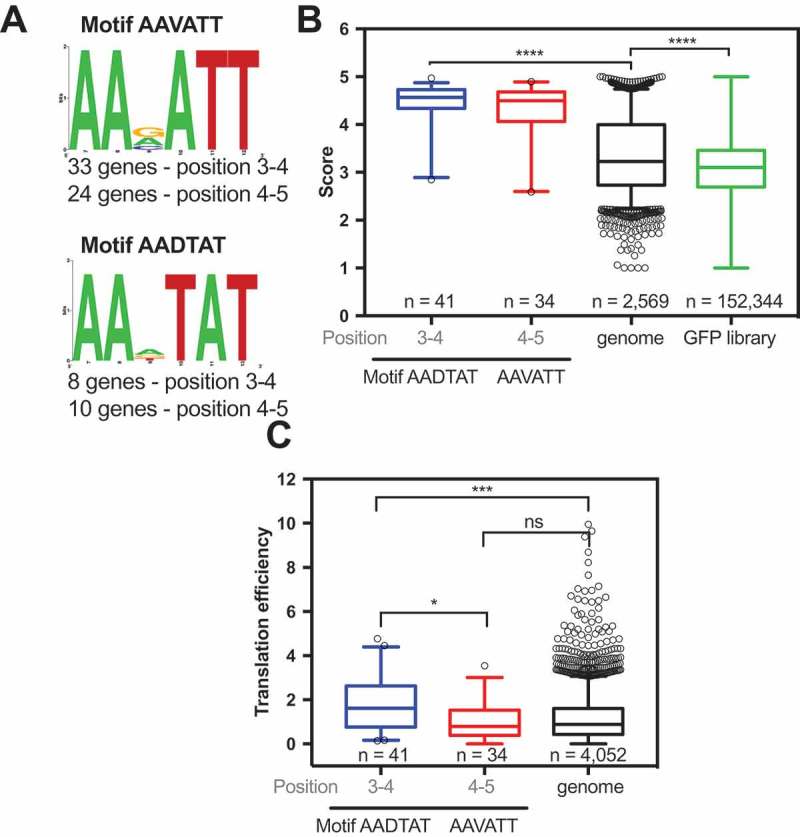
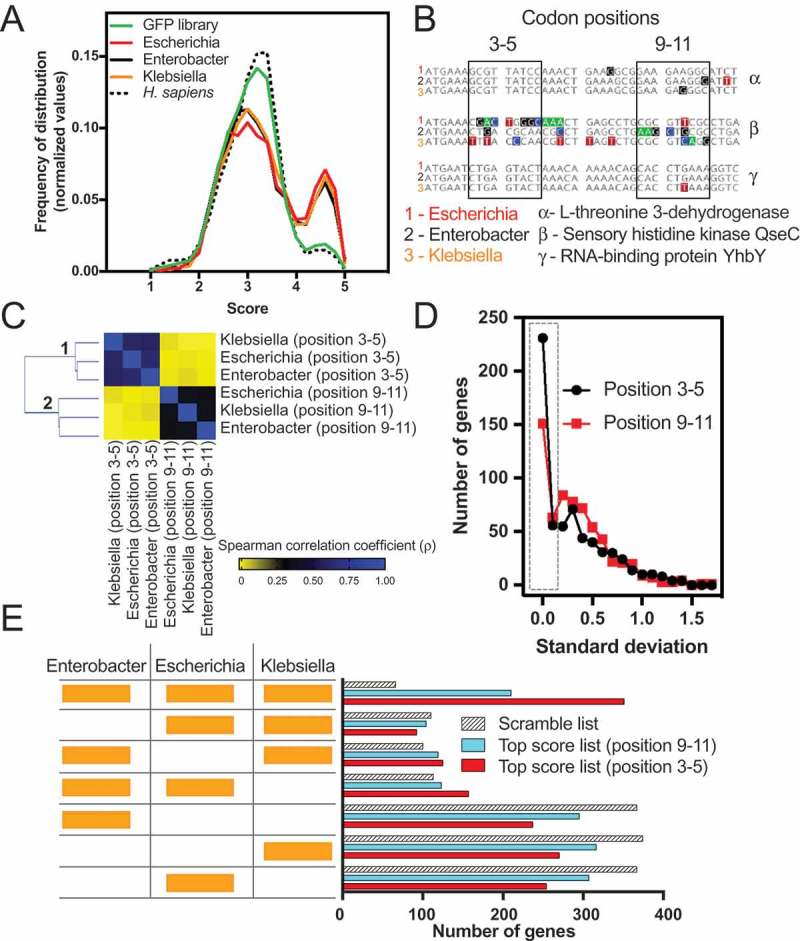
Translation initiation is a critical step in the regulation of protein synthesis, and it is subjected to different control mechanisms, such as 5' UTR secondary structure and initiation codon context, that can influence the rates at which initiation and consequentially translation occur. For some genes, translation elongation also affects the rate of protein synthesis. With a GFP library containing nearly all possible combinations of nucleotides from the 3rd to the 5th codon positions in the protein coding region of the mRNA, it was previously demonstrated that some nucleotide combinations increased GFP expression up to four orders of magnitude. While it is clear that the codon region from positions 3 to 5 can influence protein expression levels of artificial constructs, its impact on endogenous proteins is still unknown. Through bioinformatics analysis, we identified the nucleotide combinations of the GFP library in Escherichia coli genes and examined the correlation between the expected levels of translation according to the GFP data with the experimental measures of protein expression. We observed that E. coli genes were enriched with the nucleotide compositions that enhanced protein expression in the GFP library, but surprisingly, it seemed to affect the translation efficiency only marginally. Nevertheless, our data indicate that different enterobacteria present similar nucleotide composition enrichment as E. coli, suggesting an evolutionary pressure towards the conservation of short translational enhancer sequences.

Keywords: Translational ramp; bacteria; ribosome profiling; translation elongation; translational efficiency.


Figures

Figure 1.
Figure 1.
The E. coli genome has a bias towards nucleotide composition at codons 3–5. (A) Djuranovic’s group performed a high-throughput screen varying the nucleotide composition at codons 3–5 in GFP. In experiments #1 and #2, 215,414 and 261,530 different compositions were analysed, respectively, regarding the GFP fluorescence levels. The sequences with a stop codon (31,240 and 31,470 for experiments #1 and #2, respectively) were removed, and only sequences present in both experiments were used (182,289). The outliers (29,945) were defined by setting Q = 1% in the linear regression. We then calculated the average GFP score of the inliers (152,344) from experiments #1 and #2. This list was used in all subsequent bioinformatics experiments. (B) Density histogram of GFP scores for genes identified in E. coli. The nucleotide composition at codon positions 3–5 or 9–11 was analysed. As a control, we used a scrambled genome where the codon proportion was maintained, but their position was randomly changed. Note that only codon positions 3–5 in the real genome possessed a bias towards high GFP scores. (C) The effect of amino acid composition and mRNA sequence on GFP score bias was analysed. As a control, we used a scrambled genome where the codons were randomly changed, keeping the codon proportion and amino acid sequence of each gene (E. coli scramble same aa).
Figure 2.
Figure 2.
E. coli individual gene score calculation and its relationship with different parameters involved with gene expression. (A) Spearman’s correlation between the E. coli score derived from the GFP library dataset (SCORE GENOME) with different cellular parameters: Gini index, TE, protein abundance, protein synthesis rates, and mRNA abundance. The heat map shows Spearman’s correlation coefficient (ρ) values ranging from −0.88 (negative correlation, yellow panels) to 1.0 (positive correlation, blue panels). Spearman’s correlation coefficient (ρ) values of the GFP score with other parameters ranging from −0.08 to 0.13. As a control, we used an E. coli scrambled genome to calculate the GFP score (SCORE SCRAMBLE). (B) The same analysis described in panel A was performed with a group of genes with short 5ʹ UTRs (< 25 nucleotides).
Figure 3.
Figure 3.
E. coli genes with GFP scores higher than 4.2 have higher translation efficiency and protein abundance than other genes. (A) Density histogram of GFP scores for genes identified in E. coli for nucleotide composition at codon positions 3–5. As a control, we used a scrambled genome. Based on the GFP score, the E. coli genes were divided into two groups: genes with a score higher than 4.2 and scores lower than 4.2. Translation efficiency was measured in three independent studies, Morgan et al., 2018 [17](B), Li et al., 2014 [18](C) and Burkahardt et al., 2017 [19](D). (E) Protein abundance of genes with a score higher than 4.2 and score lower than 4.2. Kolmogorov-Smirnov nonparametric t-test, ****<0.0001, ***0.0004, *0.028. (F) Web Logo of nucleotide composition at codon positions 3–5 of E. coli genes or GFP library with a score higher than 4.2.
Figure 4.
Figure 4.
Ribosome occupancy at the first 20 nucleotides of genes with GFP scores higher than 4.2 at codon positions 3–5 (nucleotides 7–15) are lower when compared to other genes. The average ribosome footprint counts of each group were obtained from ribosome profiling (RP) libraries of differently treated samples: frozen/MgCl2 (A) or filtered/MgCl2 (B) [33]. For each gene, the number of reads per base was normalized to the total number of reads.
Figure 5.
Figure 5.
Most E. coli genes possess a unique nucleotide composition at codon positions 3–5. (A) The frequency of distribution of nucleotide composition at codon positions 3–5 shows that 91% of E. coli genes have a unique nucleotide composition (occurrence = 1). The other 9% share at least one nucleotide composition with another gene (occurrence > 1). (B) Web logo [37] of genes that share the same nucleotide composition at codon positions 3–5. GFP score average (C) and translation efficiency (D) comparison of genes with a unique nucleotide composition at codon positions 3–5 vs. genes with repeated nucleotide compositions. The TE data were obtained from Morgan et al., 2018 [17]. Kruskal-Wallis nonparametric test ****<0.0001, 0.5 = nonsignificant.
Figure 6.
Figure 6.
E. coli genes with the motifs AAVATT and AADTAT at codon positions 3 and 4 are more efficiently translated than other genes. (A) The motifs AAVATT or AADTAT (V = A, G or C and D = G, A or T) were identified in the E. coli genome at codon positions 3 and 4 (33 genes with AAVATT and 8 genes with AADTAT) or at codon positions 4 and 5 (24 genes with AAVATT and 10 genes with AADTAT). The genes with motifs AAVATT or AADTAT at codon positions 3 to 4 have a higher GFP score (B) and translation efficiency [17](C) than the E. coli genome. Kruskal-Wallis nonparametric test *** 0.0005 and ****<0.0001. The TE data were obtained from Morgan et al., 2018.
Figure 7.
Figure 7.
Evolutionary conservation of the short ribosomal ramp. (A) Density histogram of GFP scores of genes identified in E. coli (Escherichia), E. asburiae (Enterobacter), K. oxytoca (Klebsiella) and Homo sapiens for nucleotide compositions at codon positions 3–5. As a control, the GFP library score was plotted. (B) A list of 1,595 orthologous genes of E. coli, E. asburiae, and K. oxytoca was analysed regarding the score of each gene at codon positions 3–5 or 9–11. As an example, three genes (α, β, and γ) are shown. (C) Correlation matrix of the score of orthologous genes of E. coli, E. asburiae, and K. oxytoca. (D) The standard deviation score of each set of three orthologous genes was calculated and plotted as a frequency of distribution. (E) The top 500 genes with the best GFP score of E. coli, E. asburiae, and K. oxytoca were analysed regarding their orthology. The codon positions 3–5 or 9–11 were used to calculate the GFP score. As a control, a scramble list with 500 genes of each bacterium was used.

References

    1. Powers ET, Powers DL, Gierasch LM.. FoldEco: a model for proteostasis in E. coli. Cell Rep. 2012;1:265–276. - PMC - PubMed
    1. Li G-W. How do bacteria tune translation efficiency? Curr Opin Microbiol. 2015;24:66–71. - PMC - PubMed
    1. Steitz JA, Jakes K. How ribosomes select initiator regions in mRNA: base pair formation between the 3ʹ terminus of 16S rRNA and the mRNA during initiation of protein synthesis in Escherichia coli. Proc Natl Acad Sci U S A. 1975;72:4734–4738. - PMC - PubMed
    1. Choi J, Grosely R, Prabhakar A, et al. How messenger RNA and nascent chain sequences regulate translation elongation. Annu Rev Biochem. 2018;87:421–449. - PMC - PubMed
    1. Chu D, Kazana E, Bellanger N, et al. Translation elongation can control translation initiation on eukaryotic mRNAs. Embo J. 2014;33:21–34. - PMC - PubMed

Publication types

MeSH terms