. 2019 Aug 30;20(1):686.
doi: 10.1186/s12864-019-6046-x.

Minor intron splicing revisited: identification of new minor intron-containing genes and tissue-dependent retention and alternative splicing of minor introns

Affiliations

Minor intron splicing revisited: identification of new minor intron-containing genes and tissue-dependent retention and alternative splicing of minor introns

Anouk M Olthof et al. BMC Genomics. .

Abstract

Background: Mutations in minor spliceosome components such as U12 snRNA (cerebellar ataxia) and U4atac snRNA (microcephalic osteodysplastic primordial dwarfism type 1 (MOPD1)) result in tissue-specific symptoms. Given that the minor spliceosome is ubiquitously expressed, we hypothesized that these restricted phenotypes might be caused by the tissue-specific regulation of the minor spliceosome targets, i.e. minor intron-containing genes (MIGs). The current model of inefficient splicing is thought to apply to the regulation of the ~ 500 MIGs identified in the U12DB. However this database was created more than 10 years ago. Therefore, we first wanted to revisit the classification of minor introns in light of the most recent reference genome. We then sought to address specificity of MIG expression, minor intron retention, and alternative splicing (AS) across mouse and human tissues.

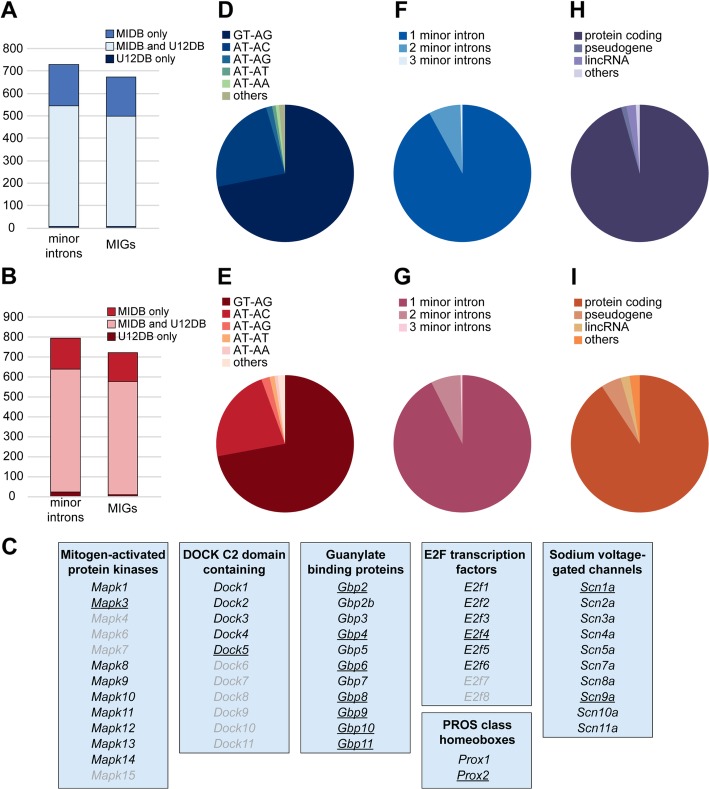
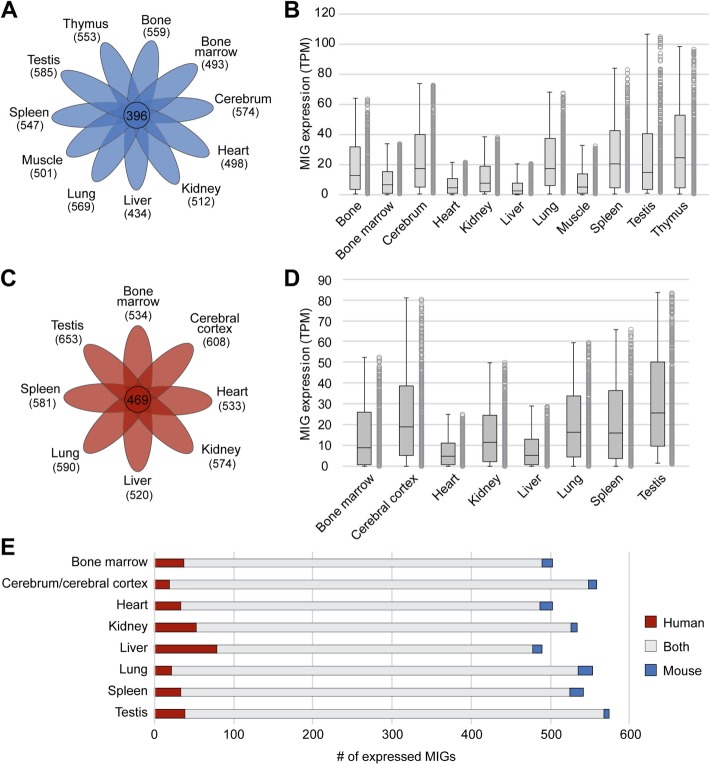
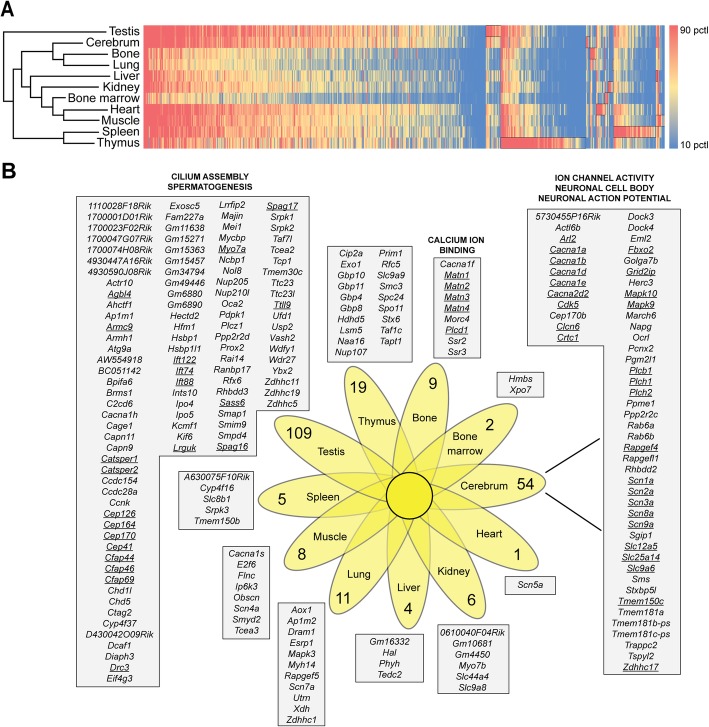
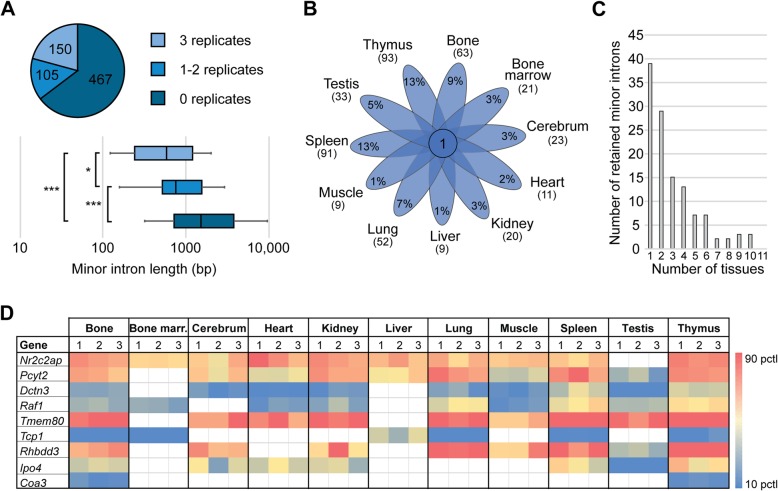
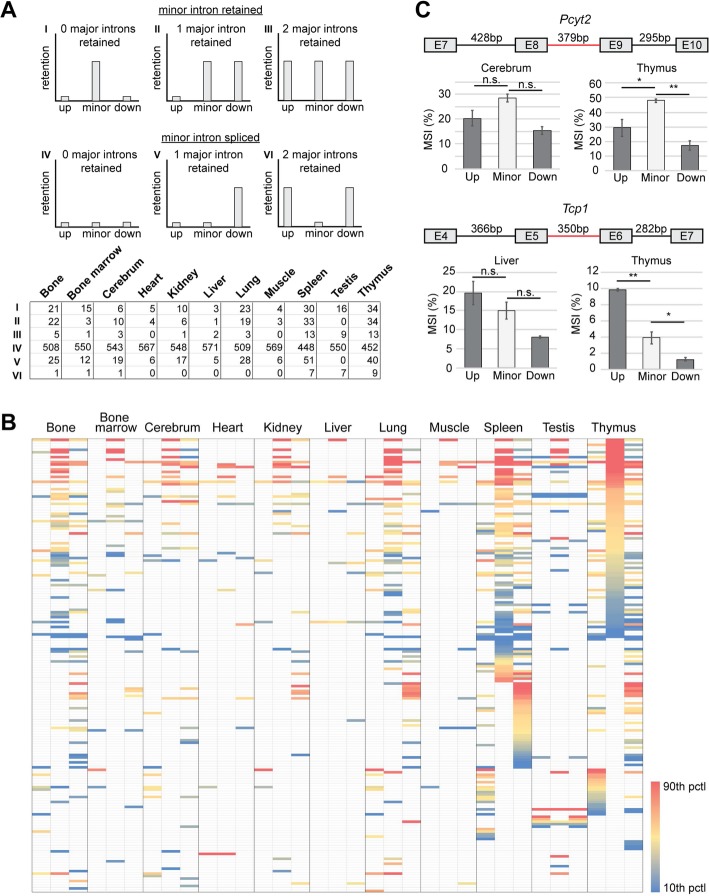
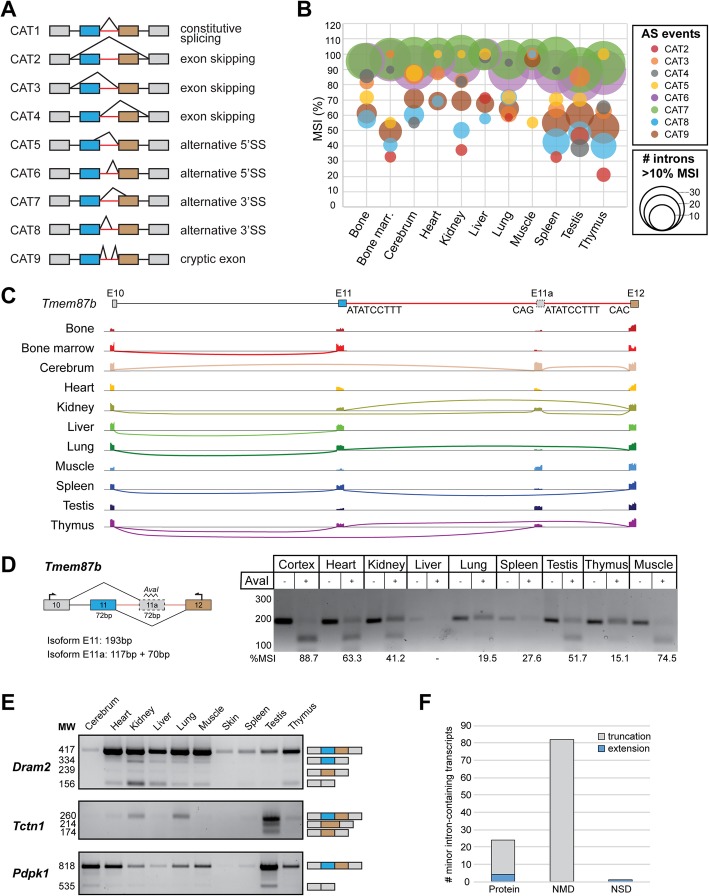
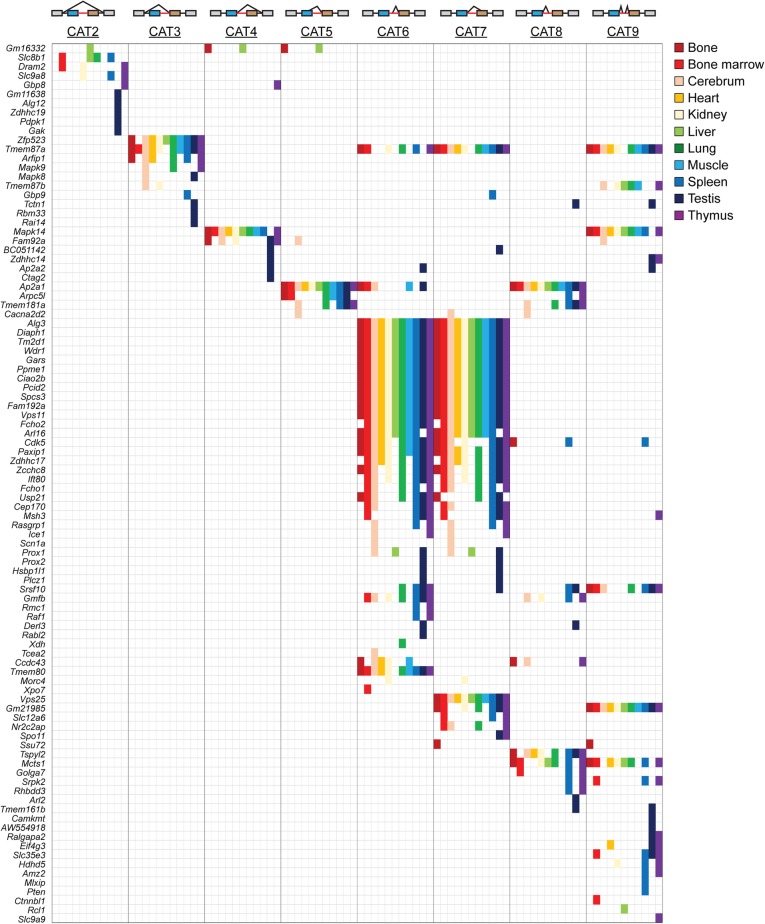
Results: We employed position-weight matrices to obtain a comprehensive updated list of minor introns, consisting of 722 mouse and 770 human minor introns. These can be found in the Minor Intron DataBase (MIDB). Besides identification of 99% of the minor introns found in the U12DB, we also discovered ~ 150 new MIGs. We then analyzed the RNAseq data from eleven different mouse tissues, which revealed tissue-specific MIG expression and minor intron retention. Additionally, many minor introns were efficiently spliced compared to their flanking major introns. Finally, we identified several novel AS events across minor introns in both mouse and human, which were also tissue-dependent. Bioinformatics analysis revealed that several of the AS events could result in the production of novel tissue-specific proteins. Moreover, like the major introns, we found that these AS events were more prevalent in long minor introns, while retention was favoured in shorter introns.

Conclusion: Here we show that minor intron splicing and AS across minor introns is a highly organised process that might be regulated in coordination with the major spliceosome in a tissue-specific manner. We have provided a framework to further study the impact of the minor spliceosome and the regulation of MIG expression. These findings may shed light on the mechanism underlying tissue-specific phenotypes in diseases associated with minor spliceosome inactivation. MIDB can be accessed at https://midb.pnb.uconn.edu .

Keywords: Alternative splicing; MIDB; Minor intron retention; Minor spliceosome; Tissue-specificity.


Conflict of interest statement

The authors declare no competing interests.

Figures

Fig. 1
Fig. 1
Identification of new minor introns in the mouse and human genome. a-b Stacked bargraph showing the number of minor introns and MIGs identified in the mouse (a) and human (b) genome by the U12DB and MIDB. c Overview of mouse gene families that contain MIGs (black text) and were newly identified in MIDB (underlined). d-e Piechart showing the distribution of mouse (d) and human (e) minor introns based on their terminal dinucleotides. f-g Piechart showing the distribution of mouse (f) and human (g) MIGs with one, two or three minor introns. h-i Piechart showing the gene types of all mouse (h) and human (i) MIGs
Fig. 2
Fig. 2
Expression of minor intron-containing genes is dynamic across mouse and human tissues. a Venn diagram showing the overlap of MIGs expressed > 1 TPM in eleven mouse tissues. b Boxplots representing the 10th–90th percentile of MIG expression in TPM across mouse tissues. c Venn diagram showing the overlap of MIGs expressed > 1 TPM in eight human tissues. d Boxplots representing the 10th–90th percentile of MIG expression in TPM across human tissues. e Stacked bargraph showing the number of MIGs expressed (> 1 TPM) in each tissue in mouse (blue), human (red), or both (grey). TPM = transcripts per million
Fig. 3
Fig. 3
Tissue-enriched MIGs participate in specific biological functions. a Hierarchical clustering of mouse tissues based on MIG expression. Heatmap represents TPM values of all 666 MIGs. b Venn diagram showing the number of uniquely upregulated (>2FC; P < 0.01) MIGs in each tissue. Genes enriched in each tissue are listed, as well as the biological processes that were significantly enriched for. MIGs participating in any of the biological processes are underlined. pctl = percentile
Fig. 4
Fig. 4
Minor introns are retained in a tissue-dependent manner. a Piechart with number of minor introns that show retention in number of replicates of at least one tissue. Boxplots reflect the 5th–95th percentile of minor intron length in each of the three categories. Significance was determined by Kruskal-Wallis rank sum test, followed by post-hoc multiple comparison using Dunn method. *** = P < 0.001; * = P < 0.05. b Venn diagram showing the overlap of retained minor introns across eleven mouse tissues. Only minor introns that passed filtering criteria in all three replicates of a tissue were included. c Histogram of the number of tissues in which minor introns were retained. d Heatmap of MSI values across eleven mouse tissues for nine minor introns. White cells denote that a minor intron did not pass the filtering criteria for retention in that tissue. See also methods. MSI = mis-splicing index; marr. = marrow; pctl = percentile
Fig. 5
Fig. 5
Minor intron splicing can be efficient. a Table showing the number of retained minor introns and flanking major introns across eleven mouse tissues. Above are schematics exemplifying the 6 different categories. b Heatmap of MSI values for minor introns, upstream major introns, and downstream major introns across eleven mouse tissues. c Bargraphs showing retention levels for the minor intron, upstream and downstream major introns of Pcyt2 and Tcp1 in different tissues as determined by RNAseq. Data are represented as mean ± SEM. Above is the gene schematic with intron sizes. Minor intron is depicted by the red line. MSI = mis-splicing index; E = exon; pctl = percentile. Significance was determined by one-way ANOVA, followed by post-hoc Tukey test. * = P < 0.05; ** = P < 0.01; n.s. = not significant
Fig. 6
Fig. 6
Minor introns are alternatively spliced in a tissue-dependent manner. a Schematic of the nine interrogated AS events. Red line denotes the minor intron. b Bubbleplot reflecting AS usage across minor introns in eleven mouse tissues. Size of the circle represents the number of introns that passed the filtering criteria, the colour represents the type of AS. See also Methods. c Sashimi plot of Tmem87b showing tissue-dependent usage of a cryptic exon within the minor intron. Only arcs representing > 10 reads were included. d Gel image of RT-PCR products for Tmem87b across different tissues. Products were cut with AvaI restriction enzyme to determine tissue-specific isoform usage. Predicted product sizes are shown below the gene schematic. Red line denotes the minor intron. %MSI was calculated using ImageJ by quantifying respective band intensity. e Gel images of RT-PCR products for Dram2, Tctn1 and Pdpk1 across different tissues. Schematic of identified transcripts on the right. f Bargraph representing the number of alternatively spliced transcripts predicted to be translated into protein, or targeted for non-sense mediated decay (NMD) or non-stop mediated decay (NSD). MSI = mis-splicing index
Fig. 7
Fig. 7
Multiple AS events around the minor intron are employed within the same MIG. Table showing the minor introns that are alternatively spliced. Colours indicate the tissue that a specific AS event was detected in for a minor intron

References

    1. Turunen JJ, Niemela EH, Verma B, Frilander MJ. The significant other: splicing by the minor spliceosome. Wiley Interdiscip Rev RNA. 2013;4(1):61–76. doi: 10.1002/wrna.1141. - DOI - PMC - PubMed
    1. He H, Liyanarachchi S, Akagi K, Nagy R, Li J, Dietrich RC, Li W, Sebastian N, Wen B, Xin B, et al. Mutations in U4atac snRNA, a component of the minor spliceosome, in the developmental disorder MOPD I. Science. 2011;332(6026):238–240. doi: 10.1126/science.1200587. - DOI - PMC - PubMed
    1. Edery P, Marcaillou C, Sahbatou M, Labalme A, Chastang J, Touraine R, Tubacher E, Senni F, Bober MB, Nampoothiri S, et al. Association of TALS developmental disorder with defect in minor splicing component U4atac snRNA. Science. 2011;332(6026):240–243. doi: 10.1126/science.1202205. - DOI - PubMed
    1. Merico D, Roifman M, Braunschweig U, Yuen RK, Alexandrova R, Bates A, Reid B, Nalpathamkalam T, Wang Z, Thiruvahindrapuram B, et al. Compound heterozygous mutations in the noncoding RNU4ATAC cause Roifman syndrome by disrupting minor intron splicing. Nat Commun. 2015;6:8718. doi: 10.1038/ncomms9718. - DOI - PMC - PubMed
    1. Farach LS, Little ME, Duker AL, Logan CV, Jackson A, Hecht JT, Bober M. The expanding phenotype of RNU4ATAC pathogenic variants to Lowry wood syndrome. Am J Med Genet A. 2018;176(2):465–469. doi: 10.1002/ajmg.a.38581. - DOI - PMC - PubMed