. 2019 Sep 17;51(3):451-464.e6.
doi: 10.1016/j.immuni.2019.07.007. Epub 2019 Aug 27.

Differential Activation of the Transcription Factor IRF1 Underlies the Distinct Immune Responses Elicited by Type I and Type III Interferons

Affiliations

Differential Activation of the Transcription Factor IRF1 Underlies the Distinct Immune Responses Elicited by Type I and Type III Interferons

Adriana Forero et al. Immunity. .

Abstract

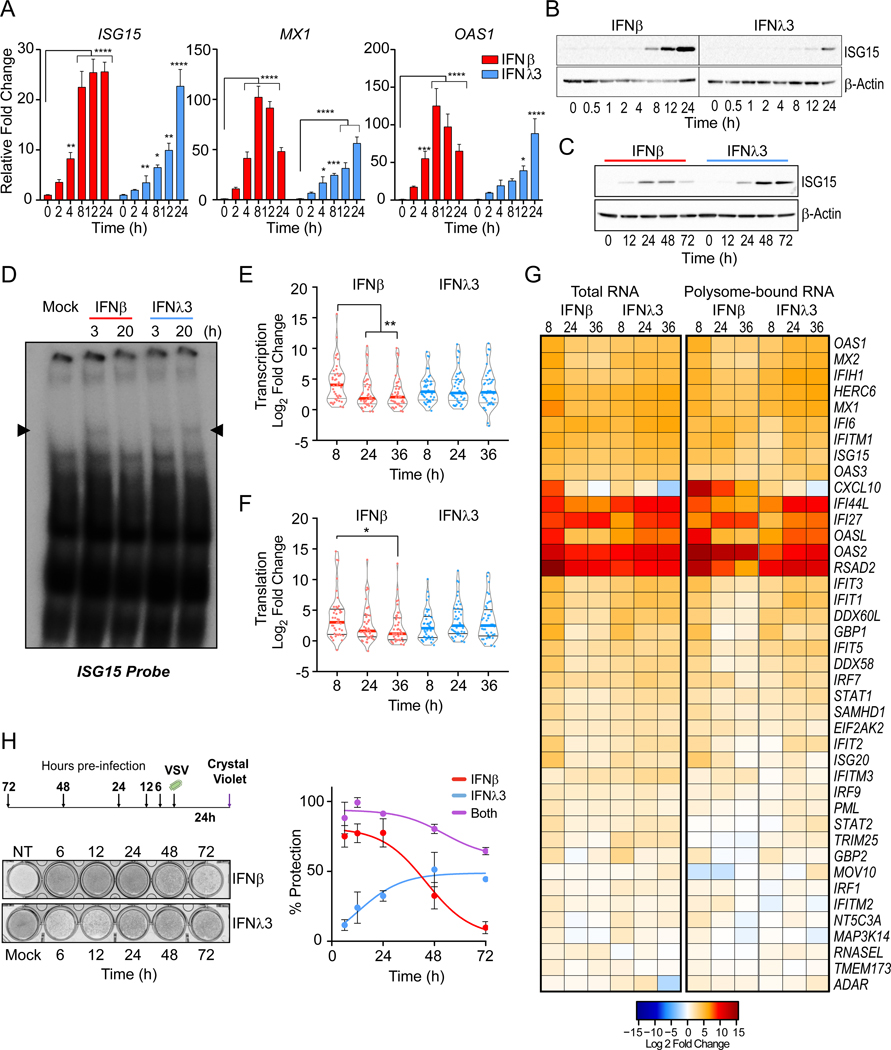
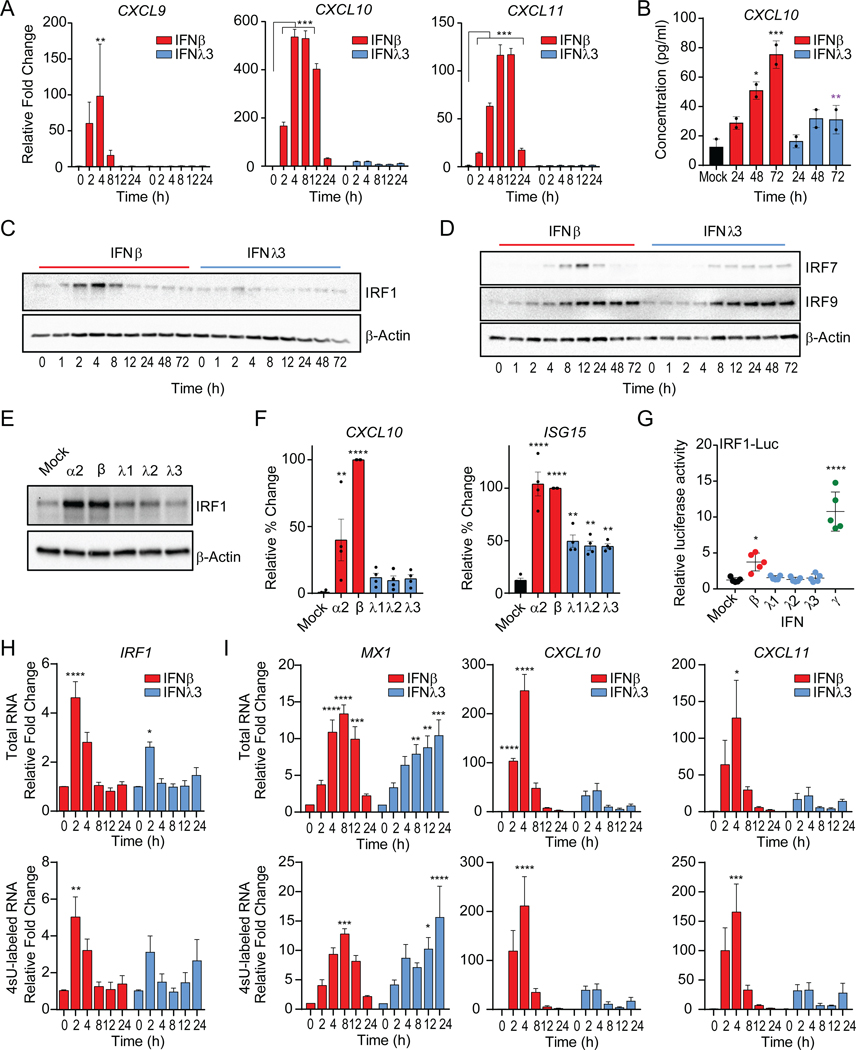
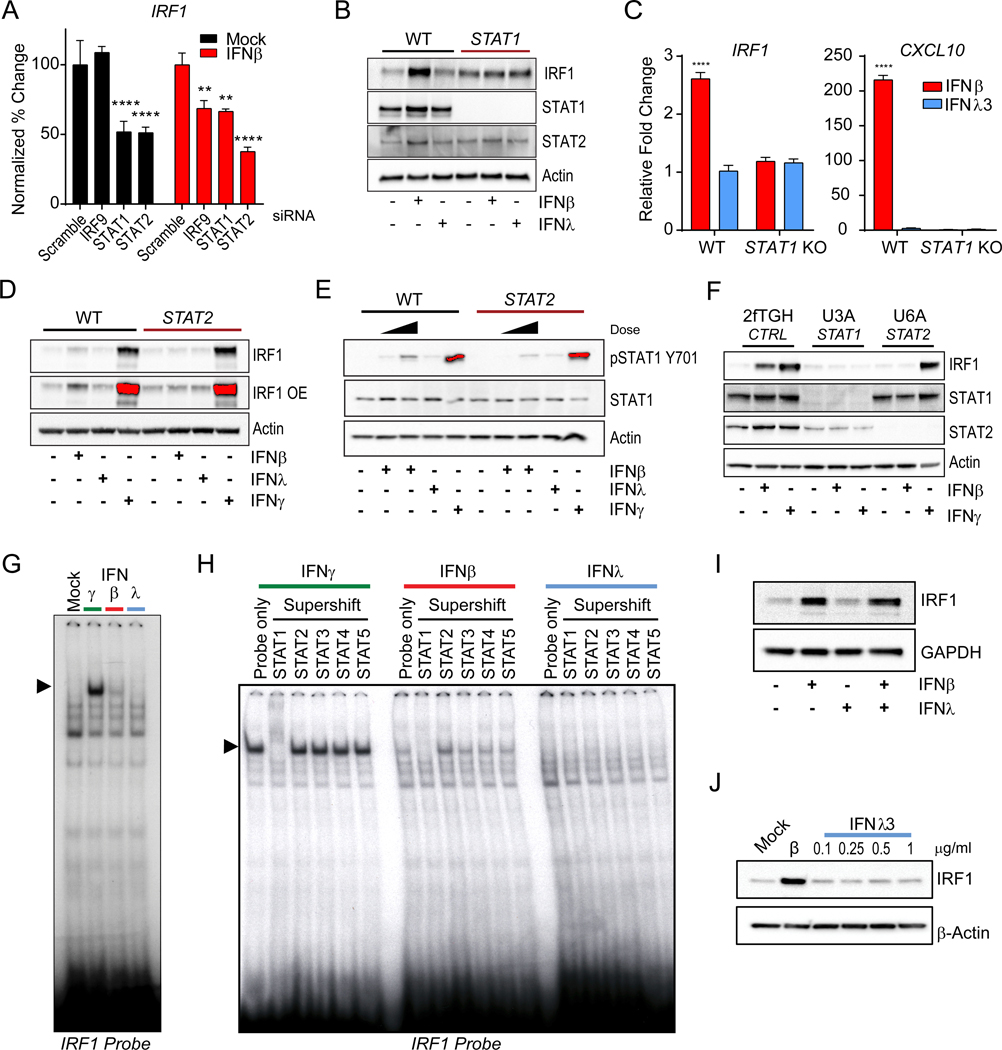
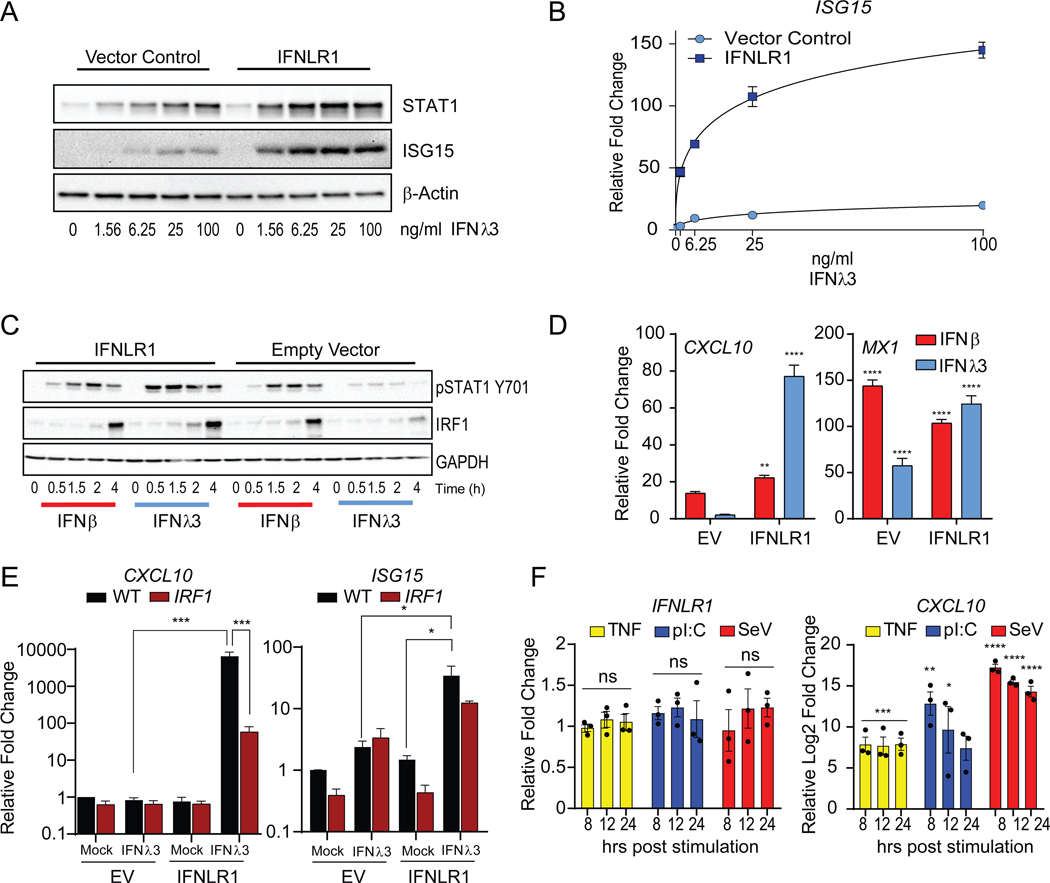
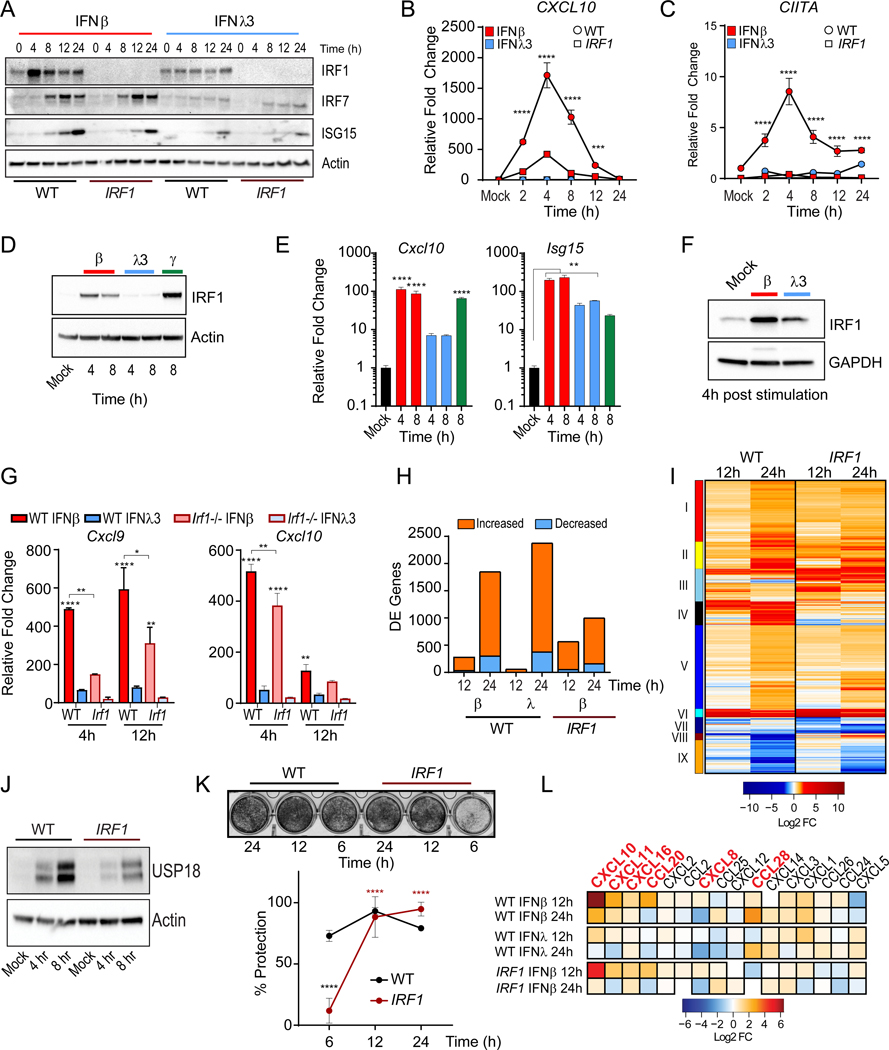
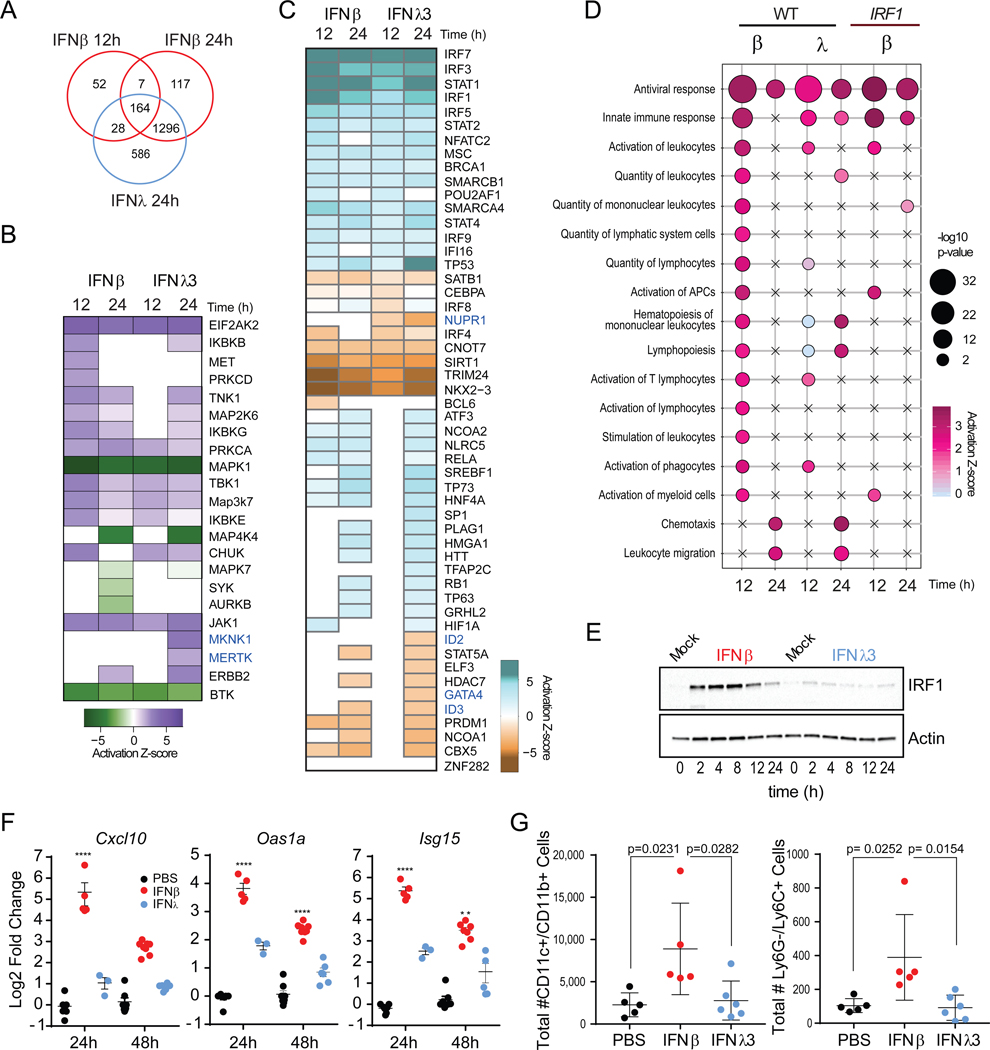
Type I and III interferons (IFNs) activate similar downstream signaling cascades, but unlike type I IFNs, type III IFNs (IFNλ) do not elicit strong inflammatory responses in vivo. Here, we examined the molecular mechanisms underlying this disparity. Type I and III IFNs displayed kinetic differences in expression of IFN-stimulated genes and proinflammatory responses, with type I IFNs preferentially stimulating expression of the transcription factor IRF1. Type III IFNs failed to induce IRF1 expression because of low IFNλ receptor abundance and insufficient STAT1 activation on epithelial cells and thus did not activate the IRF1 proinflammatory gene program. Rather, IFNλ stimulation preferentially induced factors implicated in tissue repair. Our findings suggest that IFN receptor compartmentalization and abundance confer a spatiotemporal division of labor where type III IFNs control viral spread at the site of the infection while restricting tissue damage; the transient induction of inflammatory responses by type I IFNs recruits immune effectors to promote protective immunity.

Keywords: chemokines; epithelial cells; inflammation; interferon lambda; interferon regulatory factor 1; interferons.


Figures

Figure 1 –
Figure 1 –. The antiviral response to IFNλ is delayed relative to IFNβ.
IFN-stimulated gene (ISG) expression following IFN treatment in PH5CH8 cells. (A) Induction of ISG15, MX1, and OAS1 mRNA following IFNβ or IFNλ3 for the indicated times. Mean changes ± SD in gene expression were determined relative to mock-treated cells (value of 1) and normalized to HPRT. (B-C) Immunoblot analysis of ISG15 post IFN treatment. Statistical significance of stimulation and time-dependent gene expression changes were analyzed using two-way ANOVA. (D) EMSA with nuclear extracts from IFNβ or IFNλ3 treated PH5CH8 co-incubated with radiolabeled ISG15 ISRE probe. Data are representative of 2 independent experiments. (E) Violin plots indicate the relative mRNA expression of total RNA (F) and polyribosome associated mRNA across 41 ISGs at the indicated times post IFN-treatment. Statistical significance was determined by Mann-Whitney test. Solid bars indicate the median and quartiles. (G) Heatmap representation of log2 transformed relative expression of individual ISG mRNA after IFN treatment (left) and relative ratio of polysome-bound mRNA (right). Red color indicates increases while blue indicates a decrease in gene expression and polysome association. (H) Assessment of antiviral protection in cells preincubated with IFNβ, IFNλ3, or both for the indicated time prior to infection with VSV at a multiplicity of infection (moi) of 0.1. Schematic of experimental design and representative image of crystal violet uptake assay (top) and quantification of dye-uptake (bottom). Uninfected, untreated cells were used as negative controls (100% protection). Infected, untreated cells served as positive control (no protection). Data represents mean protection across 3 independent experiments ± SEM. Across all experiments, cells were stimulated with 25 IU/ml of IFNβ or 100 ng/ml IFNλ3. Unless otherwise indicated, data is representative of 3 independent experiments. See also Figure S1.
Figure 2 –
Figure 2 –. IRF1 is differentially induced by type I and III IFNs.
(A) Relative gene expression of CXCL9, CXCL10, and CXCL11 mRNA measured by qPCR following IFNβ or IFNλ3 treatments of PH5CH8 cells at the indicated timepoints. Data is representative of means ± SD (B) Average CXCL10 protein production ± SEM after treatment of PH5CH8 cells with IFNβ or IFNλ3 across 2 independent experiments. Statistical significance determined by two-way ANOVA. (C) Immunoblot analysis of IRF1, (D) IRF7 and IRF9 and β-Actin expression after IFN treatment of PH5CH8 cells. (E) Immunoblot analysis of IRF1 and β-Actin expression following stimulation with IFNα2 (250 IU/ml), IFNβ (25 IU/ml) or IFNλ1–3 (100 ng/ml) for 4h in PH5CH8 cells. (F) Average CXCL10 and ISG15 mRNA expression following stimulation with IFNα2 (250 IU/ml), IFNβ (250 IU/ml), or IFNλ1–3 (100 ng/ml) for 4h in PH5CH8 cells across 4 independent experiments ± SEM. (G) Firefly luciferase activity of IRF1 promoter after treatment with IFNβ (25 IU/ml), IFNλ1–3 (100 ng/ml), or IFNγ (5 ng/ml) for 6hrs. Statistical significance was determined using one-way ANOVA. Data represents the mean ± SEM across 5 independent experiments. (H-I) Average relative gene expression changes of IRF1, CXCL10 and CXCL10 of total mRNA (top row) and 4sU labeled newly synthesized mRNA (bottom row) following IFN treatment across 3 independent experiments. Changes in mRNA expression are represented relative to mock-treated cells (value 1) and normalized to HPRT. Unless otherwise indicated, cells were stimulated with 25 IU/ml of IFNβ or 100 ng/ml IFNλ3. Unless otherwise indicated, data is representative of the mean ± SEM across 3 independent experiments. See also Figure S2.
Figure 3 –
Figure 3 –. Robust STAT1 activation is required for the induction of IRF1.
(A) Requirement of ISGF3 complex subunits in the induction of IRF1. PH5CH8 cells transfected with 20nM of IRF9, STAT1, and STAT2-targeting siRNA, or scramble siRNA and mock-treated (black) or IFNβ-treated for 6h. Relative mean ± SD expression changes of IRF1 mRNA is plotted relative to control siRNA transfected cells (100%). (B) Immunoblot IRF1, STAT1, STAT2, and β-Actin following of Wild-type (WT) and STAT1-deficient PH5CH8 cells with IFNβ or IFNλ3 for 4h. (C) Relative mean ± SD gene expression changes of IRF1 and CXCL10 mRNA expression by qPCR following 4h of IFNβ or IFNλ3 treatment. (D) Immunoblot analysis of IRF1 β-Actin following treatment with IFNβ or IFNλ3 or IFNγ in WT and STAT2-deficient PH5CH8 cells. (E) Immunoblot analysis of phosphorylated STAT1 (Y701), total STAT1, and β-Actin in WT and STAT2-deficientPH5CH8 cells treated with IFNβ (25 IU/ml or 250IU/ml), IFNλ3, or IFNγ for 0.5h. (D-E) Saturated pixels are highlighted in red. (F) Immunoblot of IRF1, STAT1, and STAT2 expression in 2fTGH, STAT1-deficient (U3A) and STAT2-deficient (U6A) cells treated with IFNβ (500 IU/ml) or IFNγ for 4h. (G) Electromobility shift assay with nuclear extracts from IFNγ, IFNβ (125 IU/ml), IFNλ3 (500 ng/ml) treated PH5CH8 incubated with radiolabeled IRF1 probe. (H) Supershift EMSA for the identification of transcriptional regulators of IRF1. Nuclear extracts from IFNγ, IFNβ (125 IU/ml), IFNλ3 (500 ng/ml) treated PH5CH8 were co-incubated with radiolabeled IRF1 probe with indicated antibodies. (I) Immunoblot IRF1 and GAPDH analysis expression after treatment of PH5CH8 cells with IFNβ and/or IFNλ3 for 4h. (J) Immunoblot of IRF1 and β-Actin after treatment with IFNβ or increasing concentrations of IFNλ3 for 6h. Changes in mRNA expression are represented relative to mock-treated cells and normalized to HPRT. Unless otherwise indicated, cells were stimulated with 25 IU/ml of IFNβ, 100 ng/ml IFNλ3, or 5ng/ml IFNγ. Unless otherwise indicated, data is representative of 3 independent experiments. See also Figure S3.
Figure 4 –
Figure 4 –. Expression levels of IFNLR1 dictate IRF1 inducibility by IFNλ, treatment.
(A) Immunoblot analysis of total STAT1 and ISG15 expression in IFNLR1 overexpressing Huh7 cells treated with IFNλ3 at the indicated doses for 24h. (B) Relative gene expression changes of ISG15 mRNA in IFNLR1 overexpressing cells treated with IFNλ3 at the indicated doses for 24h by qPCR. (C) Immunoblot analysis of STAT1 phosphorylated STAT1 (Y701), IRF1, and GAPDH in IFNLR1-overexpressing cells (IFNLR1; left) and control cells (Empty vector; right) stimulated with IFNβ or IFNλ3 for 0.5, 1.5, 2 and 4h. (D) Relative mean ± SD gene expression changes of CXCL10 and MX1 mRNA following 4h treatment with IFNβ or IFNλ3 in IFNLR1 overexpressing cells by qPCR. (E) Relative mean ± SD gene expression changes of CXCL10 and ISG15 mRNA in IFNLR1 overexpressing Wild-type (black) and IRF1-deficient (red) PH5CH8 cells treated with IFNλ3 for 4h by qPCR. (F) Average of the relative gene expression changes of IFNLR1 and CXCL10 mRNA in PH5CH8 cells stimulated with TNFα (10 ng/ml), poly I:C (2 μg/ml), or Sendai virus (SeV; 50 HAU/ml) for the indicated timepoints across 3 independent experiments mean ± SEM. Changes in mRNA expression are represented relative to mock-treated cells and normalized to HPRT. Unless otherwise indicated, cells were stimulated with 25 IU/ml of IFNβ or 100 ng/ml IFNλ3. Unless otherwise indicated, data is representative of 3 independent experiments. See also Figure S4.
Figure 5 –
Figure 5 –. Central role of IRF1 in the response to IFN treatment.
(A) Immunoblot of IRF1, IRF7, ISG15, and Actin expression in WT and IRF1-deficient cells PH5CH8 treated with IFNβ or IFNλ3. (B-C) qPCR analysis of mean ± SD CXCL10 and CIITA mRNA expression in WT (circle) or IRF1-deficient cells (square) after IFNβ or IFNλ3 treatment for the indicated times. (B) Immunoblot analysis of IRF1 expression in immortalized murine small intestinal epithelial cells (IEC) treated with murine IFNβ (100 IU/ml), murine IFNλ3 (100 ng/ml) or murine IFNγ for 3 and 8h. (E) Relative gene expression changes of Cxcl10 and Isg15 mRNA in IEC treated with IFN as indicated above. (F) Immunoblot analysis of IRF1 expression in small intestine crypt-derived organoids stimulated with murine IFNβ (50 IU/ml) or murine IFNλ3 (200 ng/ml) for 4h. (G) Relative gene expression changes of Cxcl9 and Cxcl10 mRNA in IFN-treated organoids derived from WT or Irf1−/− mice, at 4h or 12h post stimulation. (H) Relative mean ± SD mRNA expression is normalized to Actin control. (H) Quantification of differentially expressed (DE) genes in PH5CH8 WT or IRF1-deficient PH5CH8 cells treated with IFNβ or IFNλ3 relative to genotype-matched untreated cells. DE cutoffs were set at a log2 fold change of |1| and a Benjamini-Hochberg adjusted p-value < 0.01. (I) Hierarchical clustering of 2402 DE genes following IFNβ treatment of WT or IRF1-deficient cells based on Euclidean distances. (J) Immunoblot analysis of USP18 protein IFNβ treatment of WT and IRF1-deficient PH5CH8 cells. (K) IFN-mediated protection against VSV-induced CPE (moi = 1) in WT and IRF1-deficient PH5CH8 cells pre-treated with IFNβ for 6, 12, or 24h prior to infection (top). Quantification of mean ± SEM dye uptake across 3 experiments 24h post infection (bottom). Black asterisks indicate significant differences between WT and IRF1-deficient cells and red asterisks indicate significant changes within the IRF1-deficient group. (L) Chemokines gene expression in our RNA-seq dataset. Genes highlighted in red are preferentially induced by IFNβ. Changes in mRNA expression are represented relative to mock-treated cells and normalized to HPRT. Unless otherwise indicated, cells were stimulated with 25 IU/ml of IFNβ or 100 ng/ml IFNλ3. Unless otherwise indicated, data is representative of 3 independent experiments. See also Figure S5 and Table S1.
Figure 6 –
Figure 6 –. Type I, but not type III IFNs promote immune cell recruitment into the lung.
(A) Intersection of IFNβ and IFNλ3 responsive genes in PH5CH8 WT cells. (B) Predicted activation state of kinases significantly associated transcriptional changes after IFNβ or IFNλ3 treatment using IPA. Color indicates predicted activation (purple)or predicted inhibition (green). (C) Predicted activation state of transcription factors found to be significantly associated with transcriptional changes after IFNβ or IFNλ3 treatment using IPA. Color indicates predicted activation (blue) or predicted inhibition (brown). (D) Bubble plot representation of significantly enriched biological functions in IFN-treated cells using IPA. Bubble color represents activation z-scores and bubble size represents the -log10 p-value of enrichment. Statistical significance was determined by an activation z-score > |2| and a -log10 p-value > 1.32, which correspond to a p-value of 0.05. Increases in -log10 p-value are indicative of increased statistical significance. (E) Immunoblot analysis of IRF1 in A549 cells treated with IFNβ (25 IU/ml) or IFNλ3 (100 ng/ml) over time. (F) Quantification of pulmonary expression of Cxcl10, Oas1a, and Isg15 mRNA following inoculation with murine IFNβ (2μg) or murine IFNΑ3 (4μg) relative to Actin control. (G) Quantification of immune cells in BAL of IFN-treated mice at 48h post-treatment. Unless otherwise indicated, data is representative of mean ± SEM of 3 independent experiments. See also Figure S6.

Comment in

References

    1. Ank N, Iversen MB, Bartholdy C, Staeheli P, Hartmann R, Jensen UB, Dagnaes-Hansen F, Thomsen AR, Chen Z, Haugen H, et al. (2008). An important role for type III interferon (IFN-lambda/IL-28) in TLR-induced antiviral activity. J Immunol 180, 2474–2485. - PubMed
    1. Baldridge MT, Lee S, Brown JJ, McAllister N, Urbanek K, Dermody TS, Nice TJ, and Virgin HW (2017). Expression of Ifnlr1 on Intestinal Epithelial Cells Is Critical to the Antiviral Effects of Interferon Lambda against Norovirus and Reovirus. J Virol 91. - PMC - PubMed
    1. Bhushal S, Wolfsmuller M, Selvakumar TA, Kemper L, Wirth D, Hornef MW, Hauser H, and Koster M. (2017). Cell Polarization and Epigenetic Status Shape the Heterogeneous Response to Type III Interferons in Intestinal Epithelial Cells. Front Immunol 8, 671. - PMC - PubMed
    1. Billiau A, and Matthys P. (2009). Interferon-gamma: a historical perspective. Cytokine Growth Factor Rev 20, 97–113. - PubMed
    1. Blumer T, Coto-Llerena M, Duong FHT, and Heim MH (2017). SOCS1 is an inducible negative regulator of interferon lambda (IFN-lambda)-induced gene expression in vivo. J Biol Chem 292, 17928–17938. - PMC - PubMed

Publication types