. 2019 Sep 11;26(3):347-358.e7.
doi: 10.1016/j.chom.2019.08.003. Epub 2019 Aug 27.

HIV Rebound Is Predominantly Fueled by Genetically Identical Viral Expansions from Diverse Reservoirs

Affiliations

HIV Rebound Is Predominantly Fueled by Genetically Identical Viral Expansions from Diverse Reservoirs

Marie-Angélique De Scheerder et al. Cell Host Microbe. .

Abstract

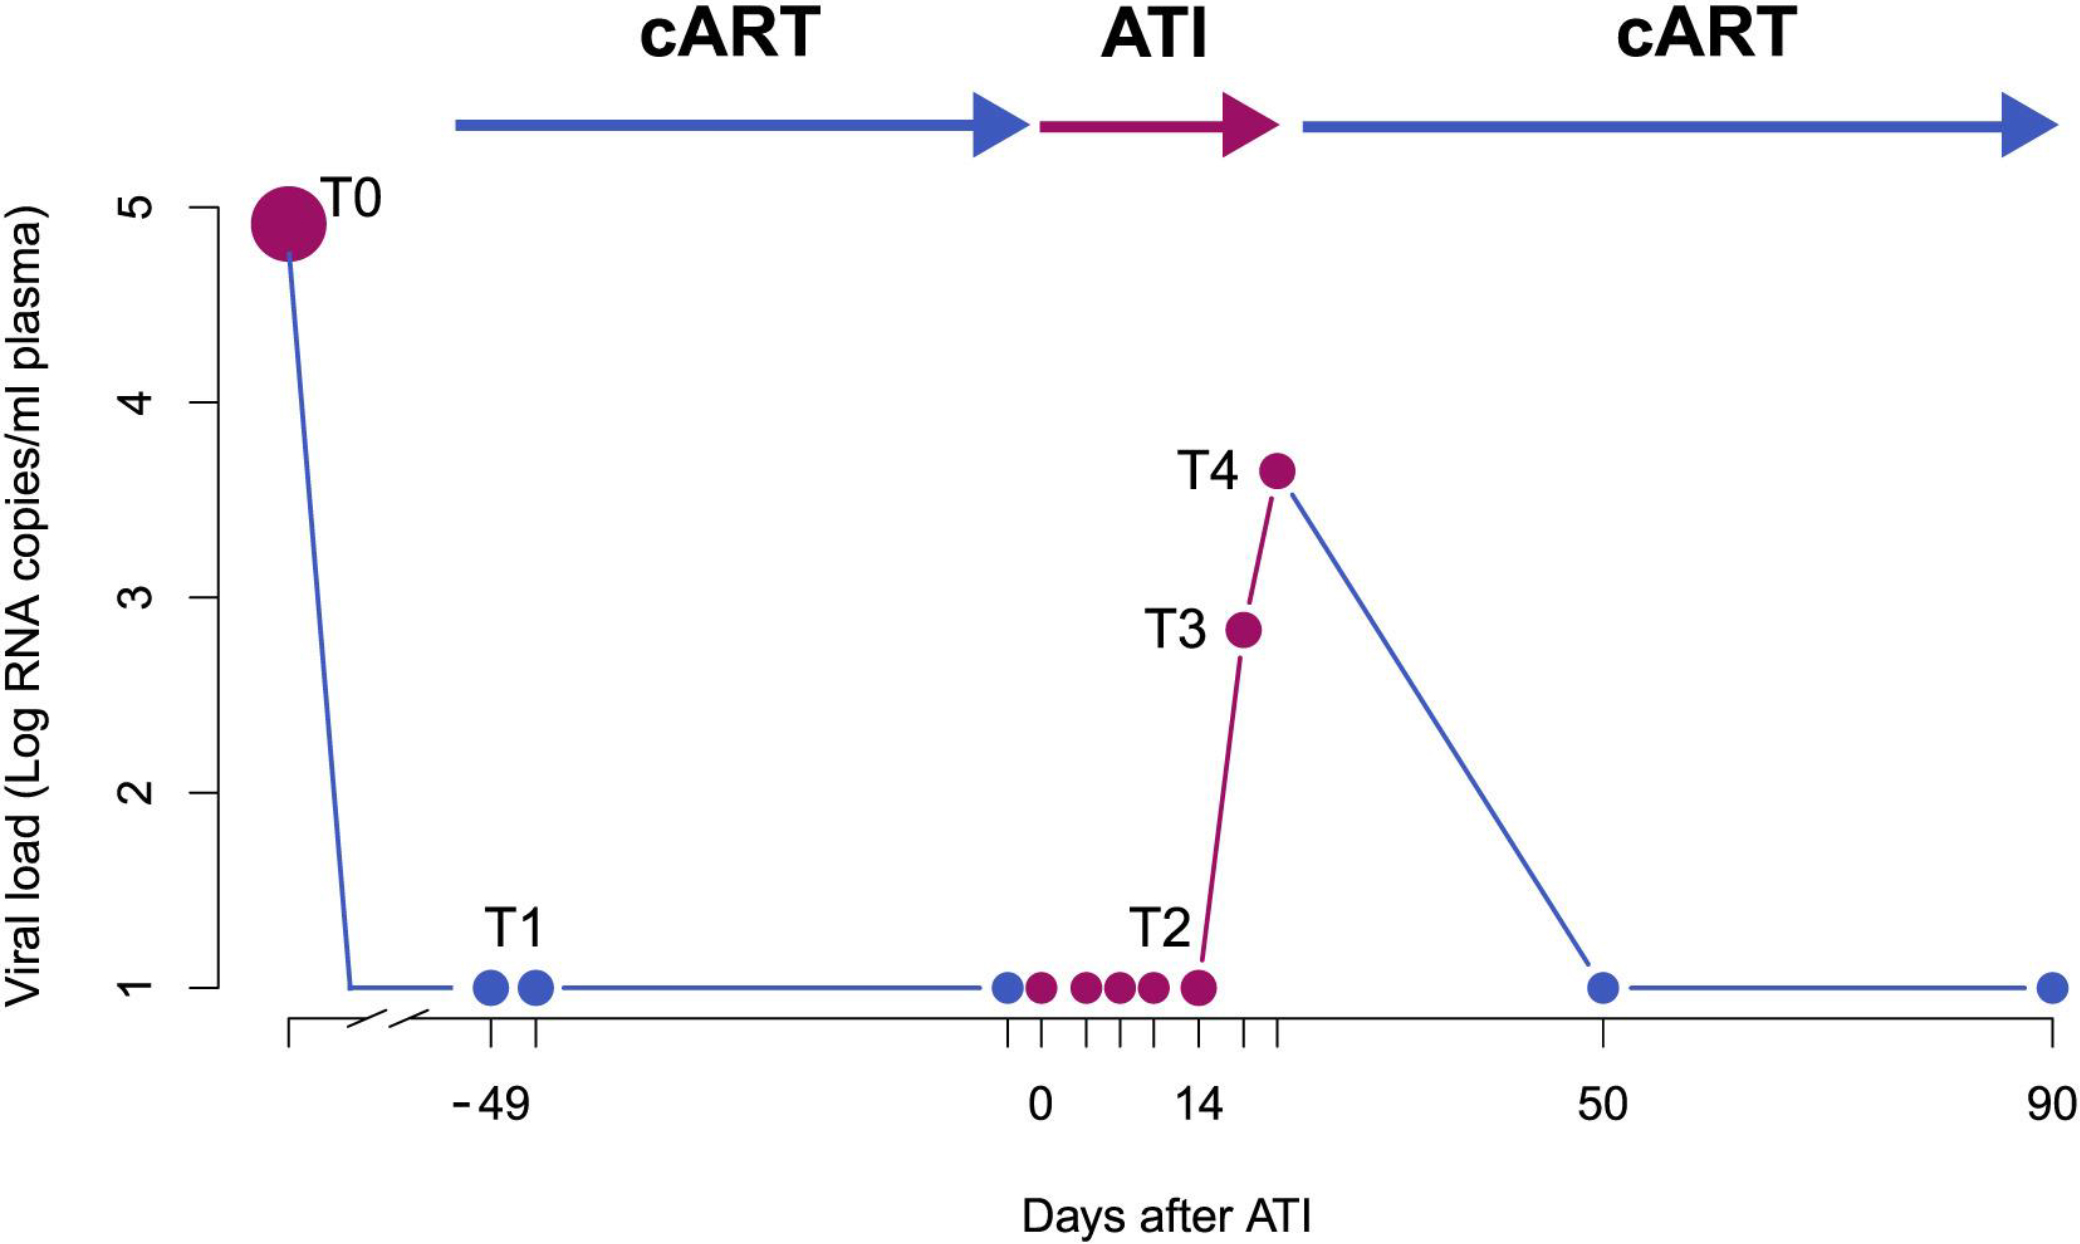
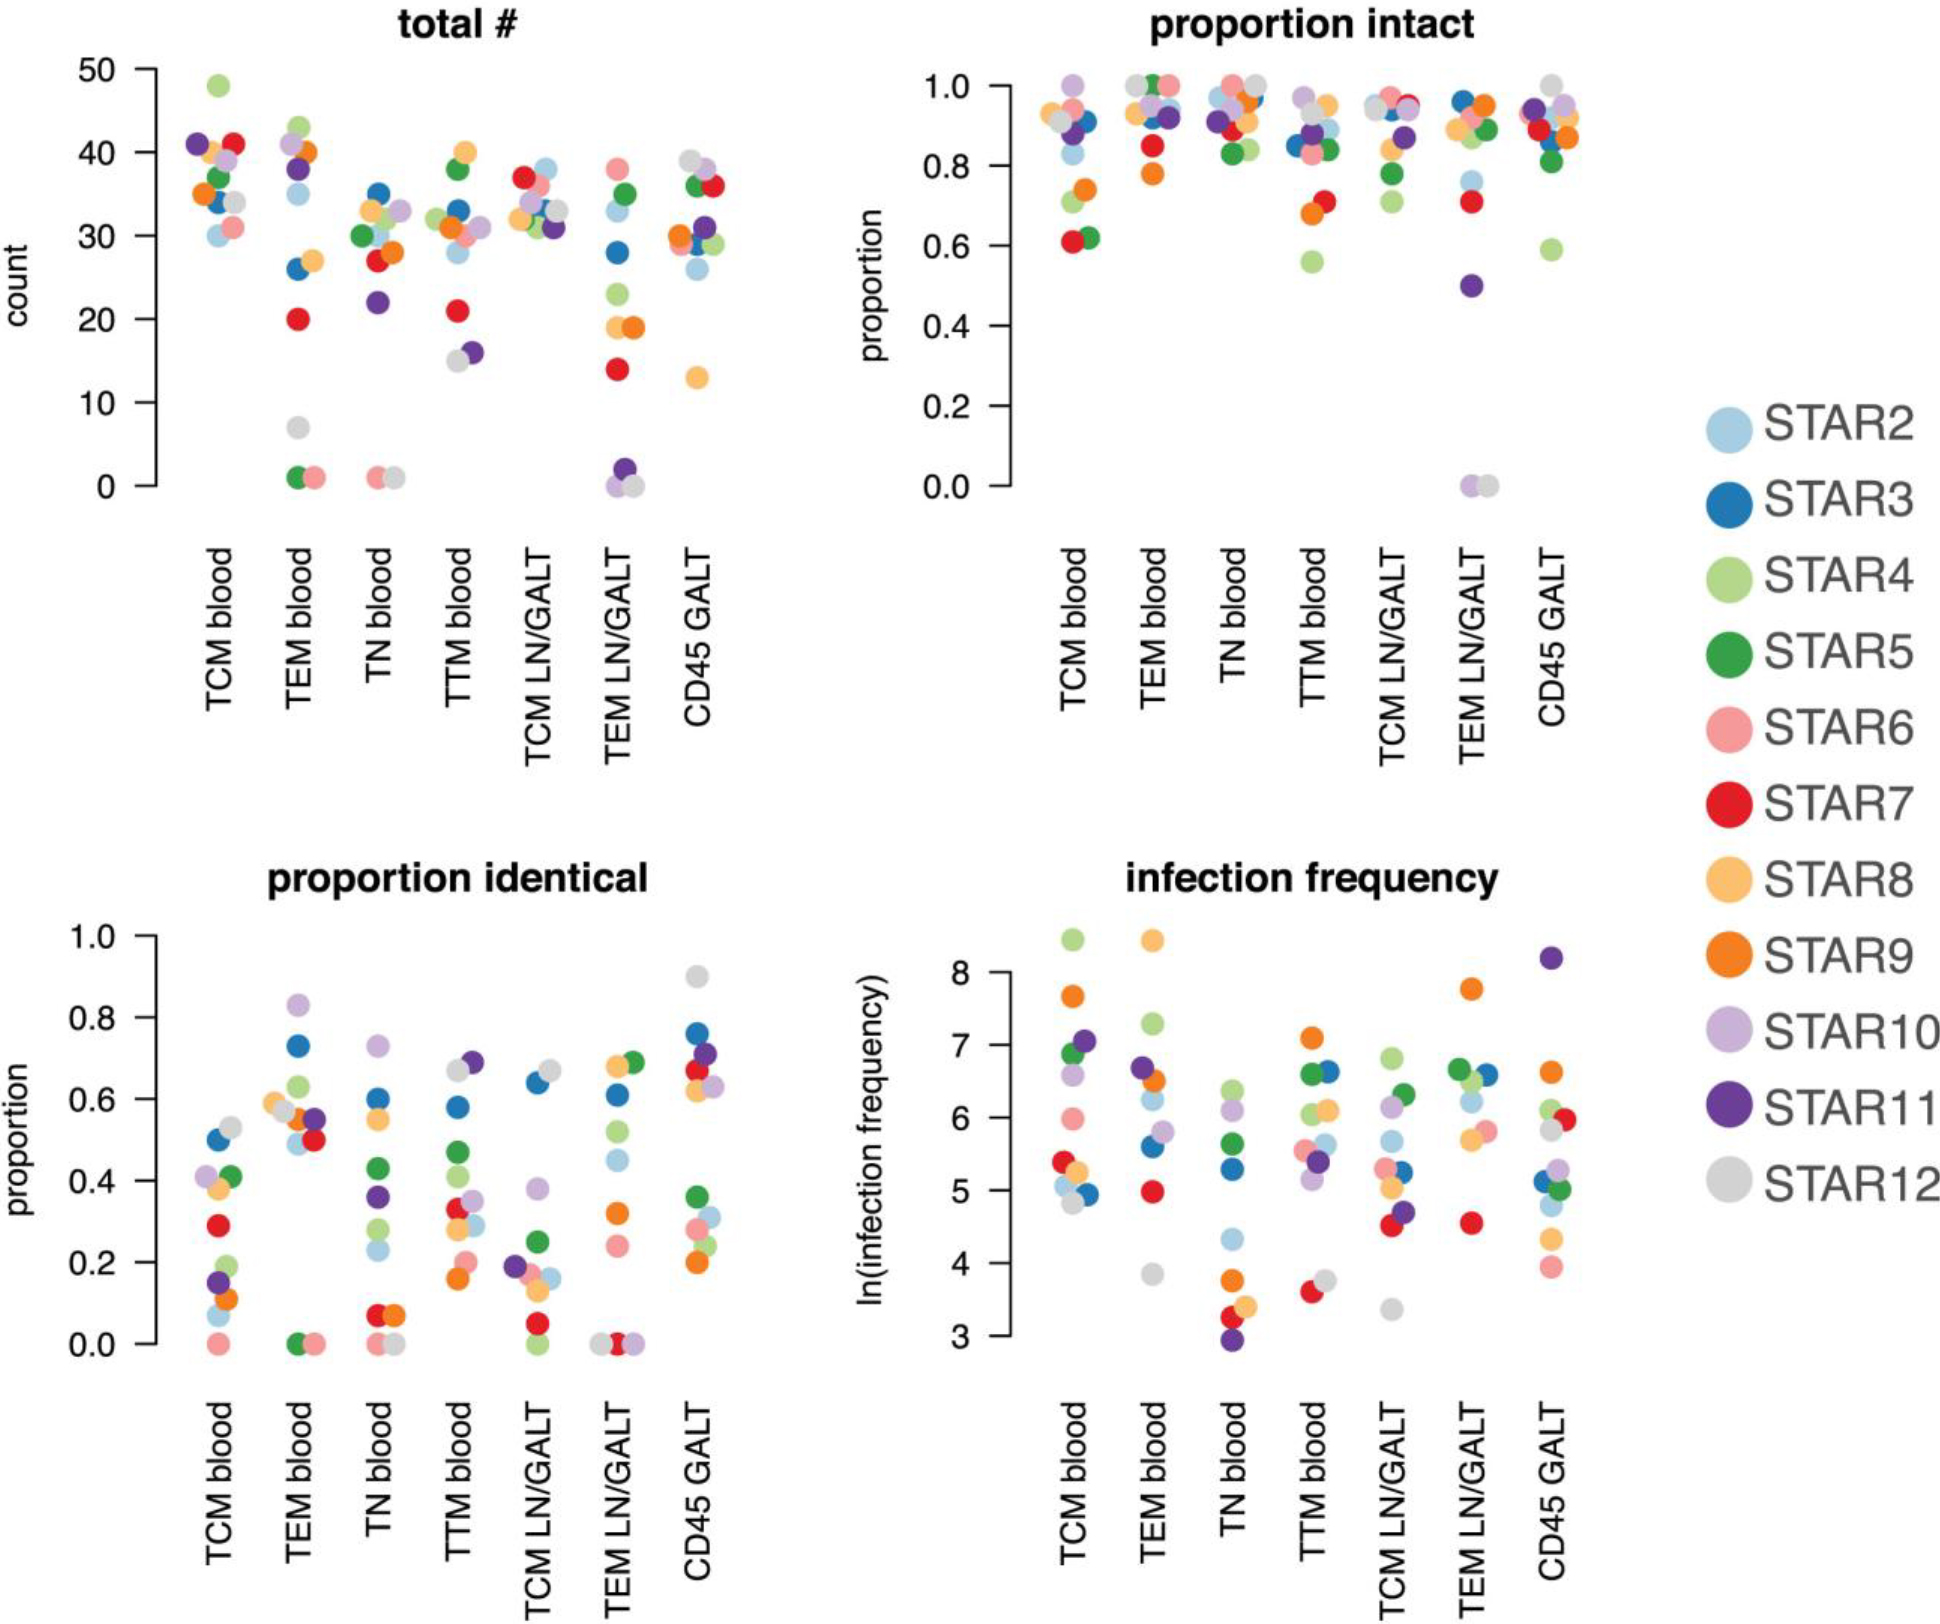
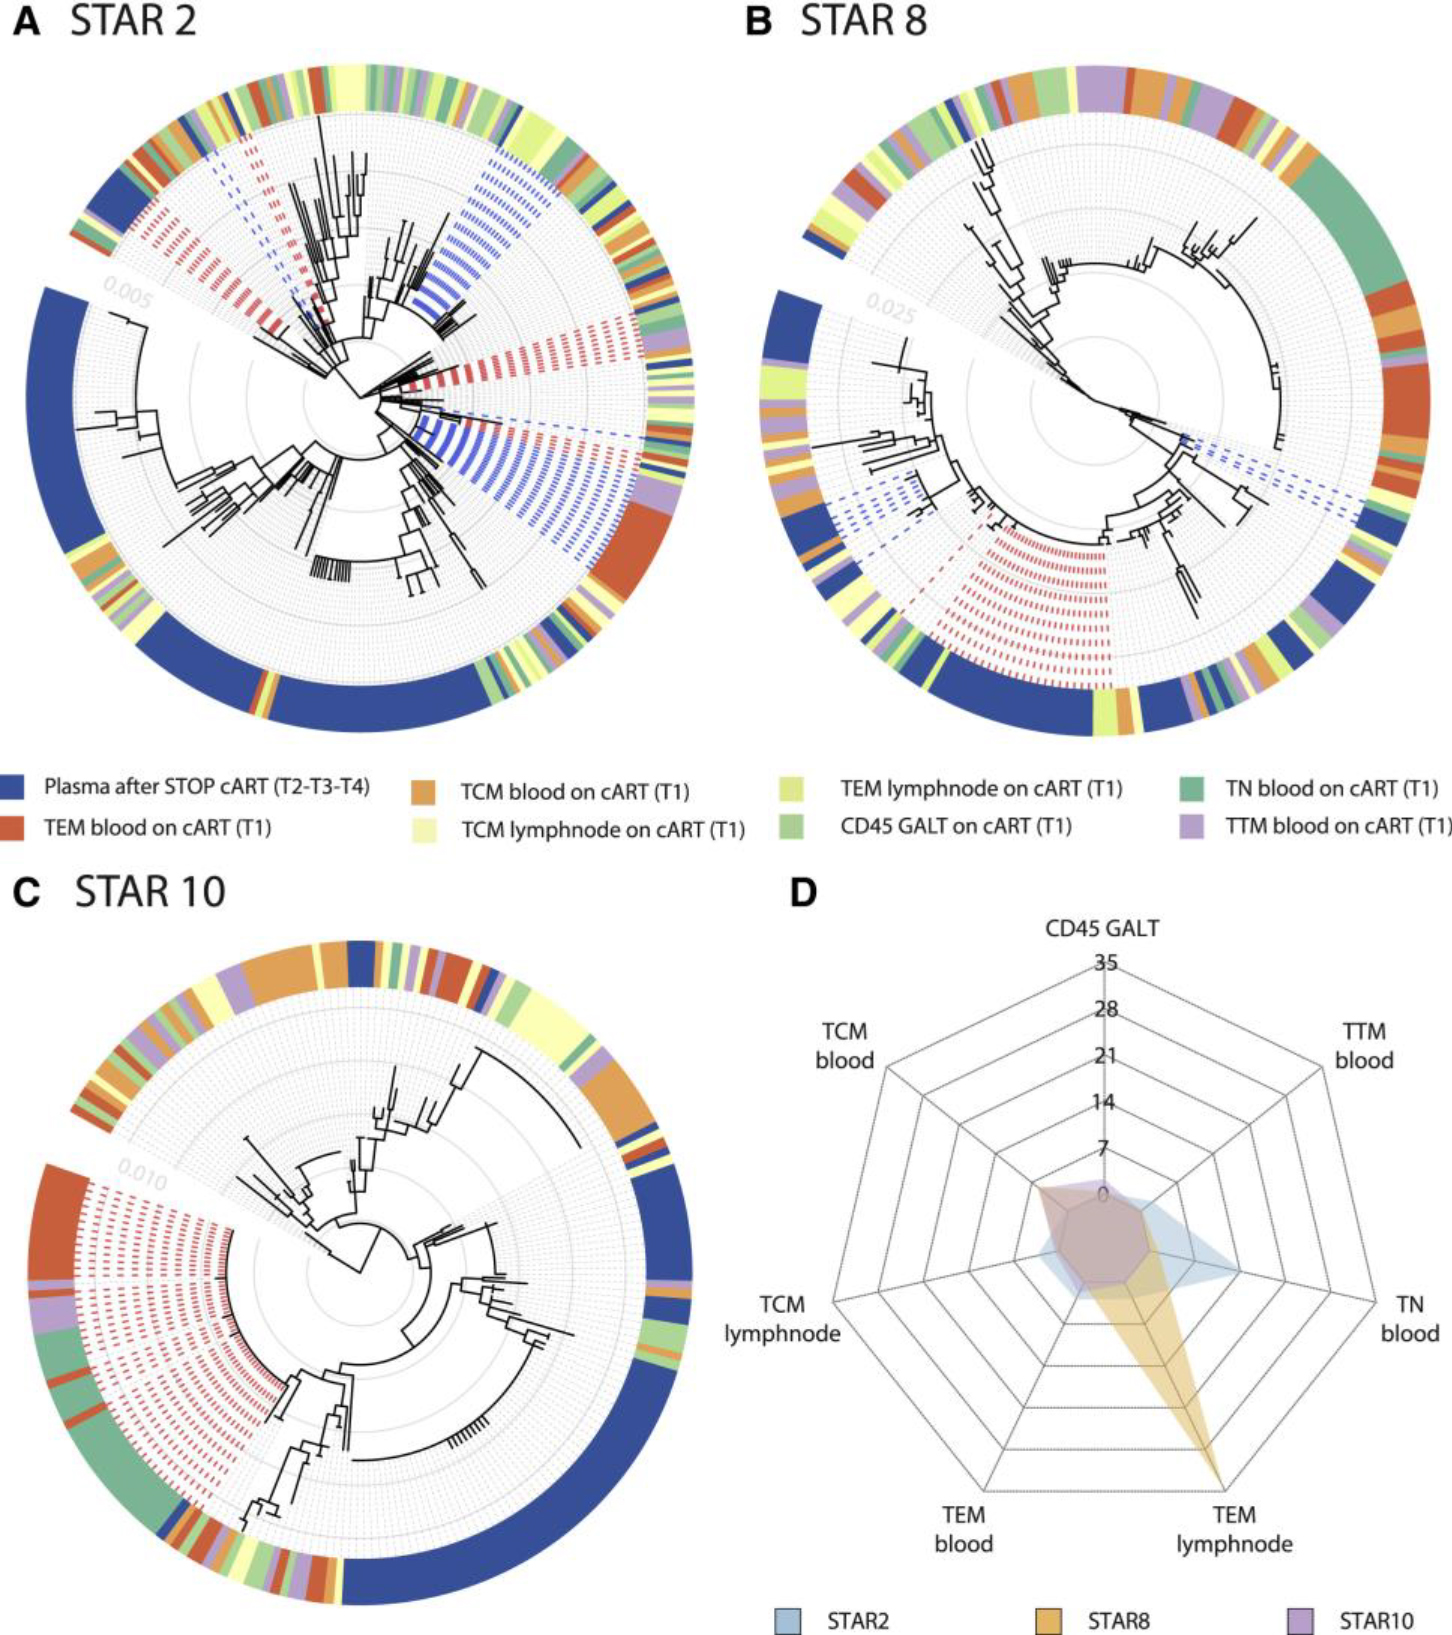
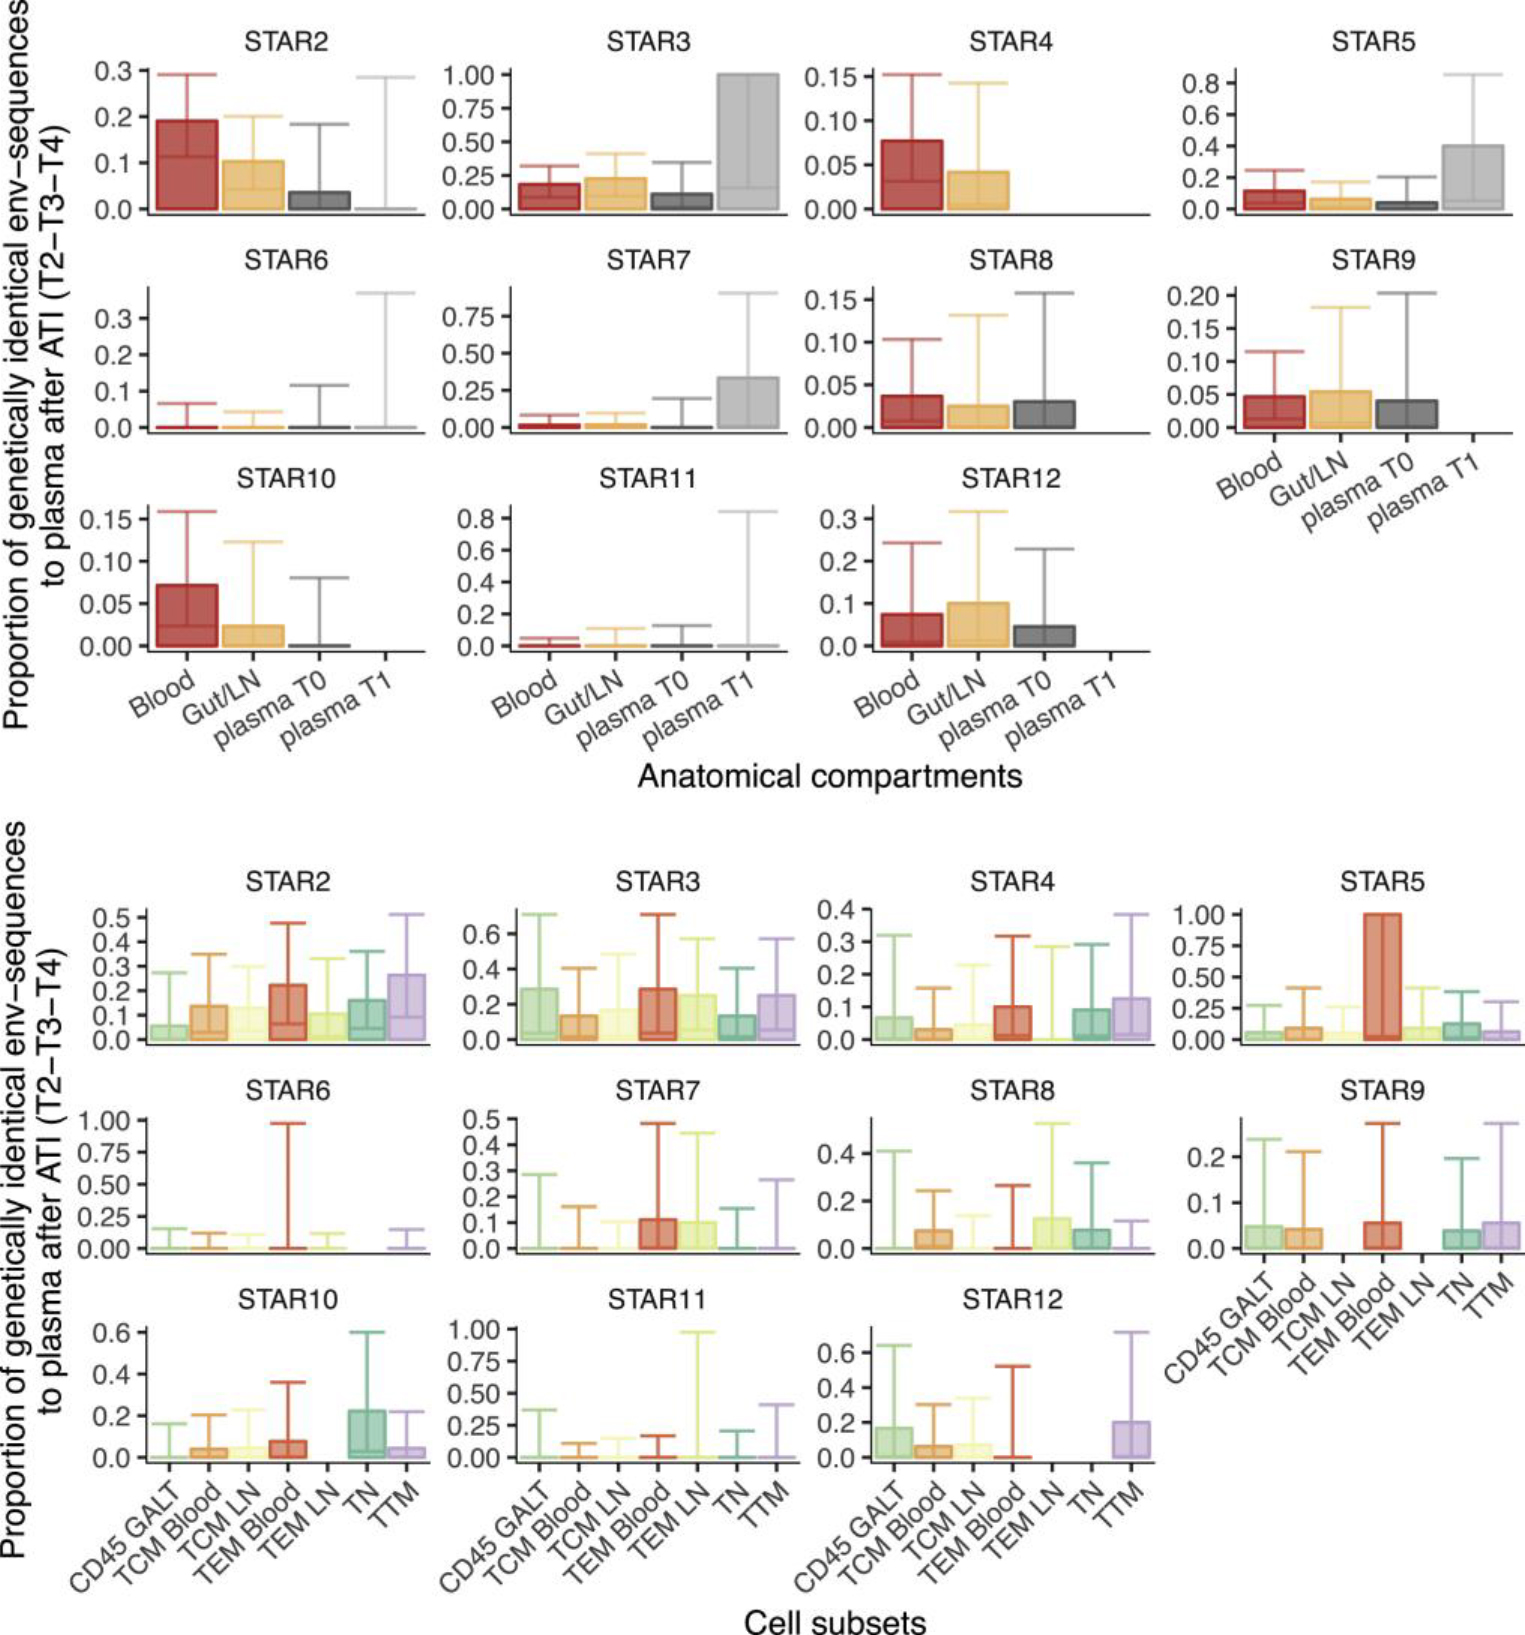
Viral rebound upon stopping combined antiretroviral therapy poses a major barrier toward an HIV cure. Cellular and anatomical sources responsible for reinitiating viral replication remain a subject of ardent debate, despite extensive research efforts. To unravel the source of rebounding viruses, we conducted a large-scale HIV-STAR (HIV-1 sequencing before analytical treatment interruption to identify the anatomically relevant HIV reservoir) clinical trial. We collected samples from 11 participants and compared the genetic composition of (pro)viruses collected under treatment from different cellular and anatomical compartments with that of plasma viruses sampled during analytical treatment interruption. We found a remarkably heterogeneous source of viral rebound. In addition, irrespective of the compartment or cell subset, genetically identical viral expansions played a significant role in viral rebound. Our study suggests that although there does not seem to be a primary source for rebound HIV, cellular proliferation is an important driver of HIV persistence and should therefore be considered in future curative strategies.

Keywords: HIV persistence; HIV rebound; HIV-1 reservoir; analytical treatment interruption; cellular and anatomical compartments; cellular proliferation; cure research; in-depth sampling; single-genome sequencing.


Conflict of interest statement

DECLARATION OF INTERESTS

The authors declare no competing interests.

Figures

Figure 1.
Figure 1.. In-Depth HIV Sampling before and during ATI.
T1 represents the sampling under cART, including tissue sampling and leukapheresis within the same week; upon ATI (day 0 on the x axis), blood samples were taken every 2–3 days. T2 represents the time point of leukapheresis after ATI (8–15 days after day 0); T3 represents the first detectable viral load (>30 copies/mL) and T4 is defined as the time of viral rebound (>1,000 copies/mL or at second measurement of >200 copies/mL). Treatment was re-initiated immediately after the sampling at T4 and participants were intensively monitored until undetectable viral load in plasma was achieved (<20 copies/mL). T0 represents the time of plasma sampling prior to initial treatment initiation. The dots represent the sampling points on cART (blue), off cART (pink).
Figure 2.
Figure 2.. Scatter Dot Plot Representing the Data from Table 1, Sorted by Cell Subset
The y axis respectively shows the total N of sequences, the proportion of intact and identical sequences and the log-transformed infection frequency. The legend indicates the color used for each participant.
Figure 3.
Figure 3.. Heterogeneous Cellular and Anatomical Reservoir Contributions to HIV Rebound with Cellular Proliferation as a Potential Driver.
Within-host ancestor-descendant relationships between the viruses from different cell types for 3 participants and a radar plot representing the variability in viral rebound source. (A–C) Maximum likelihood phylogenetic trees from three selected participants representing the sequences from T1 cell subsets from blood (TCM, TEM, TTM, and TN), LN (TCM and TEM), and GALT (CD45+ cells) before ATI. Plasma viruses from time points T2, T3, and T4 are grouped as plasma after STOP cART. The colored strip represents sampling origin for each sequence as indicated by the legend. The trees are drawn to scale and the gray circles represent the branch length from the root expressed as the number of substitutions per site. The scale values are given in the inset (light gray numbers). The heterogeneity in potential reservoir contribution is indicated by the color mixing in the strip. Identical cellular DNA V1–V3 sequence expansions that are identical to plasma RNA sequences after cART STOP were highlighted in the trees by the bold dashed lines, with the expansions colored in red and blue alternatingly. Trees from all participants are provided in Figure S1. (D) The radar plot representing, for each of the 3 participants, the estimated number of times that a rebound virus lineage originates from the respective cell subsets (depicted as the numbers from 0 to 35). The legend indicates the color used for each participant. A radar plot across all participants is available in Figure S4.
Figure 4.
Figure 4.. Contributions of Anatomical and Cellular Compartments to Viral Rebound.
(A) Bar plots representing the proportion of env sequences from anatomical compartments T1 and plasma T0/T1 (x axis) genetically identical to plasma viruses collected after ATI (T2-T3-T4 combined) (y axis). Sequences obtained from LN and GALT were pooled together. Compartments were compared with T0 and T1 plasma-derived env sequences. Data were normalized for genetically identical expansions. Error bars represent the confidence intervals (CIs). When CIs are presented without bar, this means that we obtained sequences but none were identical. The absence of bars or CIs reflects that this particular data point was missing or we obtained too few sequences (<5) to include it in the analysis. (B) Bar plots from STAR 2–>12 representing the proportion of proviral env sequences genetically identical to plasma virus after ATI (T2-T3-T4 combined) (y axis) between the different cell subsets (x axis). The data were normalized for genetically identical expansions within the subsets. Error bars represent the CIs. When CIs are presented without bar, this means that we obtained sequences, but none were identical. The absence of bars or CIs reflects that this particular data point was missing or we obtained too few sequences (<5) to include it in the analysis.
Figure 5.
Figure 5.. Evidence for Kinetic Variability and Stochastic Reactivation of Rebound Viruses after Treatment Interruption.
(A–D) Within-host ancestor-descendant relationships between the viruses from different anatomical compartments and the RNA plasma sequences collected at different time points for 3 participants and nucleotide diversity estimates. Shown are maximum likelihood phylogenetic trees highlighting the sequences obtained from plasma RNA at the different time points of sequencing T0, T1, T2, T3, and T4. (A) represents STAR 2 where the red dashed lines represent the many different plasma virus lineages detected at T1, consisting of mostly unique sequences. (B) represents STAR 3 with the green dashed lines representing identical plasma virus expansions at T1 that are identical to plasma viruses collected at later time points T2 and T3 (indicated in purple). The red dashed lines represent proviruses from the reservoir that are identical to sequences found in the plasma at T2 and T3 (indicated in purple and light blue). The blue dashed lines represent T4 rebound viruses, for which the link with the proviral reservoir is less likely in this participant than at T2 and T3. The orange dashed lines show a single rebound virus collected at T4 that is identical to a provirus from GALT. (C) represents STAR 10 where the red dashed lines represent the typical clustering of rebound viruses at T2, T3, and T4 as observed for most participants. The blue dashed lines represent a T4 rebound sequence with identical proviruses from several cell subsets but not observed earlier in the plasma at T2/T3. The green dashed line shows how expansions of virus at T0 persist over time in the reservoir. The total number of rebound events is approximated by the number of “blue blocks” (i.e., closely related rebound viruses) in the colored circle surrounding to the phylogenies, as these usually correspond to a single rebound event from the reservoir. However, when identical rebound viruses are also identical to a reservoir virus, that particular reservoir origin will be the most likely inferred state at the parental node of the terminal branches leading to these identical rebound sequences. We mark such lineages that are estimated to have arisen through multiple rebound events with an asterisk. Trees from all participants are provided in Figure S1B. (D) represents for these participants various levels of nucleotide diversity (y axis) in the different compartments and plasma time points (x axis). Nucleotide diversity for all particants is available in Figure S3.

References

    1. Abascal F, Zardoya R, and Telford MJ (2010). TranslatorX: multiple alignment of nucleotide sequences guided by amino acid translations. Nucleic Acids Res. 38, W7–w13. - PMC - PubMed
    1. Bandelt HJ, Forster P, and Röhl A (1999). Median-joining networks for inferring intraspecific phylogenies. Mol. Biol. Evol. 16, 37–48. - PubMed
    1. Banga R, Procopio FA, Noto A, Pollakis G, Cavassini M, Ohmiti K, Corpataux JM, de Leval L, Pantaleo G, and Perreau M (2016). PD-1(+) and follicular helper T cells are responsible for persistent HIV-1 transcription in treated aviremic individuals. Nat. Med. 22, 754–761. - PubMed
    1. Banga R, Procopio FA, Ruggiero A, Noto A, Ohmiti K, Cavassini M, Corpataux JM, Paxton WA, Pollakis G, and Perreau M (2018). Blood CXCR3(+) CD4 T cells are enriched in inducible replication competent HIV in aviremic antiretroviral therapy-treated individuals. Front. Immunol. 9, 144. - PMC - PubMed
    1. Barton K, Hiener B, Winckelmann A, Rasmussen TA, Shao W, Byth K, Lanfear R, Solomon A, McMahon J, Harrington S, et al. (2016). Broad activation of latent HIV-1 in vivo. Nat. Commun. 7, 12731. - PMC - PubMed

Substances