. 2019 Oct 16;133(5):jcs232991.
doi: 10.1242/jcs.232991.

Differential nanoscale organisation of LFA-1 modulates T-cell migration

Affiliations

Differential nanoscale organisation of LFA-1 modulates T-cell migration

Michael J Shannon et al. J Cell Sci. .

Abstract

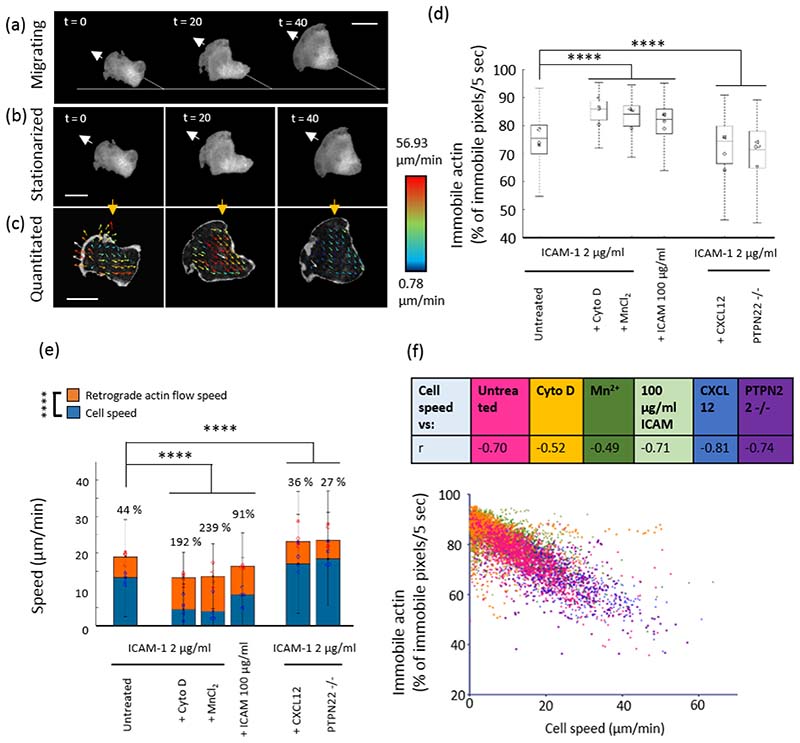
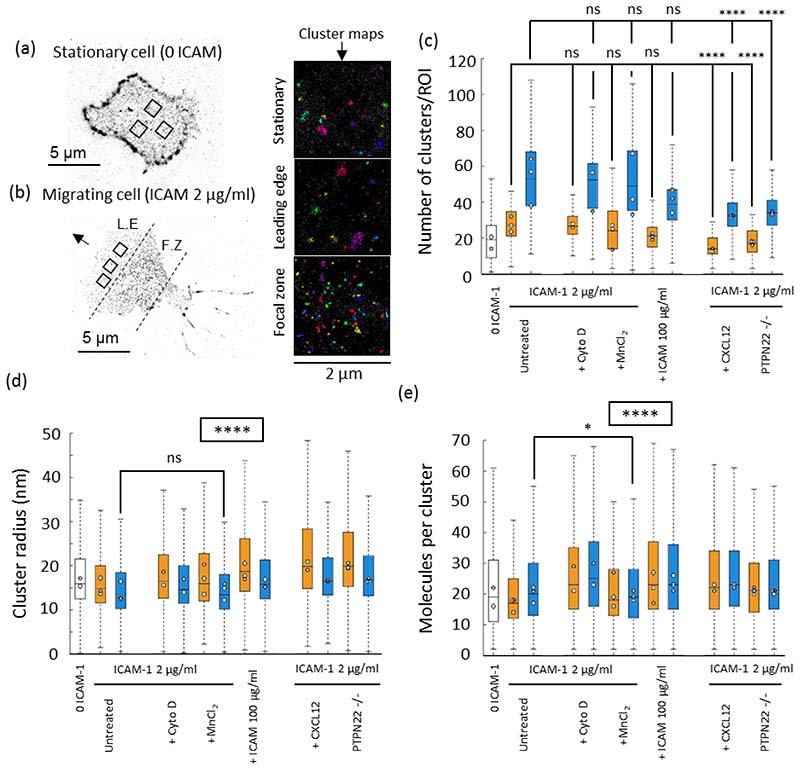
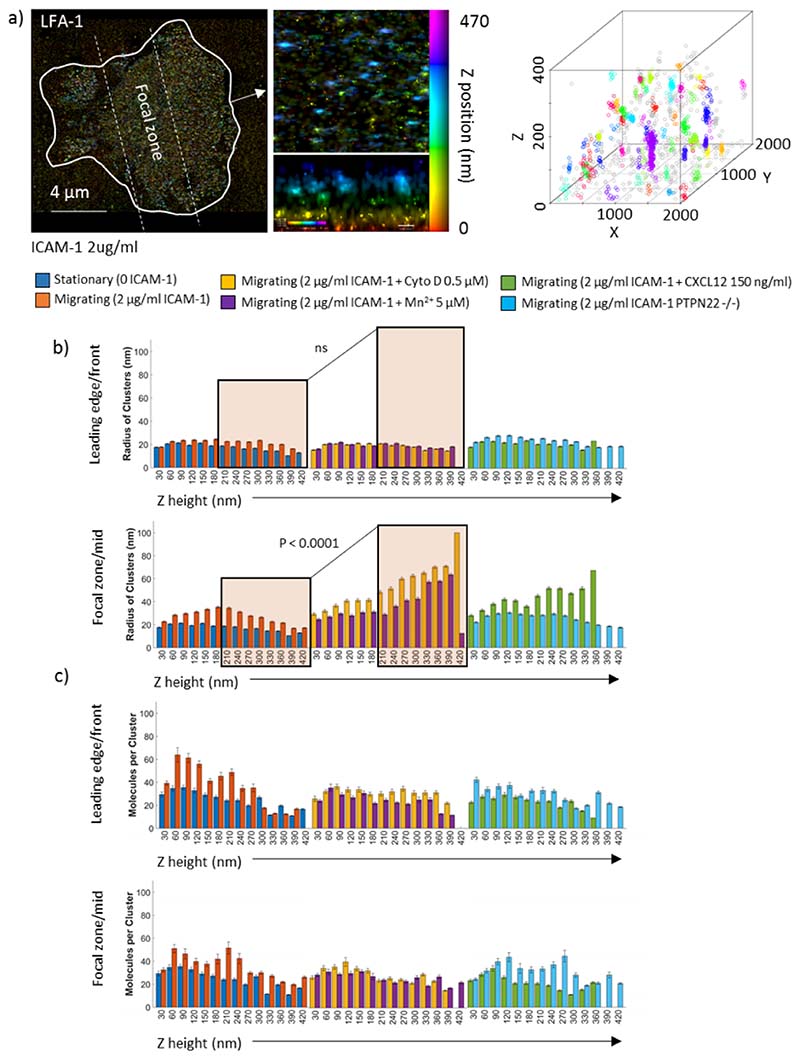
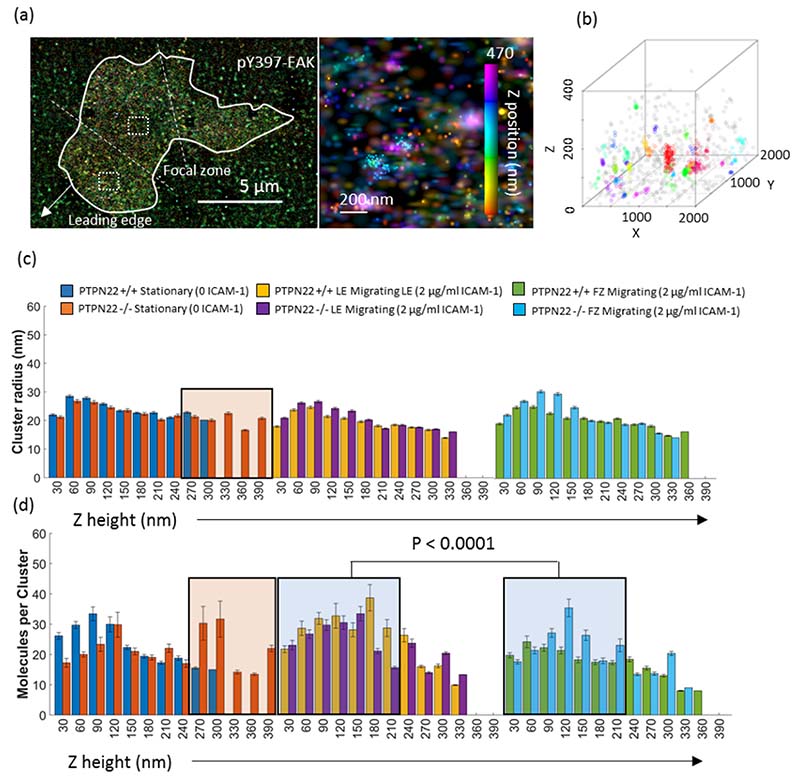
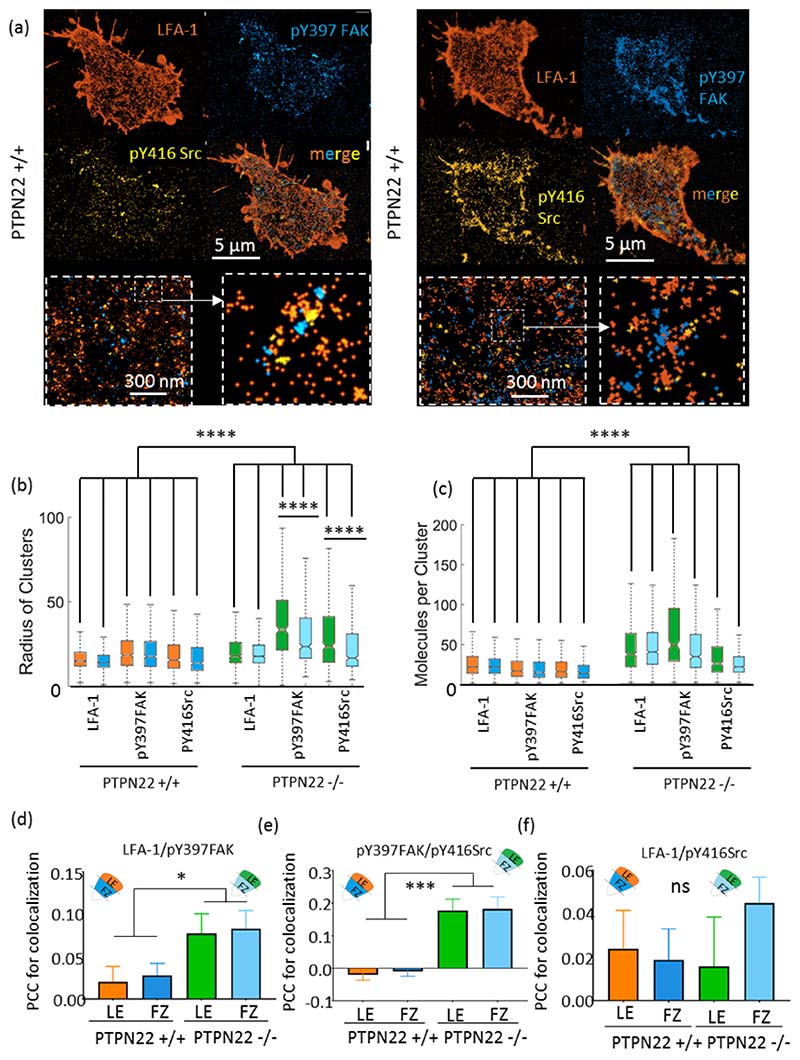
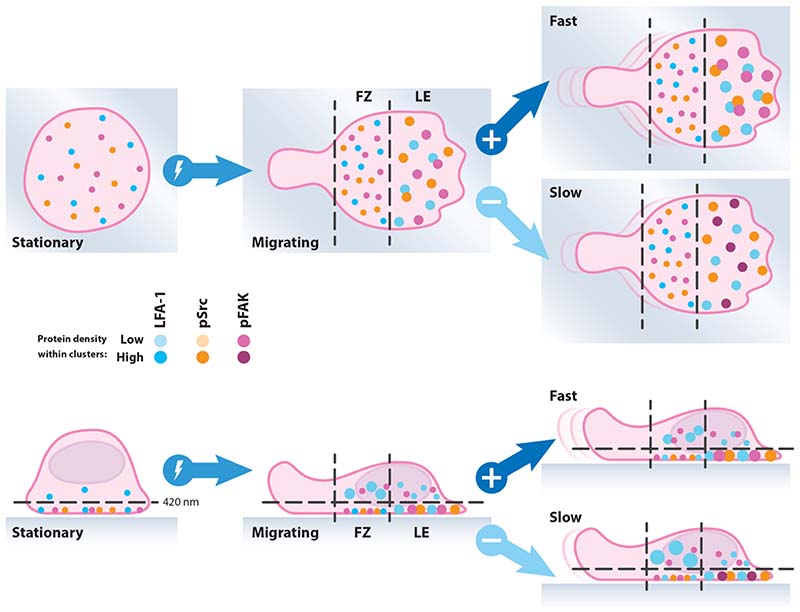
Effector T-cells rely on integrins to drive adhesion and migration to facilitate their immune function. The heterodimeric transmembrane integrin LFA-1 (αLβ2 integrin) regulates adhesion and migration of effector T-cells through linkage of the extracellular matrix with the intracellular actin treadmill machinery. Here, we quantified the velocity and direction of F-actin flow in migrating T-cells alongside single-molecule localisation of transmembrane and intracellular LFA-1. Results showed that actin retrograde flow positively correlated and immobile actin negatively correlated with T-cell velocity. Plasma membrane-localised LFA-1 forms unique nano-clustering patterns in the leading edge, compared to the mid-focal zone, of migrating T-cells. Deleting the cytosolic phosphatase PTPN22, loss-of-function mutations of which have been linked to autoimmune disease, increased T-cell velocity, and leading-edge co-clustering of pY397 FAK, pY416 Src family kinases and LFA-1. These data suggest that differential nanoclustering patterns of LFA-1 in migrating T-cells may instruct intracellular signalling. Our data presents a paradigm where T-cells modulate the nanoscale organisation of adhesion and signalling molecules to fine tune their migration speed, with implications for the regulation of immune and inflammatory responses.This article has an associated First Person interview with the first author of the paper.

Keywords: Integrins; LFA-1; SMLM; T-cell migration; dSTORM.


Conflict of interest statement

Competing interestsThe authors declare no competing or financial interests.

Figures

Figure 1
Figure 1. Fast cells exhibit decreased actin attachment to adhesions and increased flow speed.
Example frames from representative TIRF movies of actin in a migrating T cell (a). b) stationarised version of the same cell c) STICS vector maps from the stationarised cell. d) Box plot showing immobile actin - % of immobile pixels/5 seconds derived from the external reference frame, e) median cell speed (blue bars – blue symbols are median values for each mouse) and retrograde actin flow speed (orange bars and symbols) from the internal reference frame f) Plot showing negative correlation between % of immobile pixels/5 sec vs cell speed: table above shows r values for correlation in each condition. N = 4 mice, 50 cells per mouse, 200 cells per condition. Kruskal Wallis testing was used to compare pooled non-parametric data between each condition. P<0.0001 = ****.
Figure 2
Figure 2. Integrin LFA-1 membrane nanoclusters increase in density and decrease in number in fast migrating cells.
Example pointillist maps derived from STORM imaging of LFA-1 in a stationary cells (a) and a migrating cell (b). Boxes in a and b denote 2 μm2 regions chosen for analysis and representative cluster maps on the right. In each plot, metrics extracted for stationary cells have clear bars, and migrating cells are split up into leading edge (orange bars) and focal zone (blue bars). From left to right conditions proceed: ICAM-1, 2 μg/ml ICAM-1 coated coverslip with added cytochalasin D, Mn2+ or a higher concentration of ICAM-1 (100 μg/ml), then, 2 μg/ml ICAM-1 coated coverslip with CXCL2 added at 150 ng/ml or using cells deficient for PTPN22. Metrics extracted consist of c) number of clusters per ROI, d) cluster radius (nm) and e) the molecules per cluster. (n=350 ROIs and 40 cells per condition from 3 separate mice). Kruskal Wallis testing was used to compare pooled non-parametric data between each condition. NS = not significant. P<0.05 = *. P<0.0001 = ****. Boxed **** in (d) and (e) denotes that p<0.0001 between every condition, apart from for untreated (FZ) versus MnCL2 (FZ).
Figure 3
Figure 3. Intracellular LFA-1 nanoclusters are larger in slow moving cells above the focal zone
A) Representative iPALM Z projection of LFA-1 in a migrating T cell (left panel), zoomed region in xy and xz side view (middle panel), and arbitrarily coloured clusters identified in a 2000 x 2000 nm region by Bayesian cluster analysis (right panel). The radius of clusters (b) and the molecules per cluster (c) were extracted from the cluster maps for stationary cells (0 ICAM-1) and migrating cells (2 μg/ml ICAM-1) (left hand plots), Cytochalasin D and MnCl2 treated (middle plots) and CXCL12 and PTPN22 -/- cells (right plots). Orange box in figure b denotes larger clusters higher above the membrane in slow cells, which are not present in untreated migrating cells. N = 3 mice, 20 cells and 200 ROIs per condition. Kruskal Wallis testing was used to compare pooled data from z heights 0 to 210 nm versus 240 to 420 nm.
Figure 4
Figure 4. Intracellular 3D pY397 FAK nanoclusters are of similar size and density in migrating and stationary cells, while deleting PTPN22 increases membrane distal pools of pY397 FAK.
a) An example pseudocoloured cluster map (left) is shown alongside a zoomed image where clusters can be visualized at different height scales from 0 to 470 nm (middle panel with z colour bar). b) Shows an example cluster map with defined 3D clusters. For the radius of clusters (c) and the number of molecules per cluster (d), the leftmost plots show stationary PTPN22 +/+ or PTPN22 -/- cells (0 ICAM-1), the middle plots show the leading edge of migrating PTPN22 +/+ PTPN22 -/- cells (2 μg/ml ICAM-1) and the right hand plots show the focal zone of migrating PTPN22 +/+ PTPN22 -/- cells (2 μg/ml ICAM-1). N = 3 mice, 20 cells and 200 ROIs per condition. Error bars denote standard error of the mean. Orange boxes denote the population of clusters present in PTPN22 deficient cells and not in proficient cells. Blue boxes denote a reduction in the density of clusters in the FZ compared to the LE, close to the membrane. Kruskal Wallis testing was used to compare pooled data from z heights 0 to 210 nm versus 240 to 420 nm.
Figure 5
Figure 5. Cluster size and number of molecules per cluster increase in faster moving PTPN22 -/- cells in the case of LFA-1, pY397 FAK and pY416 Src, which are more colocalized.
Individual cells were sequentially stained and imaged by madSTORM: LFA-1. pY397 FAK and pY416 Src in the same cell are shown (a). LFA-1 clusters are larger (b) and denser (c) in faster moving PTPN22 -/- cells. pY397FAK and pY416 Src clusters are also larger and denser in PTPN22 -/- cells. The size of pY397 FAK and pY416 Src clusters in PTPN22 -/- are more strongly regionally discriminated: a) clusters in the leading edge are larger than those in the focal zone, though the molecular content stays the same. Pearson’s correlation coefficient for cluster colocalization: d) LFA-1 colocalized with pY397 FAK more in PTPN22 -/- cells, and pY397 FAK colocalized more with pY416 Src in PTPN22 -/- cells (e). LFA-1 and pY416 Src displayed similar levels of colocalization in PTPN22 +/+ and PTPN22 -/- cells (f). N = 21 PTPN22 +/+ cells and 13 PTPN22 -/- cells. *p < 0.05, **p < 0.01, ***p < 0.001, ****p < 0.0001. Boxplots in b and c denote the minimum and maximum values, the median and the IQR. Error bars in d, e and f denote standard error of the mean. Kruskal Wallis and Dunn’s post hoc testing was used to compare the clustering of each molecule, in each zone, in PTPN22 sufficient and deficient T cells.
Figure 6
Figure 6. Schematic diagram of integrin nanoclustering in migrating T cells.
There is greater clustering of surface adhesion molecules at the front of migrating cells which become larger and more co-localised when those cells migrate rapidly. In contrast, a pool of large adhesion molecule clusters exists intracellularly above the focal zone, which become larger for slow moving cells.

References

    1. Alexandrova AY, et al. Comparative dynamics of retrograde actin flow and focal adhesions: formation of nascent adhesions triggers transition from fast to slow flow. [Accessed April 2, 2014];PloS one. 2008 3(9):e3234. Available at: http://www.plosone.org/article/info:doi/10.1371/journal.pone.0003234#pon... . - DOI - PMC - PubMed
    1. Begovich AB, et al. A missense single-nucleotide polymorphism in a gene encoding a protein tyrosine phosphatase (PTPN22) is associated with rheumatoid arthritis. [Accessed May 31, 2014];American journal of human genetics. 2004 75(2):330–7. Available at: http://www.sciencedirect.com/science/article/pii/S0002929707624161 . - PMC - PubMed
    1. Bottini N, et al. Role of PTPN22 in type 1 diabetes and other autoimmune diseases. [Accessed June 3, 2014];Seminars in immunology. 2006 18(4):207–13. Available at: http://www.sciencedirect.com/science/article/pii/S1044532306000455 . - PubMed
    1. Brand O, Gough S, Heward J. <em>HLA</em>, <em>CTLA-4</em> and <em>PTPN22</em>: the shared genetic master-key to autoimmunity? [Accessed July 29, 2014];Expert Reviews in Molecular Medicine. 2005 7(23):1–15. Available at: http://journals.cambridge.org/abstract_S1462399405009981 . - PubMed
    1. Brown CM, et al. Probing the integrin-actin linkage using high-resolution protein velocity mapping. [Accessed April 1, 2014];Journal of cell science. 2006 119(Pt 24):5204–14. Available at: http://jcs.biologists.org/content/119/24/5204.short . - PubMed

Publication types

Substances