

A Robust and Versatile Automated Glycoanalytical Technology for Serum Antibodies and Acute Phase Proteins: Ovarian Cancer Case Study
- PMID: 31471495
- PMCID: PMC6823853
- DOI: 10.1074/mcp.RA119.001531
A Robust and Versatile Automated Glycoanalytical Technology for Serum Antibodies and Acute Phase Proteins: Ovarian Cancer Case Study
Abstract
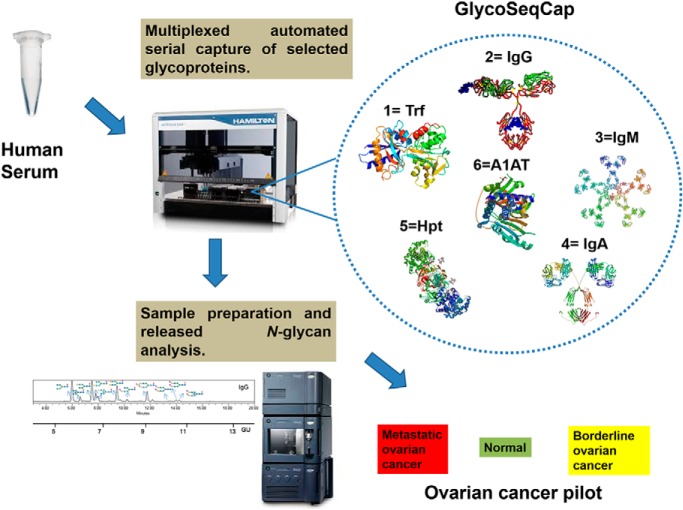
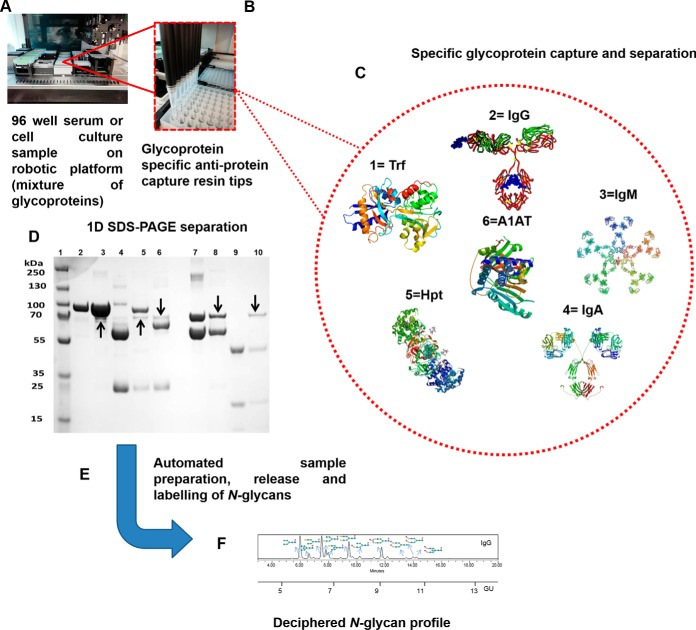
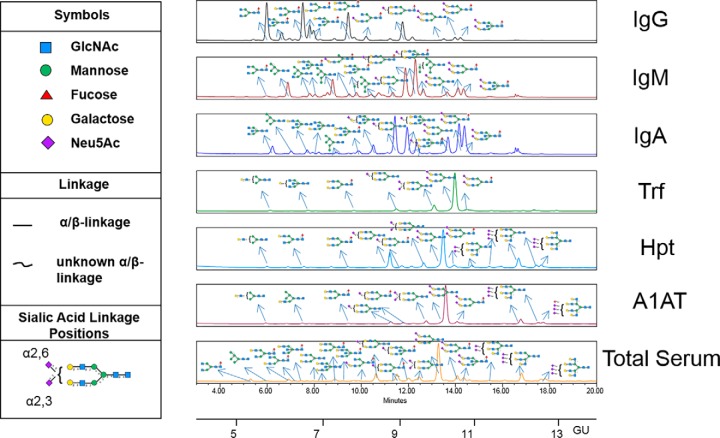
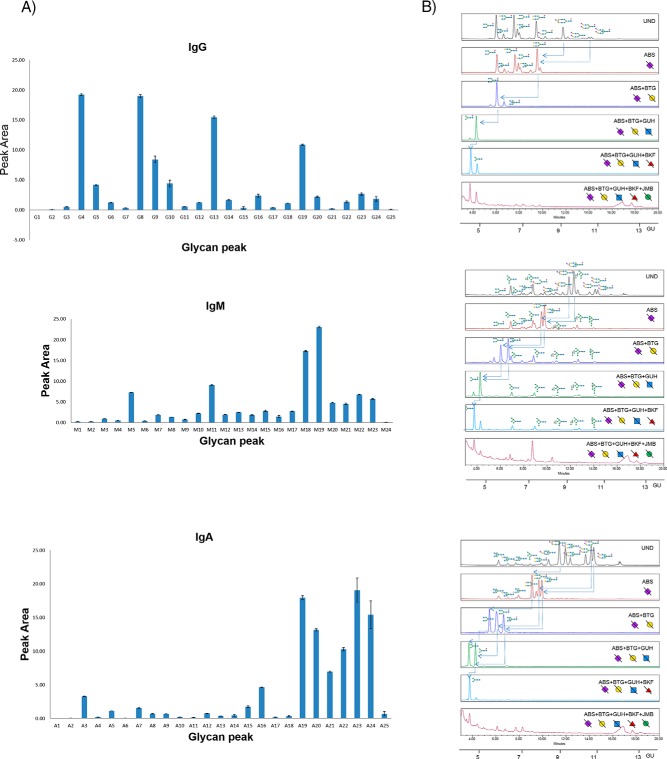
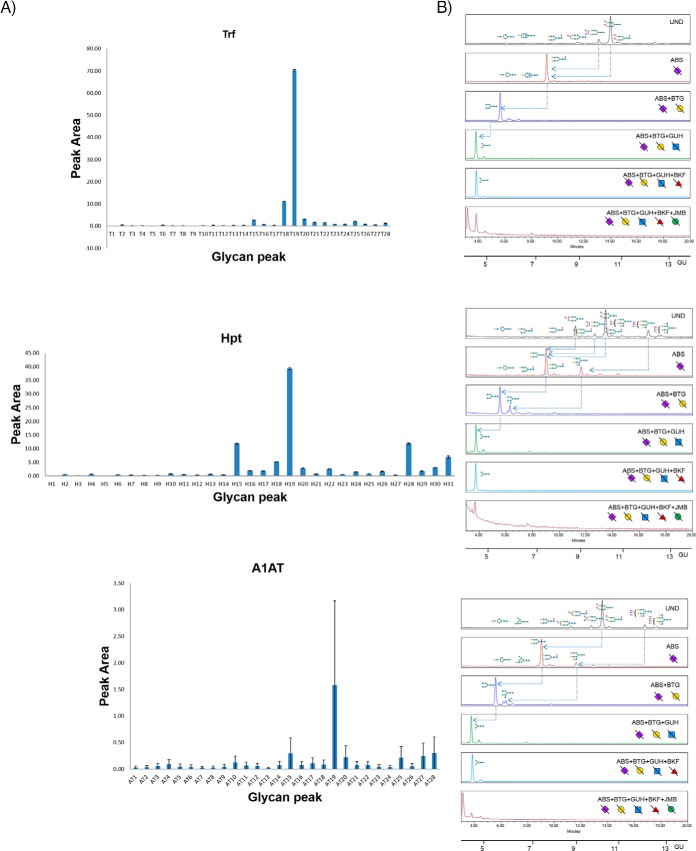
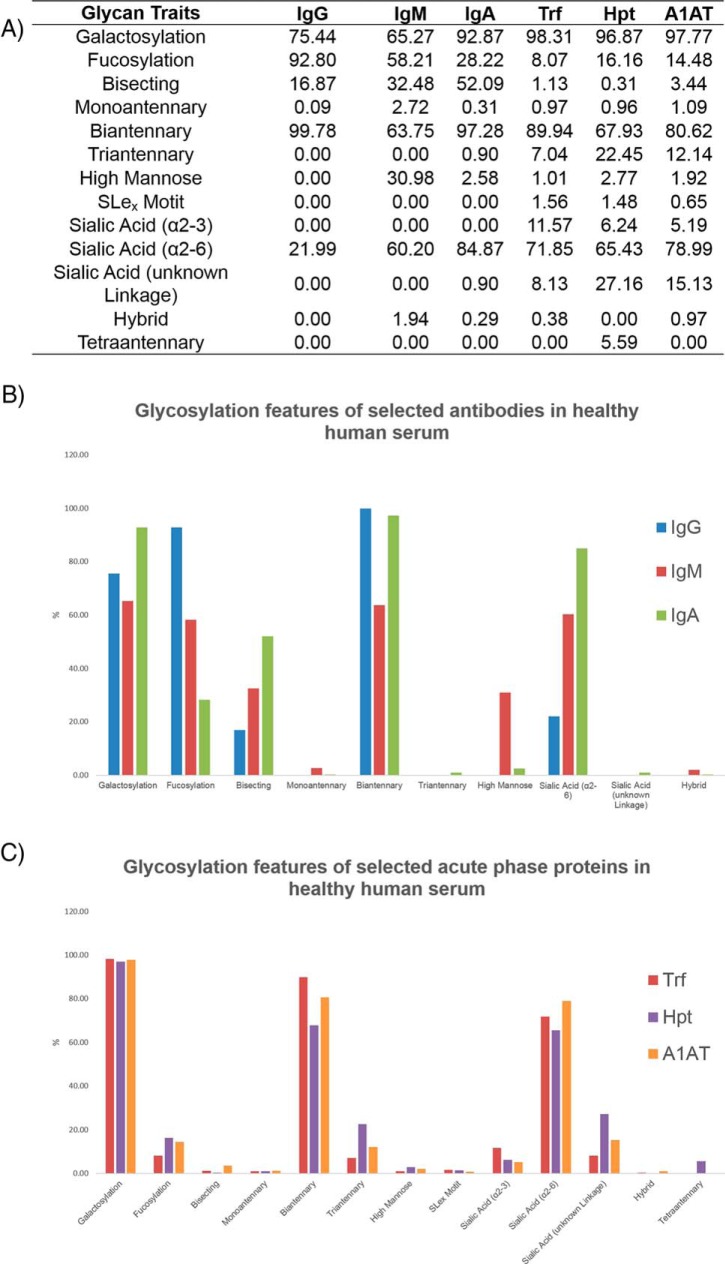
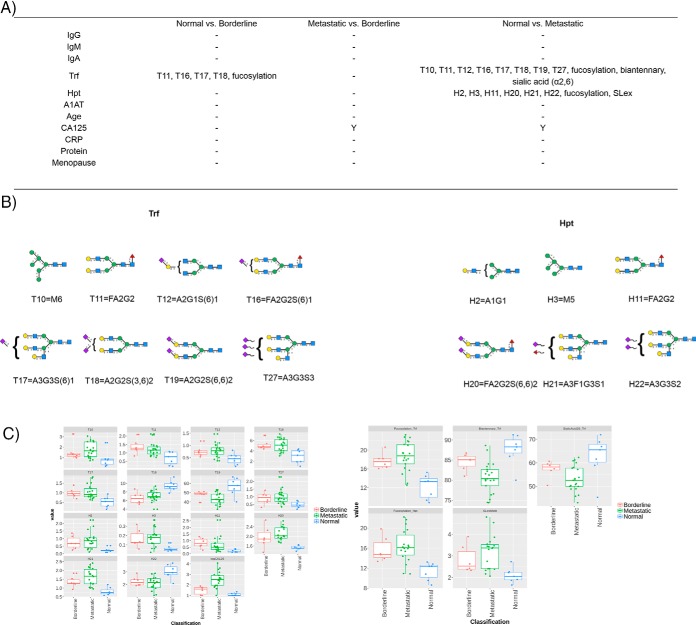
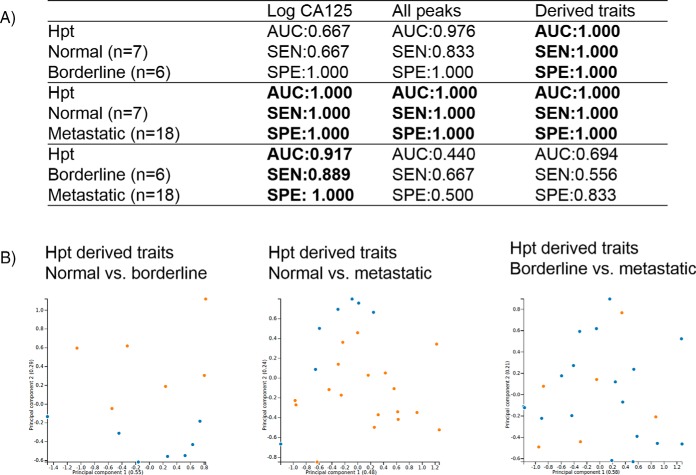
The direct association of the genome, transcriptome, metabolome, lipidome and proteome with the serum glycome has revealed systems of interconnected cellular pathways. The exact roles of individual glycoproteomes in the context of disease have yet to be elucidated. In a move toward personalized medicine, it is now becoming critical to understand disease pathogenesis, and the traits, stages, phenotypes and molecular features that accompany it, as the disruption of a whole system. To this end, we have developed an innovative technology on an automated platform, "GlycoSeqCap," which combines N-glycosylation data from six glycoproteins using a single source of human serum. Specifically, we multiplexed and optimized a successive serial capture and glycoanalysis of six purified glycoproteins, immunoglobulin G (IgG), immunoglobulin M (IgM), immunoglobulin A (IgA), transferrin (Trf), haptoglobin (Hpt) and alpha-1-antitrypsin (A1AT), from 50 μl of human serum. We provide the most comprehensive and in-depth glycan analysis of individual glycoproteins in a single source of human serum to date. To demonstrate the technological application in the context of a disease model, we performed a pilot study in an ovarian cancer cohort (n = 34) using discrimination and classification analyses to identify aberrant glycosylation. In our sample cohort, we exhibit improved selectivity and specificity over the currently used biomarker for ovarian cancer, CA125, for early stage ovarian cancer. This technology will establish a new state-of-the-art strategy for the characterization of individual serum glycoproteomes as a diagnostic and monitoring tool which represents a major step toward understanding the changes that take place during disease.
Keywords: acute phase proteins; antibodies; glycomics; glycoproteins; glycosylation; ovarian cancer; plasma or serum analysis.
© 2019 O'Flaherty et al.
Figures
Similar articles
-
Exploring serum and immunoglobulin G N-glycome as diagnostic biomarkers for early detection of breast cancer in Ethiopian women.BMC Cancer. 2019 Jun 17;19(1):588. doi: 10.1186/s12885-019-5817-8. BMC Cancer. 2019. PMID: 31208374 Free PMC article.
-
Glycosylation changes on serum glycoproteins in ovarian cancer may contribute to disease pathogenesis.Dis Markers. 2008;25(4-5):219-32. doi: 10.1155/2008/601583. Dis Markers. 2008. PMID: 19126966 Free PMC article. Review.
-
Acute-phase glycoprotein N-glycome of ovarian cancer patients analyzed by CE-LIF.Electrophoresis. 2016 Jun;37(11):1461-7. doi: 10.1002/elps.201500518. Epub 2016 Feb 17. Electrophoresis. 2016. PMID: 26763099
-
Ovarian cancer is associated with changes in glycosylation in both acute-phase proteins and IgG.Glycobiology. 2007 Dec;17(12):1344-56. doi: 10.1093/glycob/cwm100. Epub 2007 Sep 20. Glycobiology. 2007. PMID: 17884841
-
The clinical role of glycobiology on ovarian cancer progression.Adv Cancer Res. 2023;157:1-22. doi: 10.1016/bs.acr.2022.07.004. Epub 2022 Aug 18. Adv Cancer Res. 2023. PMID: 36725106 Review.
Cited by
-
N-glycan Characterization by Liquid Chromatography Coupled with Fluorimetry and Mass Spectrometry.Methods Mol Biol. 2022;2370:267-280. doi: 10.1007/978-1-0716-1685-7_13. Methods Mol Biol. 2022. PMID: 34611874
-
Automation of Immunoglobulin Glycosylation Analysis.Exp Suppl. 2021;112:173-204. doi: 10.1007/978-3-030-76912-3_5. Exp Suppl. 2021. PMID: 34687010 Review.
-
Glycomic-Based Biomarkers for Ovarian Cancer: Advances and Challenges.Diagnostics (Basel). 2021 Apr 1;11(4):643. doi: 10.3390/diagnostics11040643. Diagnostics (Basel). 2021. PMID: 33916250 Free PMC article. Review.
-
High-Throughput Glycomic Methods.Chem Rev. 2022 Oct 26;122(20):15865-15913. doi: 10.1021/acs.chemrev.1c01031. Epub 2022 Jul 7. Chem Rev. 2022. PMID: 35797639 Free PMC article. Review.
-
Comparative analysis of transferrin and IgG N-glycosylation in two human populations.Commun Biol. 2023 Mar 23;6(1):312. doi: 10.1038/s42003-023-04685-6. Commun Biol. 2023. PMID: 36959410 Free PMC article.
References
-
- Taniguchi N. (2006) From glycobiology to systems glycobiology: international network with Japanese scientists through consortia. IUBMB Life 58, 269–272 - PubMed
-
- Butler M., Quelhas D., Critchley A. J., Carchon H., Hebestreit H. F., Hibbert R. G., Vilarinho L., Teles E., Matthijs G., Schollen E., Argibay P., Harvey D. J., Dwek R. A., Jaeken J., and Rudd P. M. (2003) Detailed glycan analysis of serum glycoproteins of patients with congenital disorders of glycosylation indicates the specific defective glycan processing step and provides an insight into pathogenesis. Glycobiology 13, 601–622 - PubMed
-
- Grunewald S., Matthijs G., and Jaeken J. (2002) Congenital disorders of glycosylation: a review. Pediatr Res 52, 618–624 - PubMed
-
- Thanabalasingham G. Huffman J. E., Kattla J. J., Novokmet M., Rudan I., Gloyn A. L., Hayward C., Adamczyk B., Reynolds R. M., Muzinic A., Hassanali N., Pucic M., Bennett A. J., Essafi A., Polasek O., Mughal S. A., Redzic I., Primorac D., Zgaga L., Kolcic I., Hansen T., Gasperikova D., Tjora E., Strachan M. W., Nielsen T., Stanik J., Klimes I., Pedersen O. B., Njølstad P. R., Wild S. H., Gyllensten U., Gornik O., Wilson J. F., Hastie N. D., Campbell H., McCarthy M. I., Rudd P. M., Owen K. R., Lauc G., and Wright A. F. (2013) Mutations in HNF1A result in marked alterations of plasma glycan profile. Diabetes 62, 1329–1337 - PMC - PubMed
-
- Colhoun H. O. Treacy E. P., MacMahon M., Rudd P. M., Fitzgibbon M., O'Flaherty R., Stepien K. M. (2018) Validation of an automated UPLCIgG N-glycan analytical method applicable to Classical Galactosaemia. Ann. Clin. Biochem. 55, 593–603 - PubMed
Publication types
MeSH terms
Substances
LinkOut - more resources
Full Text Sources
Medical
Research Materials
Miscellaneous
