. 2019 Aug 30;9(1):12608.
doi: 10.1038/s41598-019-48676-2.

The role of glycolysis and mitochondrial respiration in the formation and functioning of endothelial tip cells during angiogenesis

Affiliations

The role of glycolysis and mitochondrial respiration in the formation and functioning of endothelial tip cells during angiogenesis

Bahar Yetkin-Arik et al. Sci Rep. .

Abstract

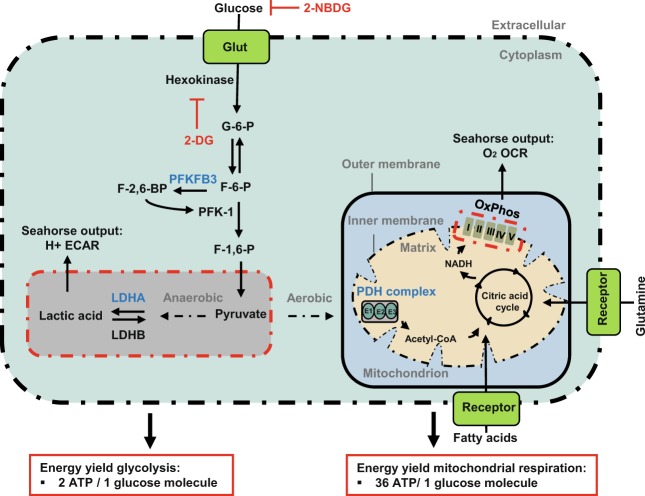
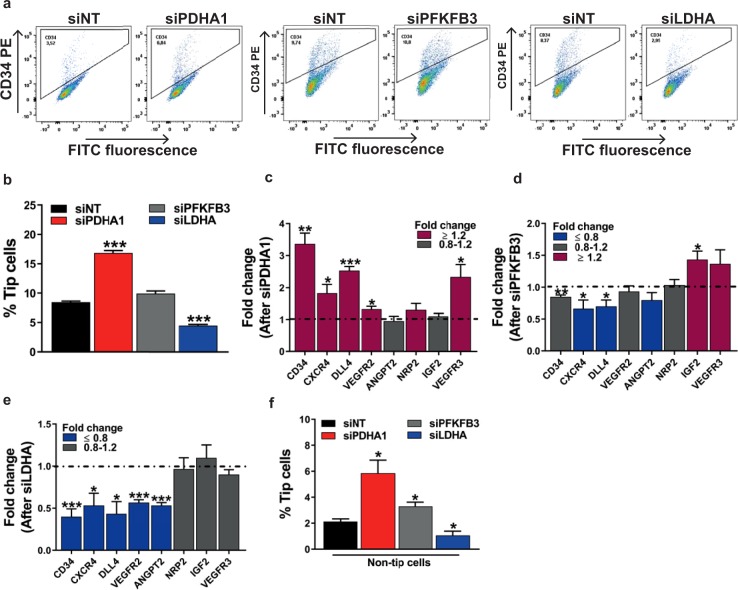
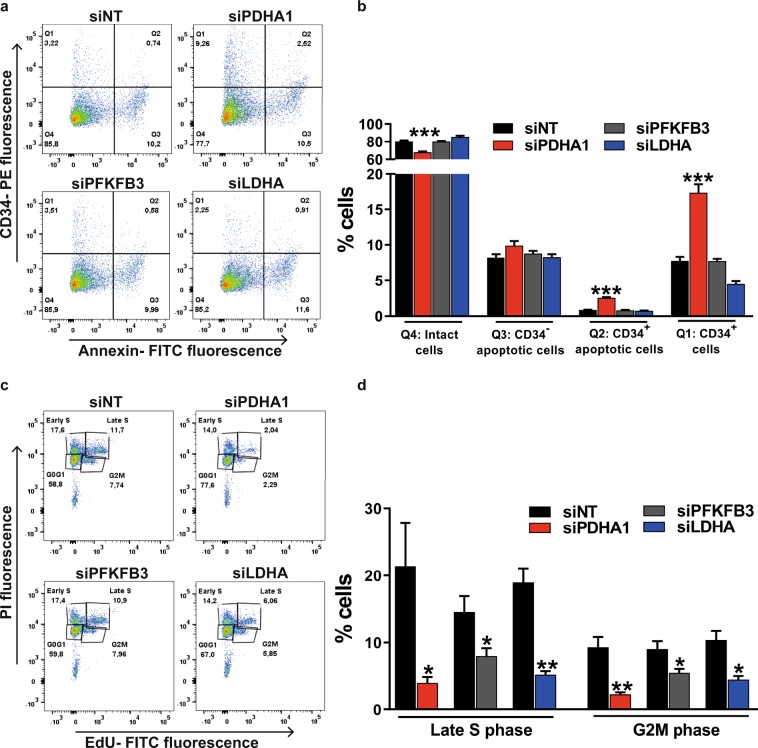
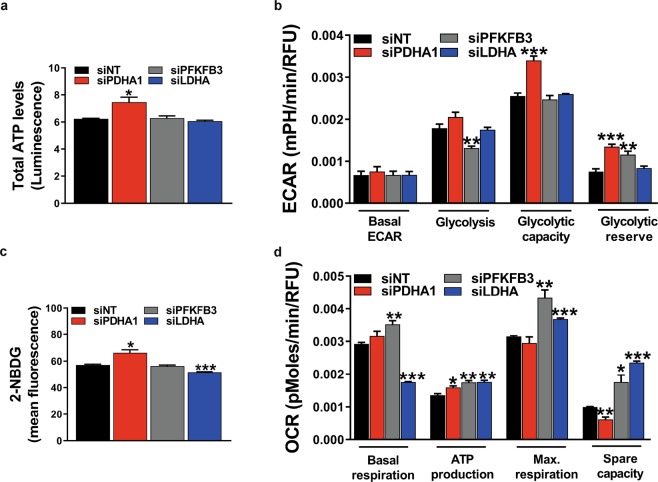
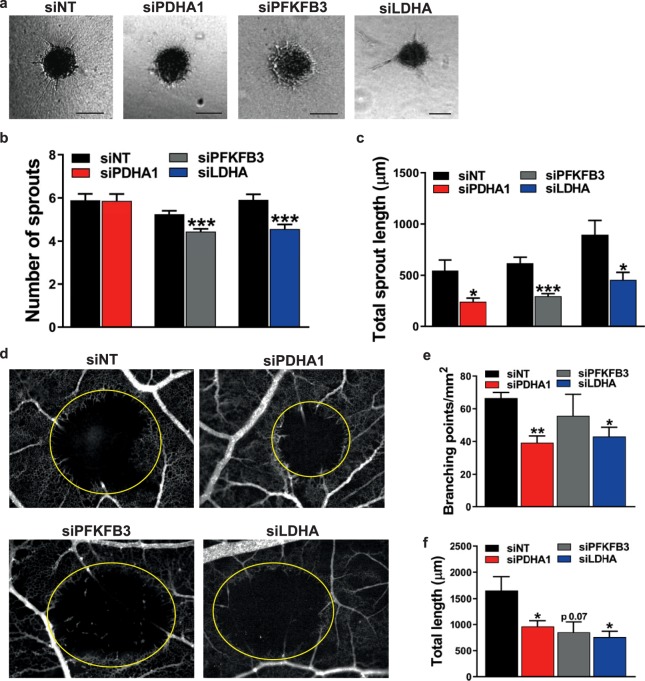
During sprouting angiogenesis, an individual endothelial tip cell grows out from a pre-existing vascular network and guides following and proliferating stalk cells to form a new vessel. Metabolic pathways such as glycolysis and mitochondrial respiration as the major sources of adenosine 5'-triphosphate (ATP) for energy production are differentially activated in these types of endothelial cells (ECs) during angiogenesis. Therefore, we studied energy metabolism during angiogenesis in more detail in tip cell and non-tip cell human umbilical vein ECs. Small interfering RNA was used to inhibit transcription of glycolytic enzymes PFKFB3 or LDHA and mitochondrial enzyme PDHA1 to test whether inhibition of these specific pathways affects tip cell differentiation and sprouting angiogenesis in vitro and in vivo. We show that glycolysis is essential for tip cell differentiation, whereas both glycolysis and mitochondrial respiration occur during proliferation of non-tip cells and in sprouting angiogenesis in vitro and in vivo. Finally, we demonstrate that inhibition of mitochondrial respiration causes adaptation of EC metabolism by increasing glycolysis and vice versa. In conclusion, our studies show a complex but flexible role of the different metabolic pathways to produce ATP in the regulation of tip cell and non-tip cell differentiation and functioning during sprouting angiogenesis.


Conflict of interest statement

The authors declare no competing interests.

Figures

Figure 1
Figure 1
Schematic overview of glycolysis and mitochondrial respiration. Glycolysis and mitochondrial respiration are two major energy-yielding pathways. Glucose is converted into pyruvate in the glycolytic pathway. The fate of pyruvate is dependent on many factors, of which oxygen availability is important. In anaerobic conditions, pyruvate is converted into lactate by LDHA in the cytoplasm. LDHB converts lactate into pyruvate. PFBFB3 enzymes generate fructose-2,6-biphosphate (F2,6P2), an allosteric activator of 6-phosphofructo-1-kinase (PFK-1) that is involved in one of the rate-limiting steps of glycolysis by the conversion of fructose-6-phosphate (F6P) to fructose-1,6-biphosphate (F1,6P2). ECAR is a measure of lactic acid levels, generated by anaerobic glycolysis. In aerobic conditions, pyruvate enters the citric acid cycle via the PDH complex, and is catabolized by oxidative phosphorylation, and ATP is produced by ATP synthase (complex Ѵ). OCR is a measure of oxygen utilization in cells and is an indicator of mitochondrial function. The conversion of glucose into lactate generates 2 ATP per glucose molecule as compared to 36 ATP per glucose molecule when the oxidative phosphorylation is used. 2-NBDG; 2-[N-(7-nitobenz-2-oxa-1,3-diazol-4-yl)-amino]-2-deoxy-D glucose. 2-DG; 2-deoxyglucose. Glut; glucose transporters. G-6-P; glucose-6-phosphate. F-6-P; fructose-6-phosphate. PFKFB3; 6-phosphofructo-2-kinase/fructose-2,6-biphosphatase 3. F-2,6-BP; fructose-2,6-biphosphate. F-1,6-P; fructose-1,6-phosphate. LDHA; lactate dehydrogenase A. LDHB; lactate dehydrogenase B. PDH; pyruvate dehydrogenase. NADH; nicotinamide adenine dinucleotide. FADH2; flavin adenine dinucleotide. H+; proton. OxPhos; oxidative phosphorylation. ECAR; extracellular acidification rates. OCR; oxygen consumption rates. ADP; adenosine 5′-diphosphate. ATP; adenosine 5′-triphosphate.
Figure 2
Figure 2
Effects of inhibition of glycolysis or mitochondrial respiration on endothelial tip cell differentiation in HUVEC cultures. (a) FACS measurements of tip cells with the use of PE-conjugated anti-CD34 antibody after inhibition of the expression of PDHA1, PFKFB3, or LDHA with siRNA in HUVECs. Inhibition of the expression of the mitochondrial gene PDHA1 (siPDHA1 versus siNT) in HUVEC cultures increased relative tip cell numbers (b) and increased mRNA expression levels of 5 out of 8 tip cell-specific genes (c) at 72 h after siRNA transfection. No effects on relative tip cell numbers were found after inhibition of PFKFB3 expression (b), neither did it cause a uniform directional increase or decrease of tip cell-specific mRNA levels (d) at 72 h after siRNA transfection. Silencing of the expression of the glycolytic gene LDHA reduced the percentages of tip cells (b) and decreased the expression of 5 out of 8 tip cell-specific genes (e) at 72 h after siRNA transfection. (f) FACS-sorted HUVECs with the use of PE-conjugated anti-CD34 antibody. Inhibition of PDHA1 or PFKFB3 expression, respectively, in isolated fractions of non-tip cells increased relative tip cell numbers, whereas silencing of LDHA expression diminished the relative tip cell numbers. Percentage of tip cells was determined as described in the methods section. Results are shown as means ± SEM of experiments with HUVECs of at least 3 donors. *P < 0.05, **P < 0.01, and ***P < 0.001 as compared to siNT (Unpaired Student’s t-test).
Figure 3
Figure 3
Effects of the inhibition of glycolysis or mitochondrial respiration on survival of endothelial tip cells and non-tip cells and on proliferation of ECs in HUVEC cultures. (a) Apoptotic cell death of tip cells and non-tip cells after flow cytometric analysis of HUVECs stained with both PE-conjugated anti-CD34 antibody and FITC-conjugated annexin V antibody at 72 h after siRNA transfections against PDHA1, PFKFB3, or LDHA, respectively. Four quadrants (Q) representing: viable tip cells (Q1), apoptotic tip cells (Q2), apoptotic non-tip cells (Q3), and viable non-tip cells (Q4). (b) Inhibition of PDHA1 expression increased the percentage of apoptotic tip cells, whereas no effect was found in non-tip cells. Inhibition of PFKFB3 or LDHA expression, respectively, did not alter percentages of apoptotic tip cells and non-tip cells. (c) Cell proliferation assay of HUVECs expressed as percentages of non-proliferating cells in the G0/G1 phase, and proliferating cells in early S phase, late S phase and G2M phase after flow cytometric analysis of fluorescence of incorporated EdU at 72 h after siRNA transfections against PDHA1, PFKFB3, or LDHA, respectively. (d) Inhibition of the expression of PDHA1, PFKFB3, or LDHA lowered percentages of proliferating HUVECs in the late S phase and G2M phase. Results are shown as means ± SEM of experiments with HUVECs of at least 3 donors. *P < 0.05, **P < 0.01, and ***P < 0.001 as compared to siNT (Unpaired Student’s t-test).
Figure 4
Figure 4
Metabolic flexibility of HUVECs. (a) Inhibition of PDHA1 expression increased total ATP levels (measured as relative luminescence), whereas inhibition of PFKFB3 or LDHA expression did not show effects on total ATP levels at 72 h after siRNA transfection. Assessment of ECAR (b) and uptake levels of 2-NBDG (100 µM) (c) showed increased levels of glycolysis after inhibition of PDHA1 expression at 72 h after siRNA transfection. Inhibition of PFKFB3 expression decreased glucose-induced glycolysis (b), but did not have an effect on uptake levels of 2-NBDG (c). Inhibition of LDHA expression did not affect ECAR (b), but lowered 2-NBDG uptake levels (c) at 72 h after siRNA transfection. (d) siRNA against PDHA1 induced OCR-linked ATP production, but lowered spare capacity in HUVECs. Silencing of PFKFB3 gene expression increased OCR. Inhibition of LDHA expression lowered basal respiration levels, but increased OCR-linked ATP production, maximal respiration capacity, and spare capacity at 72 h after siRNA transfection. OCR and ECAR measurements were normalized for DNA content (RFU). mpH/min: milli-pH units per minute luminescence was normalized for cell numbers. Results are shown as means ± SEM of experiments with HUVECs of at least 3 donors. *P < 0.05, **P < 0.01, and ***P < 0.001 as compared to siNT (Unpaired Student’s t-test).
Figure 5
Figure 5
Roles of glycolysis and mitochondrial respiration in angiogenic endothelial sprouting in vitro and in the in vivo CAM assay. (a) Representative images of the in vitro spheroid assay after transfection of siRNA against PDHA1, PFKFB3, LDHA, or NT. Scale bar = 100 µm. (b) Spheroids showed decreased sprout numbers after inhibition of PFKFB3 or LDHA expression, respectively, at 96 h after siRNA transfection. Inhibition of PDHA1 expression did not have an effect on the number of sprouts. (c) Inhibition of PDHA1, PFKFB3, or LDHA expression, respectively, reduced total sprout length at 96 h after siRNA transfection. (d) Representative images of the vascular network in the in vivo CAM model after vascular occlusion by photodynamic therapy (yellow-marked zones) and transfection of siRNA against PDHA1, PFKFB3, LDHA, or NT. (e) Inhibition of PDHA1 or LDHA expression in the in vivo CAM model reduced the number of branching points/mm2, respectively, whereas inhibition of PFKFB3 did not have an effect. (f) Total sprout length in the in vivo CAM model was reduced after silencing of PDHA1, PFKFB3, or LDHA expression, respectively. Results are shown as means ± SEM of experiments of at least 3 donors. *P < 0.05, **P < 0.01, and ***P < 0.001 as compared to siNT (Unpaired Student’s t-test).

References

    1. Siemerink MJ, Klaassen I, Van Noorden CJ, Schlingemann RO. Endothelial tip cells in ocular angiogenesis: potential target for anti-angiogenesis therapy. J. Histochem. Cytochem. 2013;61:101–115. doi: 10.1369/0022155412467635. - DOI - PMC - PubMed
    1. Geudens I, Gerhardt H. Coordinating cell behaviour during blood vessel formation. Development. 2011;138:4569–4583. doi: 10.1242/dev.062323. - DOI - PubMed
    1. Goveia J, Stapor P, Carmeliet P. Principles of targeting endothelial cell metabolism to treat angiogenesis and endothelial cell dysfunction in disease. EMBO Mol. Med. 2014;6:1105–1120. doi: 10.15252/emmm.201404156. - DOI - PMC - PubMed
    1. Warburg O. On the origin of cancer cells. Science. 1956;123:309–314. doi: 10.1126/science.123.3191.309. - DOI - PubMed
    1. De Bock K, et al. Role of PFKFB3-driven glycolysis in vessel sprouting. Cell. 2013;154:651–663. doi: 10.1016/j.cell.2013.06.037. - DOI - PubMed

Publication types

MeSH terms