. 2020 Jun;77(12):2367-2386.
doi: 10.1007/s00018-019-03287-y. Epub 2019 Aug 30.

Apolipoprotein E-mediated regulation of selenoprotein P transportation via exosomes

Affiliations

Apolipoprotein E-mediated regulation of selenoprotein P transportation via exosomes

Yunjung Jin et al. Cell Mol Life Sci. 2020 Jun.

Abstract

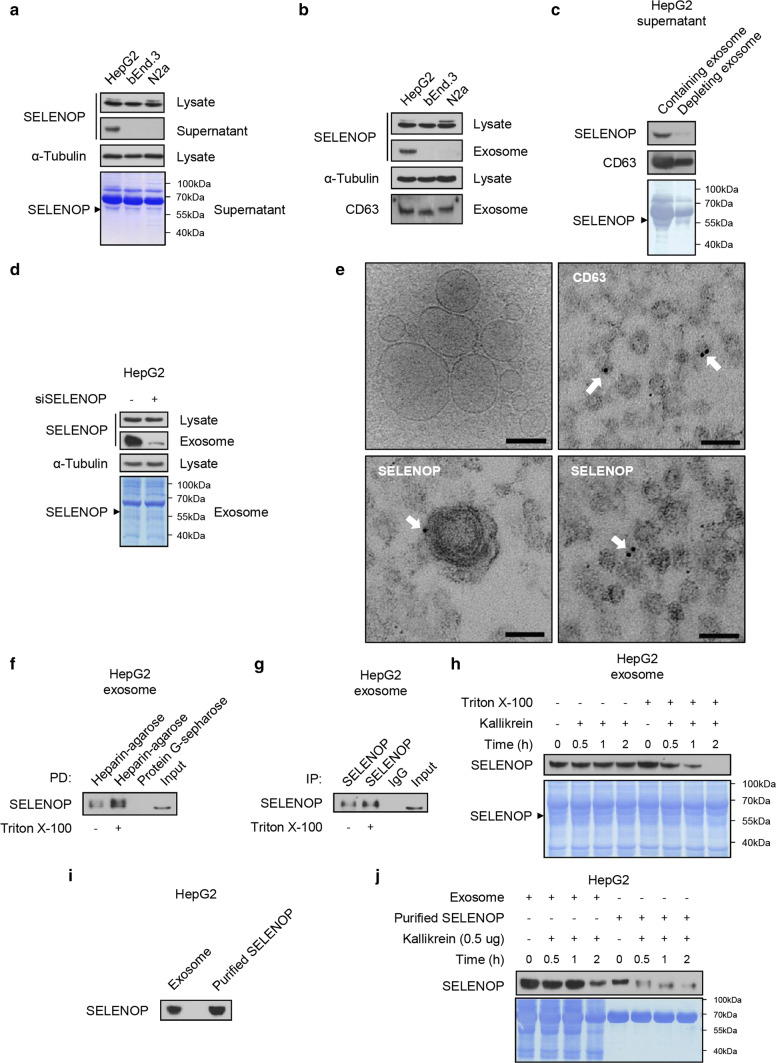
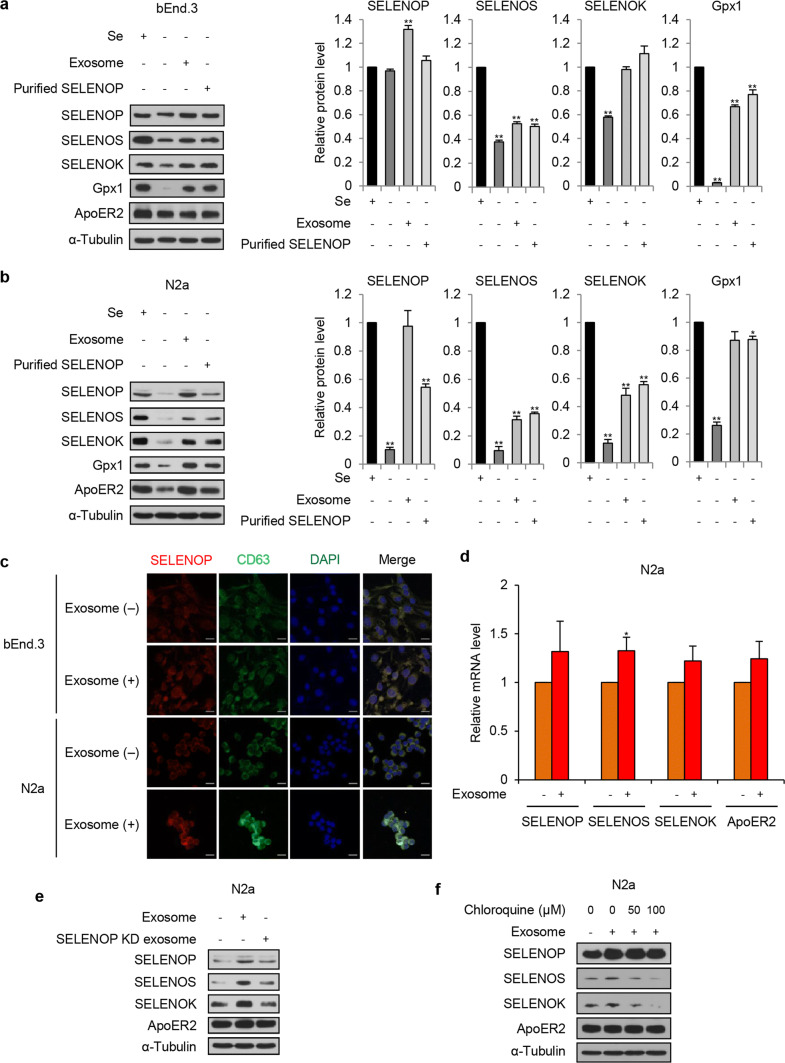
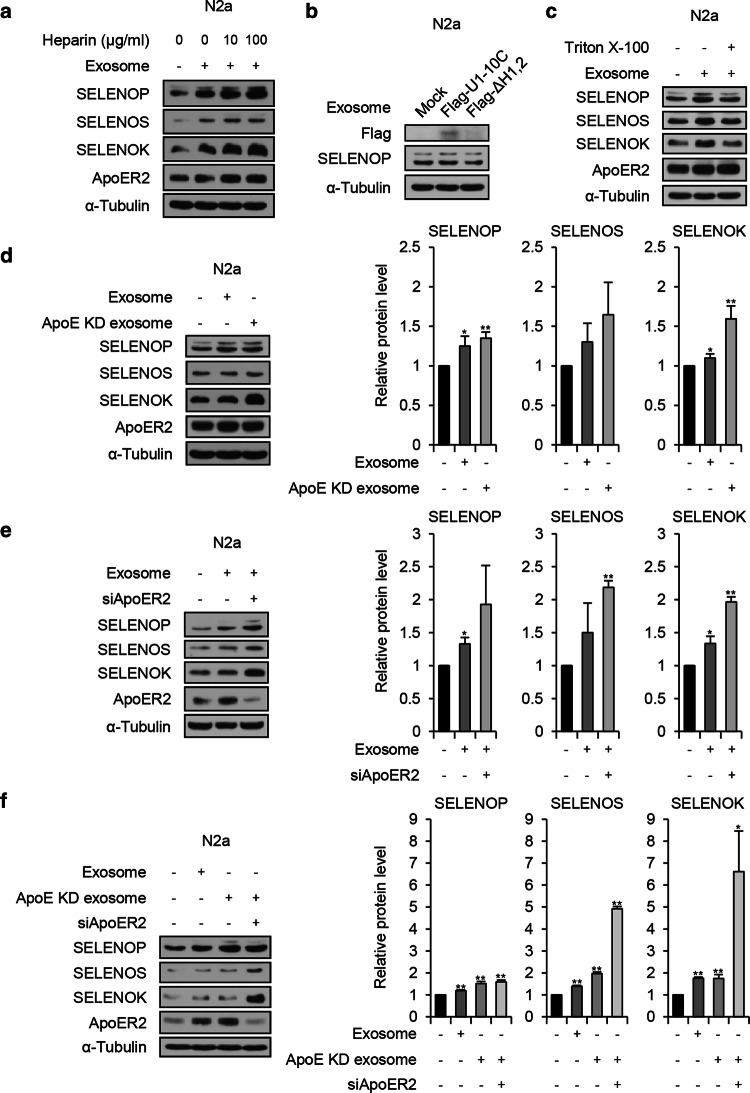
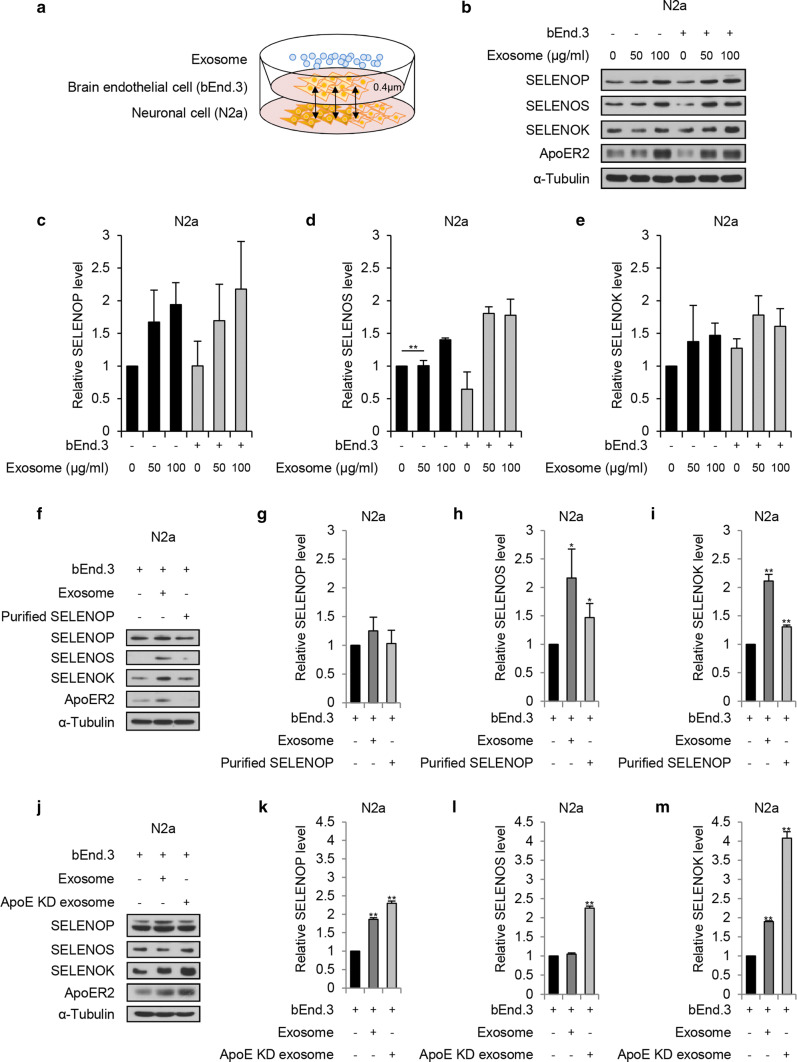
Selenoprotein P (SELENOP), secreted from the liver, functions as a selenium (Se) supplier to other tissues. In the brain, Se homeostasis is critical for physiological function. Previous studies have reported that SELENOP co-localizes with the apolipoprotein E receptor 2 (ApoER2) along the blood-brain barrier (BBB). However, the mechanism underlying SELENOP transportation from hepatocytes to neuronal cells remains unclear. Here, we found that SELENOP was secreted from hepatocytes as an exosomal component protected from plasma kallikrein-mediated cleavage. SELENOP was interacted with apolipoprotein E (ApoE) through heparin-binding sites of SELENOP, and the interaction regulated the secretion of exosomal SELENOP. Using in vitro BBB model of transwell cell culture, exosomal SELENOP was found to supply Se to brain endothelial cells and neuronal cells, which synthesized selenoproteins by a process regulated by ApoE and ApoER2. The regulatory role of ApoE in SELENOP transport was also observed in vivo using ApoE-/- mice. Exosomal SELENOP transport protected neuronal cells from amyloid β (Aβ)-induced cell death. Taken together, our results suggest a new delivery mechanism for Se to neuronal cells by exosomal SELENOP.

Keywords: Amyloid β; Apolipoprotein E; Exosome; Protein transport; Selenoprotein P.


Conflict of interest statement

The authors declare no competing interests.

Figures

Fig. 1
Fig. 1
SELENOP is mainly secreted from hepatocytes via exosomes, and is protected from cleavage by plasma proteases. a Western blot analysis of cell lysates and supernatant from hepatocytes (HepG2), brain endothelial cells (bEnd.3), and neuronal cells (N2a). The cells and supernatant were harvested from each cell line after 48 h incubation in serum-free media and analyzed by western blot. α-Tubulin was used as loading control for lysates and Coomassie blue staining was conducted for loading control of supernatant. SELENOP is indicated by an arrowhead. b Western blot analysis of the cell lysates and lysed exosomes derived from HepG2, bEnd.3, and N2a cells. Exosomes were purified from the supernatant of each cell line and analyzed by western blot. CD63 was used as exosome marker. c HepG2 supernatant with or without exosomes was analyzed by western blot. Exosome-depleted supernatant was prepared by centrifugation. SELENOP is indicated by an arrowhead on Coomassie blue-stained membrane. d siSELENOP or control siRNA was transfected into HepG2 cells. After 48 h, the cell lysates and lysed exosomes were analyzed by western blot. The membrane was stained with Coomassie blue for loading control and SELENOP is indicated by an arrowhead. e Purified HepG2 exosomes were observed by electron microscopy (EM). Cryo-TEM images of exosomes show a representative single vesicle with round morphology, lipid bilayer membrane, and clearly observed lumen. CD63 was used as a surface exosome marker, and SELENOP was localized to the membrane of exosomes as shown by immuno-EM staining, indicated with white arrows. Scale bars 100 nm. Intact exosomes treated with 0 or 0.01% Triton X-100 were pulled down by heparin-agarose beads (f) or immunoprecipitated using an antibody against SELENOP (g). The protein G-Sepharose and mouse IgG were used as negative controls. h Intact HepG2 exosomes treated with 0 or 0.1% Triton X-100 were incubated with 0.5 μg kallikrein protease for 0, 0.5, 1, and 2 h at 37 °C. The membrane was stained with Coomassie blue for loading control, and SELENOP is indicated by an arrowhead. i Western blot analysis of the exosomal SELENOP and purified SELENOP derived from HepG2 cells. Relative SELENOP intensity was analyzed by ImageJ software and used for further experiments. j Intact exosomes and purified SELENOP derived from HepG2 cells were incubated with 0.5 μg kallikrein protease for 0, 0.5, 1, and 2 h at 37 °C. The membrane was stained with Coomassie blue for loading control
Fig. 2
Fig. 2
Exosome-mediated SELENOP secretion is regulated by heparin binding of SELENOP and ApoE. a Western blot analysis of lysed exosomes derived from heparin-treated HepG2 cells. Exosomes were purified from HepG2 cells treated for 48 h with heparin at the indicated concentrations. The membrane was stained with Coomassie blue for loading control and SELENOP is indicated by an arrowhead. b Schematic illustration of histidine-rich (H-rich) deletion mutants of human SELENOP (hSELENOP). Flag (orange) is tagged between signal sequence (ss; yellow) and SELENOP. H-rich domains are indicated with light blue and cysteine residues substituted for selenocysteine are indicated with red lines. c HepG2 cells were transfected with each H-rich deletion mutant, respectively. After 48 h, lysed exosomes were analyzed by western blot. The secreted SELENOP of each mutants was quantified by comparing with total SELENOP (n = 3, mean ± SD). HepG2 lysates (d) and lysed exosomes (e) were immunoprecipitated by SELENOP antibodies and then detected with ApoE and SELENOP antibodies (HC: heavy chain). f HepG2 cells were incubated with 0, 1, 10, and 100 μg/ml heparin for 48 h, and then cell lysates were prepared. HepG2 lysates were immunoprecipitated by SELENOP antibodies and analyzed by western blot. g Purified ApoE-His was incubated with Ni–NTA agarose beads for 2 h and purified SELENOP was pre-incubated with heparin for 2 h. Then SELENOP treated with heparin was applied to the complex of ApoE-His and Ni–NTA agarose beads, and pulled downed for western blot. h HepG2 cells were transfected with Flag-U1-10C, Flag-ΔH1,2 or control plasmids for 24 h. Lysates were immunoprecipitated by Flag antibodies and analyzed by western blot. i siApoE or control siRNA was transfected into HepG2 cells for 48 h. Lysates and lysed exosomes were analyzed by western blot. The membrane was stained with Coomassie blue for loading control and SELENOP is indicated by an arrowhead. The p values represent comparisons with each control (*p < 0.05, **p < 0.01)
Fig. 3
Fig. 3
As a Se supplier, exosomal SELENOP derived from hepatocytes is transported to the brain endothelial cells and neuronal cells. a, b Mouse brain endothelial bEnd.3 cells (a), neuroblastoma N2a cells (b) cultured in 10% serum-containing or serum-free media were treated with exosomes or purified SELENOP derived from HepG2 cells. After 24 h treatment, cells were lysed and analyzed by western blot. α-Tubulin was used for normalization (n = 3, mean ± SD). c Immunofluorescence assay of the bEnd.3 and N2a cells treated with 0 or 100 μg/ml exosomes for 6 h was conducted. CD63 was labeled with green fluorescent signal to detect transported exosomes. SELENOP was labeled with red fluorescent signal, and nuclei were stained with DAPI (blue). Scale bars 20 μm. d mRNA levels of SELENOP, SELENOS, SELENOK, and ApoER2 in N2a cells treated with 0 or 100 μg/ml exosomes for 24 h were determined by real-time PCR. β-Actin was used for normalization (n = 3, mean ± SD). e Exosomes were purified from HepG2 cells transfected with siSELENOP or control siRNA. N2a cells were incubated with 0 or 100 μg/ml SELENOP knockdown (SELENOP KD) or control exosomes for 6 h. Cell lysates were prepared and analyzed by western blot. f N2a cells were treated with 0 or 100 μg/ml exosomes. After 3 h treatment, the cells were further incubated with 0, 50, and 100 μM chloroquine for 6 h to block lysosomal degradation of SELENOP. Lysed cells were analyzed by western blot. The p values represent comparisons with each control (*p < 0.05, **p < 0.01)
Fig. 4
Fig. 4
ApoE and ApoER2 regulate exosome-mediated SELENOP transport. a Effects of heparin on SELENOP-containing exosome transport. 0 or 100 μg/ml exosomes were incubated with N2a cells with 0, 10, and 100 μg/ml heparin. After 6 h, the cells were lysed and analyzed by western blot. b HepG2 cells were transfected with Flag-U1-10C, Flag-ΔH1,2, and control plasmids, respectively, and exosomes were purified from the HepG2 cells. N2a cells were incubated with the exosomes for 6 h and the cells were harvested and analyzed by western blot. c Exosomes purified from HepG2 cells were incubated with 0 or 0.01% Triton X-100 for 30 min. The exosomes were incubated with N2a cells. After 6 h treatment, the cells were harvested and analyzed by western blot. d Exosomes were purified from HepG2 cells transfected with siApoE or control siRNA. N2a cells were incubated with 0 or 100 μg/ml ApoE knockdown (ApoE KD) or control exosomes for 6 h. The cell lysates were prepared and analyzed by western blot. e N2a cells were transfected with siApoER2 or control siRNA. The cells were treated with 0 or 100 μg/ml exosomes for 6 h and analyzed by western blot. f N2a cells were transfected with siApoER2 or control siRNA. The cells were treated with 0 or 100 μg/ml ApoE KD or control exosomes derived from HepG2 cells. After 6 h treatment, the cells were harvested and analyzed by western blot. Relative protein levels of SELENOP, SELENOS, and SELENOK in N2a cells were quantified. α-Tubulin was used for normalization (n = 3, mean ± SD). The p values represent comparisons with each control (*p < 0.05, **p < 0.01)
Fig. 5
Fig. 5
Exosomal SELENOP is transported to the neuronal cells through the brain endothelial cells in an in vitro BBB model. a Schematic illustration of the in vitro BBB model using a transwell system with 0.4 μm pores. bEnd.3 cells were seeded into the upper compartment and N2a cells were seeded into the bottom compartment of the transwell system, and the cells were co-culture. Purified exosomes were incubated in the upper compartment. b N2a cells were co-cultured with or without bEnd.3 cells. Exosomes were incubated in the upper compartment of the transwell. After 24 h treatment, the N2a cells were harvested and analyzed by western blot. Quantification of the relative protein levels of SELENOP (c), SELENOS (d) and SELENOK (e) from N2a cells. f N2a cells were co-cultured with bEnd.3 cells. Exosomes or purified SELENOP were incubated in the upper compartment of the transwell. After 12 h treatment, the N2a cells were harvested and analyzed by western blot. Quantification of the relative protein levels of SELENOP (g), SELENOS (h) and SELENOK (i) from N2a cells. j Exosomes were purified from HepG2 cells transfected with siApoE or control siRNA. N2a cells were co-cultured with bEnd.3 cells. ApoE KD or control exosomes derived from HepG2 cells were incubated in the upper compartment. After 9 h treatment, the N2a cells were harvested and analyzed by western blot. Quantification of the relative protein levels of SELENOP (k), SELENOS (l) and SELENOK (m) from N2a cells. α-Tubulin was used for normalization (n = 3, mean ± SD). The p values represent comparisons with each control (*p < 0.05, **p < 0.01)
Fig. 6
Fig. 6
Exosome-mediated SELENOP secretion and transport are regulated by ApoE in vivo. a, b Mouse plasma and exosomes were extracted from control (ApoE+/+) mouse and ApoE−/− mouse. Extracted plasma (a) and exosomes (b) were analyzed by western blot. The membrane was stained with Coomassie blue for loading control. c N2a cells were incubated with 0 or 100 μg/ml exosomes purified from control or ApoE−/− mouse. After 6 h incubation, the cells were harvested and analyzed by western blot. d N2a cells were transfected with siApoER2 or control siRNA. Cells were treated with 0 or 100 μg/ml exosomes derived from control or ApoE−/− mouse. After 6 h treatment, the cells were harvested and analyzed by western blot. e N2a cells were treated with 0 or 100 μg/ml exosomes derived from control or ApoE−/− mouse. After 3 h treatment, the cells were further incubated with 0 or 100 μM chloroquine for 6 h to block lysosomal degradation of SELENOP. The cells were harvested and analyzed by western blot. f N2a cells were co-cultured with bEnd.3 cells using an in vitro BBB model. Exosomes derived from control or ApoE−/− mouse were incubated in the upper compartment of the transwell. After 9 h treatment, the N2a cells were harvested and analyzed by western blot. g The mouse brain cortex was isolated from control and ApoE−/− mouse and analyzed by western blot. h mRNA was extracted from the mouse cortex. Relative mRNA level of SELENOP was evaluated by real-time PCR. β-Actin was used for normalization (n = 6; mean ± SD). The p values represent comparisons with each control (*p < 0.05, **p < 0.01)
Fig. 7
Fig. 7
Exosomal transport of SELENOP protects N2a cells from Aβ-induced cell death. a1–42 was pre-incubated with or without exosomes purified from HepG2 cells for 1 h. The Aβ1–42 was added to N2a cells for 0, 3, 6 h and the supernatant was harvested. Relative level of Aβ1–42 in supernatant was evaluated by ELISA (n = 3; mean ± SD). b N2a cells transfected with GFP-Aβ1–42 were incubated with serum-free media and harvested after 0, 3, 6, 12, and 24 h. The supernatant and cell lysates were analyzed by western blot. The membrane was stained with Coomassie blue for loading control. c N2a cells transfected with GFP-Aβ1–42 were incubated with 0 or 100 μg/ml exosomes for 12 or 24 h. The supernatant and cell lysates were analyzed by western blot. The membrane was stained with Coomassie blue for loading control. d The cell lysates of N2a cells transfected with GFP-Aβ1–42 were immunoprecipitated using SELENOP antibodies and analyzed with GFP and SELENOP antibodies. e Exosomes were purified from HepG2 cells transfected with siSELENOP or control siRNA. N2a cells transfected with GFP-Aβ1–42 were incubated with 0 or 100 μg/ml SELENOP KD or control exosomes for 12 h and analyzed by western blot. f N2a cells transfected with GFP-Aβ1–42 were incubated with 0 or 100 μg/ml exosomes for 3 h and the cells were further treated with 0 or 100 μM chloroquine. After 24 h treatment, the cells were harvested and analyzed by western blot. g N2a cells transfected with GFP-Aβ1–42 were incubated with 75 nM LysoTracker for 30 min. GFP-Aβ1–42, SELENOP, and LysoTracker ware shown in green, red and blue fluorescent signal, respectively, as shown in left panels. Merged z stack image shows the merged signals as shown in middle panel. Scale bars: 5 μm. The percentage of relative localization of GFP-Aβ1–42 was estimated as shown in left graph by calculating the Mander’s coefficient using ImageJ software [Mander’s coefficient: [(+) GFP Aβ1–42, (−) SELENOP, (−) LysoTracker]; 0.493, [(+) GFP Aβ1–42, (−) SELENOP, (+) LysoTracker]; 0.124, [(+) GFP Aβ1–42, (+) SELENOP, (−) LysoTracker]; 0.220, [(+) GFP Aβ1–42, (+) SELENOP, (+) LysoTracker); 0.163]. h Exosomes were purified from HepG2 cells transfected with siSELENOP or control siRNA. N2a cells transfected with GFP-Aβ1–42 were incubated with 0 or 100 μg/ml SELENOP KD or control exosomes. After 12 h incubation, the cells were harvested and stained with APC Annexin V for FACS analysis. The p values represent comparisons with each control (*p < 0.05, **p < 0.01)

Similar articles

Cited by

References

    1. Labunskyy VM, Hatfield DL, Gladyshev VN. Selenoproteins: molecular pathways and physiological roles. Physiol Rev. 2014;94(3):739–777. doi: 10.1152/physrev.00039.2013. - DOI - PMC - PubMed
    1. Kryukov GV, Castellano S, Novoselov SV, Lobanov AV, Zehtab O, Guigo R, Gladyshev VN. Characterization of mammalian selenoproteomes. Science. 2003;300(5624):1439–1443. doi: 10.1126/science.1083516. - DOI - PubMed
    1. Hill KE, Xia Y, Akesson B, Boeglin ME, Burk RF. Selenoprotein P concentration in plasma is an index of selenium status in selenium-deficient and selenium-supplemented Chinese subjects. J Nutr. 1996;126(1):138–145. doi: 10.1093/jn/126.1.138. - DOI - PubMed
    1. Read R, Bellew T, Yang JG, Hill KE, Palmer IS, Burk RF. Selenium and amino acid composition of selenoprotein P, the major selenoprotein in rat serum. J Biol Chem. 1990;265(29):17899–17905. - PubMed
    1. Burk RF, Hill KE. Selenoprotein P-expression, functions, and roles in mammals. Biochim Biophys Acta. 2009;1790(11):1441–1447. doi: 10.1016/j.bbagen.2009.03.026. - DOI - PMC - PubMed

LinkOut - more resources