

An in vitro model to explore subchondral perfusion and intraosseous pressure
- PMID: 31471704
- PMCID: PMC6717224
- DOI: 10.1186/s40634-019-0207-3
An in vitro model to explore subchondral perfusion and intraosseous pressure
Abstract
Background: Little is known about subchondral perfusion physiology. We developed a 3Rs (Replace, Reduce, Refine) compliant in vitro calf foot model to explore perfusion and intraosseous pressure (IOP).
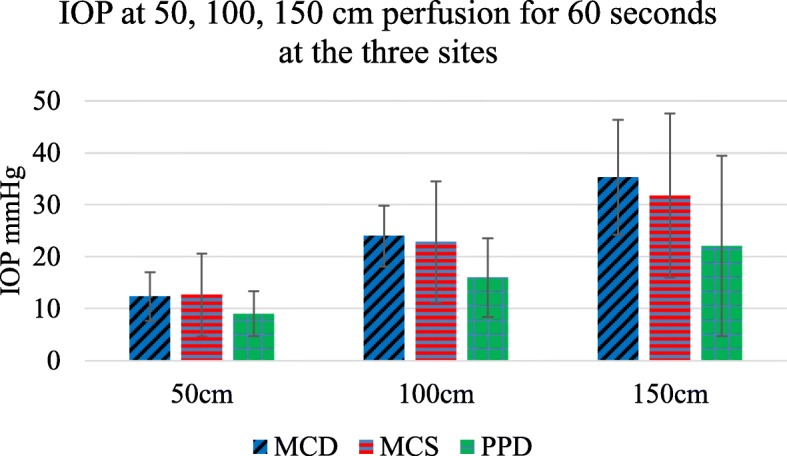
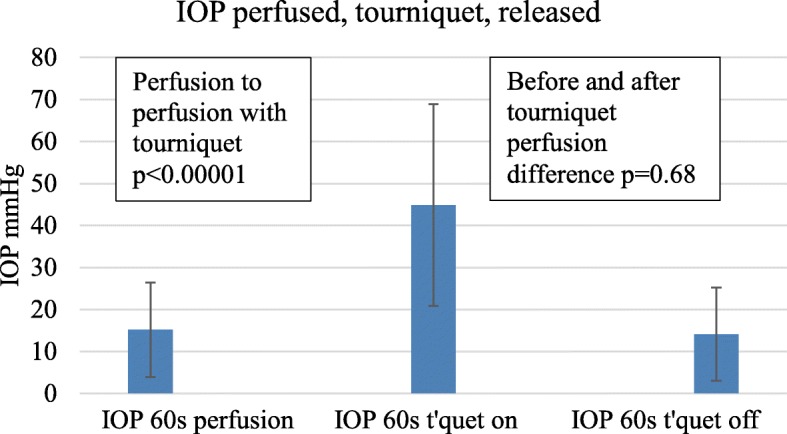
Methods: Calf feet were catheterised and perfused with serum. IOP was measured at three sites, the metacarpal diaphysis (MCD), metacarpal subchondral epiphysis (MCS) and proximal phalanx diaphysis (PPD) using intraosseous needles with pressure transducers and digital recorders. Fresh (< 4 h post mortem) and old feet (> 4 h post mortem) were perfused at different pressures, with and without a proximal tourniquet.
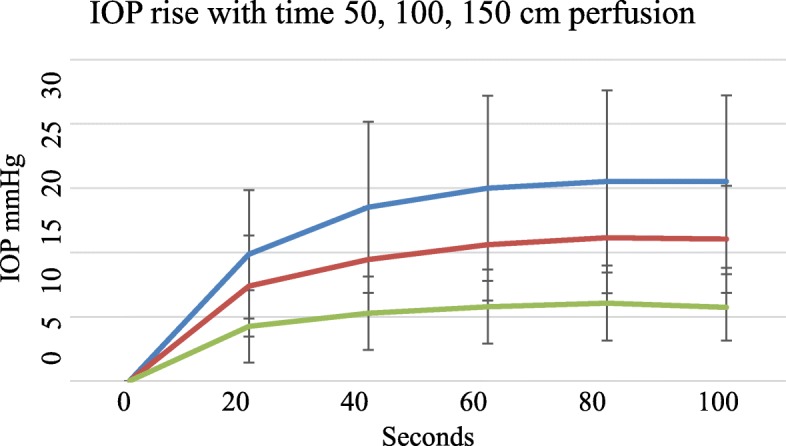
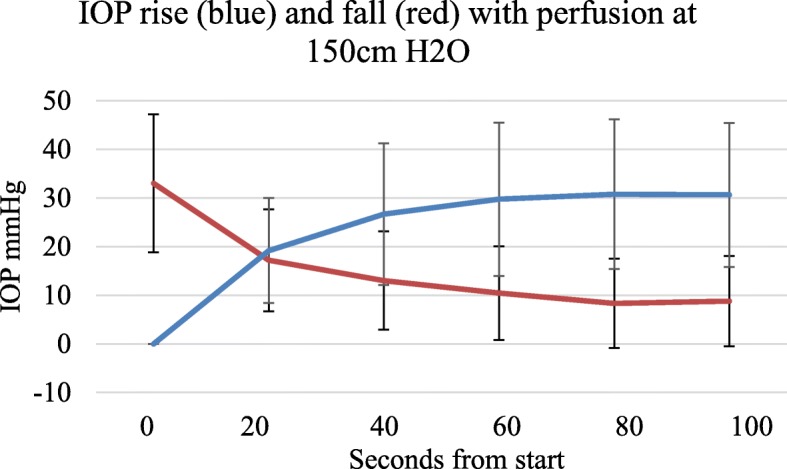
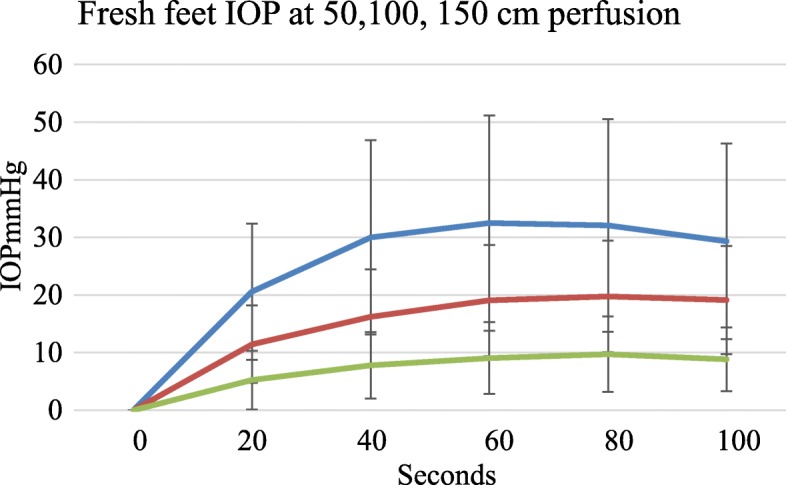
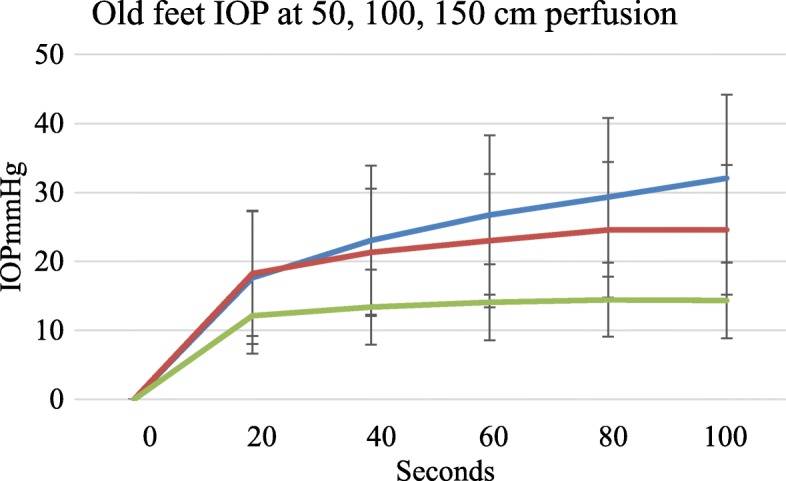
Results: There was a wide range in basal IOP with a mean IOP of 30.0 mmHg, SD 14.4, range 7.6 mmHg to 52.7 mmHg (n = 40 records) in 15 subjects. There was no significant difference between the three sites tested (p = 0.54, 0.12 and 0.051). At each individual site IOP correlated with perfusion pressure (r = 0.993). With a proximal venous tourniquet, IOP increased from 15.1 mmHg (SD 11.3 mmHg) to 44.9 mmHg (SD 24 mmHg), p < 0.0001, n = 9. Filling and emptying curves during perfusion and with using a tourniquet were similar, indicating that the model behaves in an elastic hydrodynamic manner. In fresh feet IOP peaked after about 1 min irrespective of perfusion pressure, possibly due to auto regulation. Older feet showed a continuously rising IOP and became oedematous. There was no significant difference in IOP between fresh and old feet perfused with serum at 150 cms pressure for 1 min.
Conclusion: Though basal intraosseous pressure varies, IOP behaves predictably. IOP measurements reflect the perfusion microclimate at the individual needle tip. This 3Rs compliant model will be used for further exploration of subchondral perfusion physiology with loading.
Keywords: In vitro model; Intraosseous pressure; Perfusion; Physiology; Subchondral; Tourniquet.
Conflict of interest statement
The authors declare that they have no competing interests.
Figures
Similar articles
-
Walking on water: subchondral vascular physiology explains how joints work and why they become osteoarthritic.EFORT Open Rev. 2023 Jun 8;8(6):436-442. doi: 10.1530/EOR-23-0002. EFORT Open Rev. 2023. PMID: 37289053 Free PMC article. Review.
-
Subchondral pressures and perfusion during weight bearing.J Orthop Surg Res. 2020 Jun 29;15(1):239. doi: 10.1186/s13018-020-01754-y. J Orthop Surg Res. 2020. PMID: 32600340 Free PMC article.
-
Factors affecting intraosseous pressure measurement.J Orthop Surg Res. 2018 Jul 28;13(1):187. doi: 10.1186/s13018-018-0877-z. J Orthop Surg Res. 2018. PMID: 30055642 Free PMC article.
-
Intraosseous pressure during loading and with vascular occlusion in an animal model.Bone Joint Res. 2018 Sep 15;7(8):511-516. doi: 10.1302/2046-3758.78.BJR-2017-0343.R2. eCollection 2018 Aug. Bone Joint Res. 2018. PMID: 30258570 Free PMC article.
-
[Ocular blood flow regulation in glaucoma - examination with the ocular pressure flow analyzer (OPFA)].Klin Monbl Augenheilkd. 2015 Feb;232(2):152-61. doi: 10.1055/s-0034-1396210. Epub 2015 Feb 20. Klin Monbl Augenheilkd. 2015. PMID: 25700253 Review. German.
Cited by
-
Walking on water: subchondral vascular physiology explains how joints work and why they become osteoarthritic.EFORT Open Rev. 2023 Jun 8;8(6):436-442. doi: 10.1530/EOR-23-0002. EFORT Open Rev. 2023. PMID: 37289053 Free PMC article. Review.
-
Subchondral physiology and vasculo-mechanical factors in load transmission and osteoarthritis.Bone Joint Res. 2021 Sep;10(9):571-573. doi: 10.1302/2046-3758.109.BJR-2021-0031.R1. Bone Joint Res. 2021. PMID: 34470462 Free PMC article. No abstract available.
-
Hydraulic Joint Function and Osteoarthritis.JBJS Rev. 2023 Dec 15;11(12):e23.00040. doi: 10.2106/JBJS.RVW.23.00040. eCollection 2023 Dec 1. JBJS Rev. 2023. PMID: 38100622 Free PMC article. Review.
-
Intraosseous pressure measurement during iliac bone marrow biopsy: its feasibility and difference of IOP in diseased marrow and non-diseased marrow.Skeletal Radiol. 2024 Mar;53(3):481-487. doi: 10.1007/s00256-023-04431-3. Epub 2023 Aug 28. Skeletal Radiol. 2024. PMID: 37635152
-
Subchondral pressures and perfusion during weight bearing.J Orthop Surg Res. 2020 Jun 29;15(1):239. doi: 10.1186/s13018-020-01754-y. J Orthop Surg Res. 2020. PMID: 32600340 Free PMC article.
References
-
- Arnoldi Carl C., Djurhuus J. C., Heerfordt J., Karle A. Intraosseous Phlebography, Intraosseous Pressure Measurements and99mTc-Polyphosphate Scintigraphy in Patients with Various Painful Conditions in the hip and Knee. Acta Orthopaedica Scandinavica. 1980;51(1-6):19–28. doi: 10.3109/17453678008990764. - DOI - PubMed
-
- Beverly M, Urban J, Murray D. Factors affecting physiology of intraosseous pressure measurement. Osteoarthr Cartil. 2016;24:S343–S343. doi: 10.1016/j.joca.2016.01.615. - DOI
-
- Bourne GH (1972) The biochemistry and physiology of bone Vol 2: physiology and pathology. In: The Biochemistry and Physiology of Bone, vol 2, 2nd edn. New York, London: Academic Press
LinkOut - more resources
Full Text Sources
