Comparative Study
. 2020 Jan;250(1):19-29.
doi: 10.1002/path.5344. Epub 2019 Oct 24.

Tumor mutational burden assessed by targeted NGS predicts clinical benefit from immune checkpoint inhibitors in non-small cell lung cancer

Affiliations
Comparative Study

Tumor mutational burden assessed by targeted NGS predicts clinical benefit from immune checkpoint inhibitors in non-small cell lung cancer

Ilaria Alborelli et al. J Pathol. 2020 Jan.

Abstract

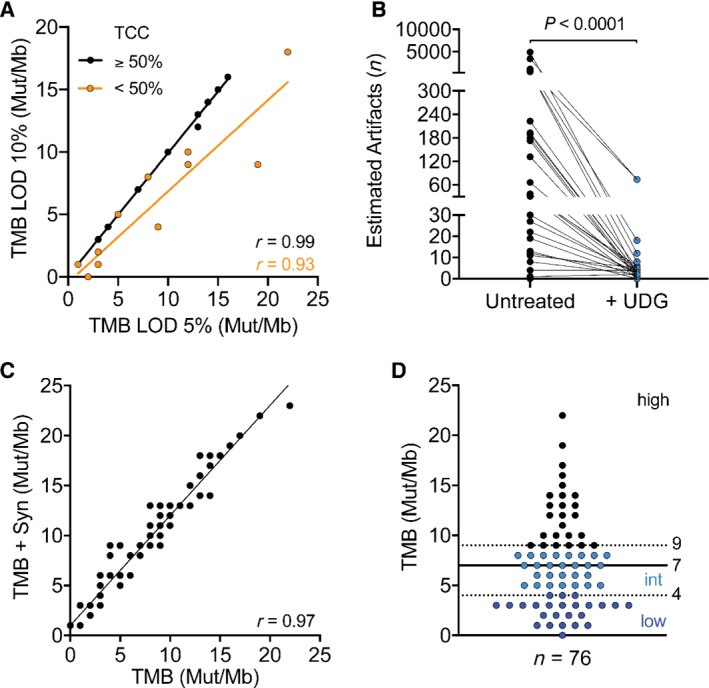
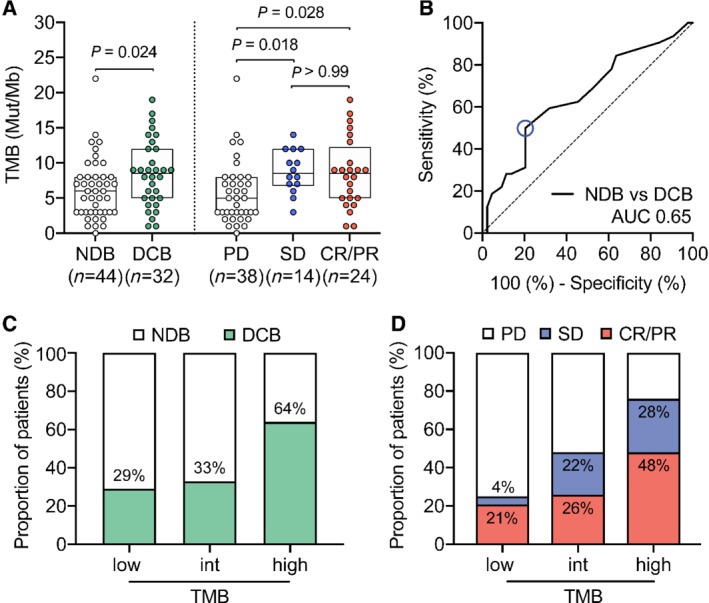
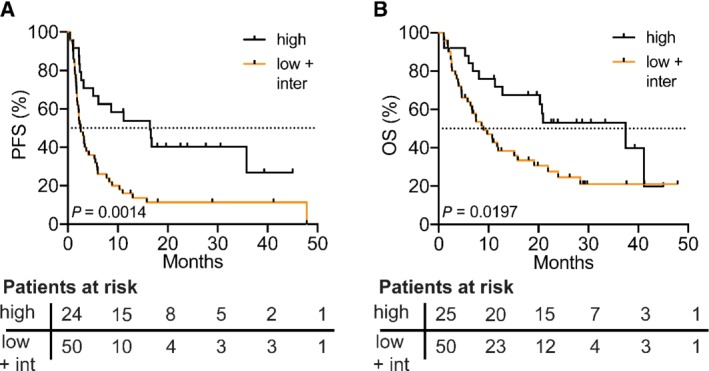
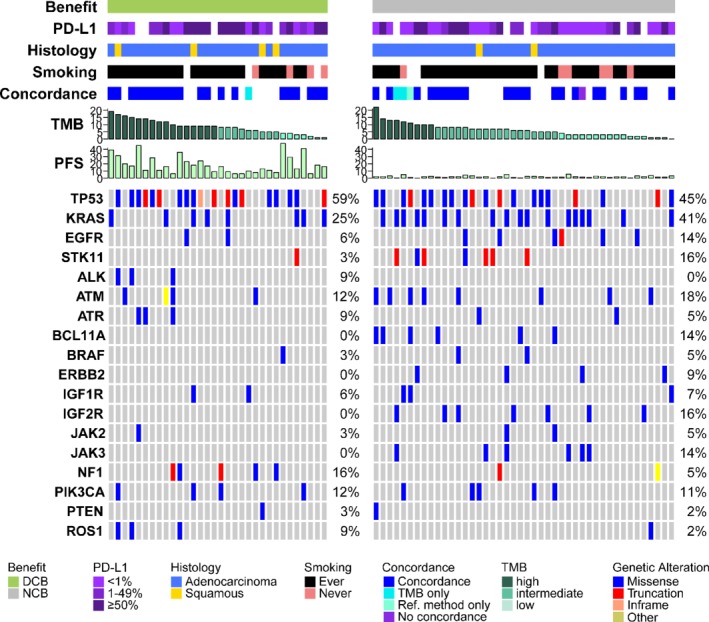
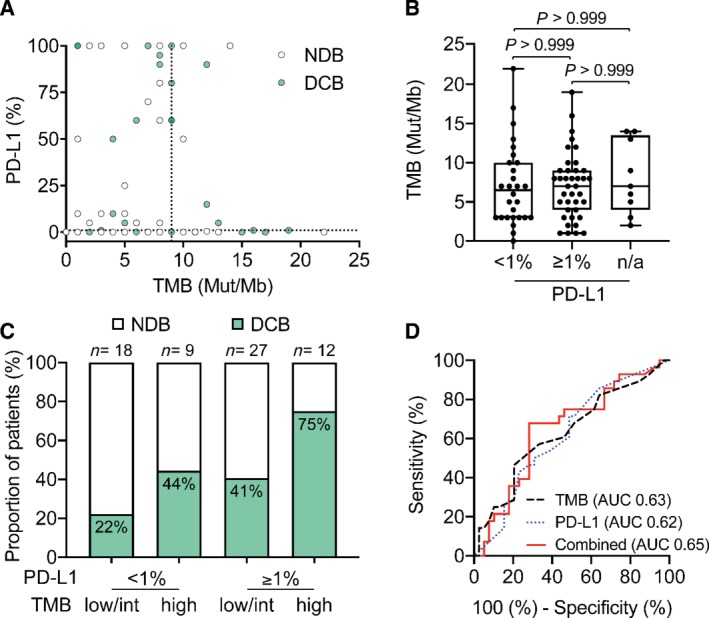
In non-small cell lung cancer (NSCLC), immune checkpoint inhibitors (ICIs) significantly improve overall survival (OS). Tumor mutational burden (TMB) has emerged as a predictive biomarker for patients treated with ICIs. Here, we evaluated the predictive power of TMB measured by the Oncomine™ Tumor Mutational Load targeted sequencing assay in 76 NSCLC patients treated with ICIs. TMB was assessed retrospectively in 76 NSCLC patients receiving ICI therapy. Clinical data (RECIST 1.1) were collected and patients were classified as having either durable clinical benefit (DCB) or no durable benefit (NDB). Additionally, genetic alterations and PD-L1 expression were assessed and compared with TMB and response rate. TMB was significantly higher in patients with DCB than in patients with NDB (median TMB = 8.5 versus 6.0 mutations/Mb, Mann-Whitney p = 0.0244). 64% of patients with high TMB (cut-off = third tertile, TMB ≥ 9) were responders (DCB) compared to 33% and 29% of patients with intermediate and low TMB, respectively (cut-off = second and first tertile, TMB = 5-9 and TMB ≤ 4, respectively). TMB-high patients showed significantly longer progression-free survival (PFS) and OS (log-rank test p = 0.0014 for PFS and 0.0197 for OS). While identifying different subgroups of patients, combining PD-L1 expression and TMB increased the predictive power (from AUC 0.63 to AUC 0.65). Our results show that the TML panel is an effective tool to stratify patients for ICI treatment. A combination of biomarkers might maximize the predictive precision for patient stratification. Our study supports TMB evaluation through targeted NGS in NSCLC patient samples as a tool to predict response to ICI therapy. We offer recommendations for a reliable and cost-effective assessment of TMB in a routine diagnostic setting. © 2019 The Authors. The Journal of Pathology published by John Wiley & Sons Ltd on behalf of Pathological Society of Great Britain and Ireland.

Keywords: NGS; NSCLC; TMB; cancer immunotherapy; checkpoint inhibitor.


Figures

Figure 1
Figure 1
Evaluation of pre‐analytical factors affecting TMB measurement. (A) Comparison of TMB analysis workflows based on either 5% or 10% limit of variant detection (LOD). Linear regression between the two workflows was calculated for samples with either ≥ 50% tumor cell content (TCC) (Spearman r = 0.99) or < 50% (orange; Spearman r = 0.93). (B) Estimation of deamination artifacts before and after treatment (blue dots) of input DNA with uracil‐DNA glycosylase (UDG) (Mann–Whitney p < 0.0001). (C) Linear regression of TMB assessed by using only non‐synonymous versus all mutations (Spearman r = 0.97). (D) Distribution of TMB values across the sample cohort (n = 76). Dashed lines indicate tertiles used to define low (dark blue dots, ≤ 4 Mut/Mb), intermediate (light blue dots, 5 < x < 9 Mut/Mb), and high TMB (≥ 9 Mut/Mb). Solid line indicates the median of all samples (7 Mut/Mb).
Figure 2
Figure 2
TMB correlates with response to ICI treatment in NSCLC patients. (A) Left panel: TMB in patients with NDB (n = 44, median = 6 Mut/Mb) versus patients with DCB (green, n = 32, median = 8.5 Mut/Mb) (Mann–Whitney p = 0.024). Right panel: TMB in patients with PD (n = 38, median = 5 Mut/Mb), SD (blue, n = 14, median = 8.5 Mut/Mb), and CR/PR (red, n = 24, median = 8.5 Mut/Mb) (Dunn's multiple comparisons test, p = 0.018, 0.028, and 0.99). (B) Receiver operating characteristic (ROC) curve to illustrate the ability of TMB to discriminate durable clinical benefit [NDB n = 44 versus DCB n = 32, AUC 0.65 (95% CI 0.52–0.78), p = 0.025]. (C) Percentage of patients with DCB (green) or (D) PD, SD (blue), CR/PR (red) falling into TMB‐low (≤ 4 Mut/Mb), ‐intermediate (5 < x < 9 Mut/Mb), and ‐high group (≥ 9 Mut/Mb).
Figure 3
Figure 3
PFS and OS in patients treated with ICI therapy increased in patients with high TMB. (A) PFS from start of immunotherapy in patients with high (≥ 9 Mut/Mb) versus low/intermediate (orange line, < 9 Mut/Mb) TMB [median 16.4 versus 2.6 months, Mantel–Haenszel hazard ratio 0.42 (95% CI 0.25–0.72), log‐rank Mantel–Cox test p = 0.0014]. (B) OS from start of immunotherapy in patients with high versus low/intermediate TMB [median 37.5 versus 9.0 months, Mantel–Haenszel hazard ratio 0.51 (95% CI 0.29–0.90), log‐rank Mantel–Cox test, p = 0.0197]. Patients at risk according to the time point written on the x‐axis of each graph are shown below each plot.
Figure 4
Figure 4
Overview of the clinical and molecular features associated with DCB and NDB in NSCLC patients treated with ICIs. Columns represent individual patients with DCB (green, left panel, n = 32) and NCB (grey, right panel, n = 44) and are sorted by descending TMB values. PD‐L1 expression is binned into < 1% (light purple), 1–49% (purple), and ≥ 50% (dark purple). Histology distinguishes between adenocarcinoma (blue) and squamous cell carcinoma (yellow). Smoking status is separated into ever‐ (black) and never‐smokers (pink). Concordance indicates the correlation between gene variants detected by the TMB compared with a reference molecular profiling method (further described in the Materials and methods section). TMB is shown in mutations/megabase in descending order and colored according to tertiles (from dark to light green = high to low). PFS is shown in months. Mutation frequencies are shown per gene and variant types are separated into missense (blue), truncation (red), inframe (orange), and other (yellow) variants. Patients for whom clinical data were not available are blank.
Figure 5
Figure 5
Multivariate analysis of PD‐L1 and TMB improves patient stratification into responders and non‐responders. (A) Correlation between TMB and PD‐L1 expression (n = 67, Spearman correlation r = 0.003, 95% CI −0.24 to 0.25). The dotted line indicates the cut‐off for TMB‐high classification (9 Mut/Mb). Patients with DCB are colored in green. (B) Distribution of TMB in PD‐L1‐negative (TPS < 1) (n = 28, median = 6.5 Mut/Mb), PD‐L1‐positive (TPS ≥1, n = 39, median = 7.0 Mut/Mb), and patients with unavailable data (n = 9, median = 7.0 Mut/Mb) (Dunn's multiple comparison test, all P values > 0.99). (C) Percentage of patients with DCB (green) with status of TMB‐low/int or ‐high in combination with PD‐L1 percentage < 1 or ≥ 1. (D) ROC curves for correlation of TMB (black dashed line, AUC = 0.63) and PD‐L1 expression (blue dotted line) (AUC 0.62) as single biomarkers or combined (red solid line) with DCB (AUC 0.65, 95% CI 0.51–0.78, p = 0.0395). Multivariate analysis was calculated using a linear model.

References

    1. Borghaei H, Paz‐Ares L, Horn L, et al Nivolumab versus docetaxel in advanced nonsquamous non‐small‐cell lung cancer. N Engl J Med 2015; 373: 1627–1639. - PMC - PubMed
    1. Brahmer J, Reckamp KL, Baas P, et al Nivolumab versus docetaxel in advanced squamous‐cell non‐small‐cell lung cancer. N Engl J Med 2015; 373: 123–135. - PMC - PubMed
    1. Reck M, Rodriguez‐Abreu D, Robinson AG, et al Pembrolizumab versus chemotherapy for PD‐L1‐positive non‐small‐cell lung cancer. N Engl J Med 2016; 375: 1823–1833. - PubMed
    1. Topalian SL, Hodi FS, Brahmer JR, et al Safety, activity, and immune correlates of anti‐PD‐1 antibody in cancer. N Engl J Med 2012; 366: 2443–2454. - PMC - PubMed
    1. Brahmer JR, Tykodi SS, Chow LQM, et al Safety and activity of anti‐PD‐L1 antibody in patients with advanced cancer. N Engl J Med 2012; 366: 2455–2465. - PMC - PubMed

MeSH terms