. 2019 Sep;28(18):4228-4241.
doi: 10.1111/mec.15216. Epub 2019 Sep 22.

Sex-specific changes in the aphid DNA methylation landscape

Affiliations

Sex-specific changes in the aphid DNA methylation landscape

Thomas C Mathers et al. Mol Ecol. 2019 Sep.

Abstract

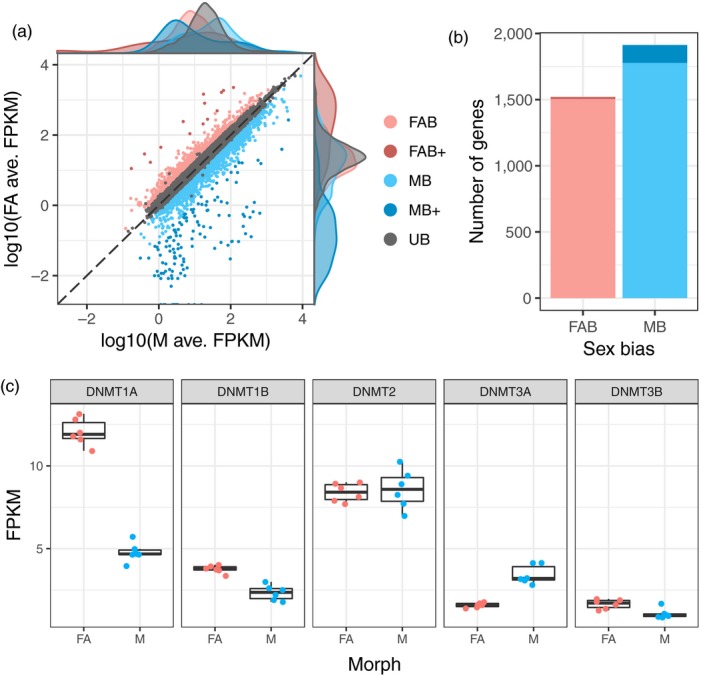
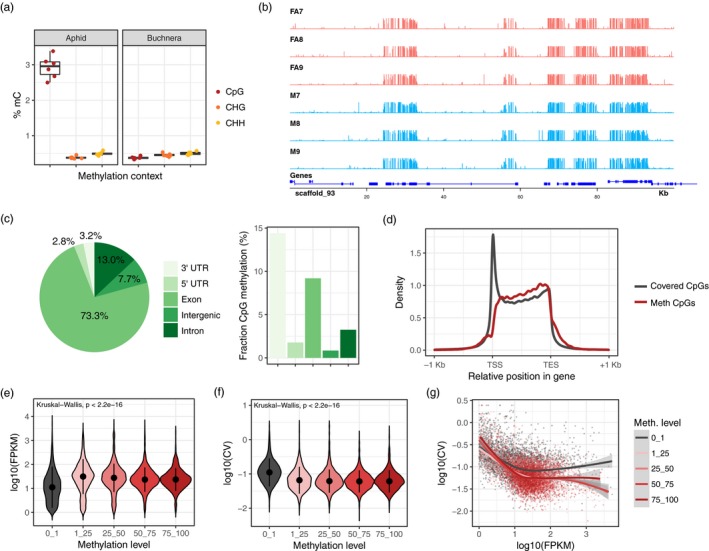
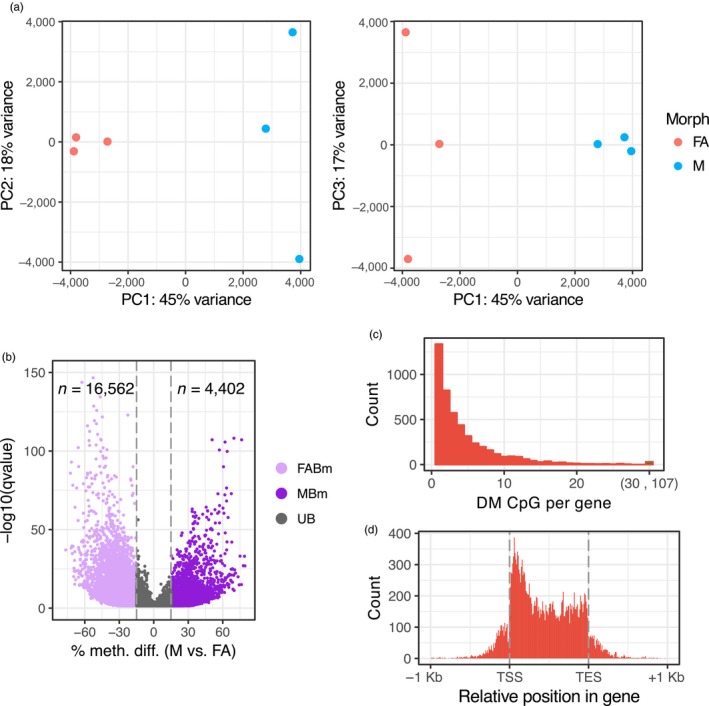
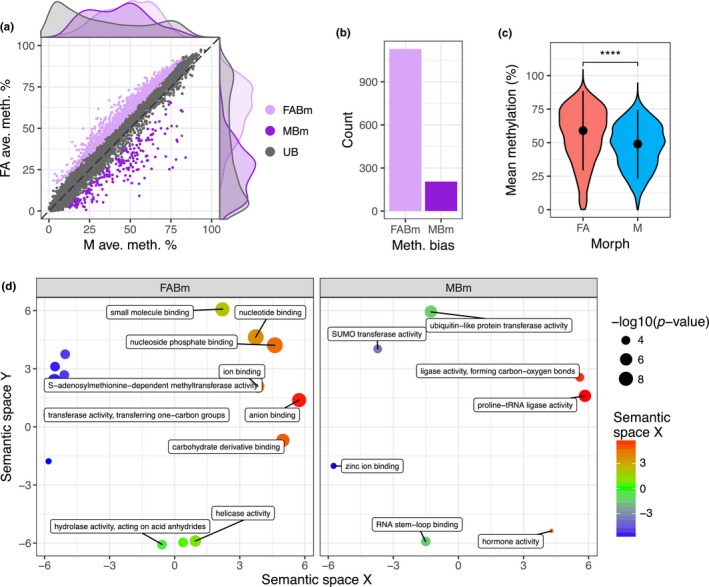
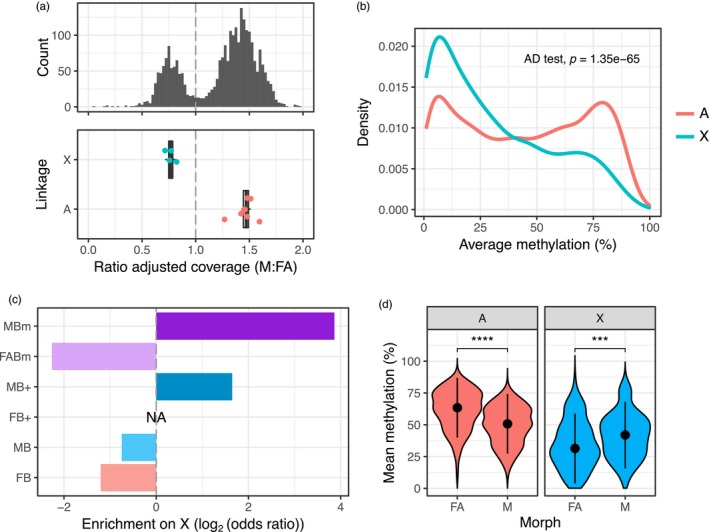
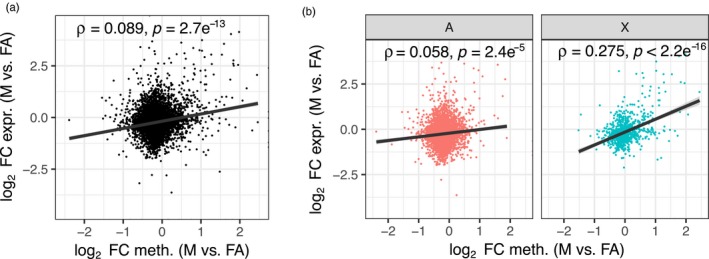
Aphids present an ideal system to study epigenetics as they can produce diverse, but genetically identical, morphs in response to environmental stimuli. Here, using whole genome bisulphite sequencing and transcriptome sequencing of the green peach aphid (Myzus persicae), we present the first detailed analysis of cytosine methylation in an aphid and investigate differences in the methylation and transcriptional landscapes of male and asexual female morphs. We found that methylation primarily occurs in a CG dinucleotide (CpG) context and that exons are highly enriched for methylated CpGs, particularly at the 3' end of genes. Methylation is positively associated with gene expression, and methylated genes are more stably expressed than unmethylated genes. Male and asexual female morphs have distinct methylation profiles. Strikingly, these profiles are divergent between the sex chromosome and the autosomes; autosomal genes are hypomethylated in males compared to asexual females, whereas genes belonging to the sex chromosome, which is haploid in males, are hypermethylated. Overall, we found correlated changes in methylation and gene expression between males and asexual females, and this correlation was particularly strong for genes located on the sex chromosome. Our results suggest that differential methylation of sex-biased genes plays a role in aphid sexual differentiation.

Keywords: Myzus persicae; dosage compensation; epigenetic regulation; sex chromosome; sex-biased gene expression.


Figures

Figure 1
Figure 1
Differential gene expression between Myzus persicae asexual females and males. (a) Male (M; x‐axis) and asexual female (FA; y‐axis) gene expression expressed as log10 fragments per kilobase of transcript per million mapped reads (FPKM) averaged over six biological replicates for genes retained for differential expression (DE) analysis with edgeR (n = 10,334). DE genes are coloured according to the direction and magnitude of sex‐bias (see main text). UB, unbiased expression (edgeR; Benjamini‐Hochberg [BH] corrected p > .05 and absolute fold change [FC] > 1.5). (b) Male‐biased (MB) genes significantly outnumber asexual female‐biased (FAB) genes. (c) Asexual females and males differ significantly in expression at two out of five DNA methyltransferase genes (DNMT1a and DNMT3a; edgeR; BH corrected p < .05 and FC > 1.5). Given that males are derived from asexual females, we can conclude that these genes are downregulated in males. DNMT1b and DNMT3b are also significantly downregulated in males (edgeR; BH corrected p = 6.35 × 10–6 and 0.039, respectively). However, the absolute FC of these genes falls below our cutoff of absolute FC > 1.5 (FC = 1.42 and 1.35, respectively) [Colour figure can be viewed at http://wileyonlinelibrary.com]
Figure 2
Figure 2
The Myzus persicae methylome. (a) Boxplots indicate the proportion of methylated cytosines (mC) by sequence context (CpG, CHG and CHH) for M. persicae and its obligate endosymbiont Buchnera aphidicola, which lacks a functional methylation system. (b) Example genome browser view shows the distribution of CpG methylation in asexual females and males across the first 100 Kb of scaffold_93. (c) The distribution of methylated CpGs across genomic features and the proportion of methylated CpGs in each feature. Methylated and unmethylated CpG counts were summed across all replicates. (d) The distribution of all covered CpG sites (minimum of five reads per sample) and significantly methylated CpG sites (binomial test, BH‐corrected p < .05) across M. persicae gene bodies. TSS, transcription start site; TES, transcription end site. A large spike of covered CpG sites was observed at the TSS. However, the density of methylated sites at the TSS was low contrary to what is observed in plants and humans (Eckhardt et al., 2006). (e) The distribution of RNA‐seq expression levels in asexual females (log10 FPKM) for unmethylated (0%–1% CpG methylation) and methylated genes (grouped in methylation bins of 25% increments). FPKM, fragments per kilobase of transcript per million. Expression values were averaged across six biological replicates and methylation levels averaged across three biological replicates. Only genes with average expression levels of at least 1 FPKM in males and asexual females were included. Dots and whiskers inside the violin plots indicate median and interquartile range respectively. (f) As for (e) but showing the distribution of variation in expression between the six asexual female RNA‐seq replicates (measured as the log10 transformed coefficient of variation (log10 CV) of FPKM) for unmethylated (0%–1% CpG methylation) and methylated genes. (g) The relationship between the mean and the CV of gene expression for unmethylated and methylated genes with a trend line for each methylation level shown as a LOESS‐smoothed line with shaded areas indicating the 95% CI. The difference between the grey (unmethylated; 0%–1% CpG methylation) and pink/red lines (methylated; >1% CpG methylation) shows that methylation is associated with reduced between‐replicate variation in gene expression, particularly in highly expressed genes. The negative correlation and downwards slope of trend lines shows that higher expressed genes are better canalized, showing less between‐individual variation in gene expression [Colour figure can be viewed at http://wileyonlinelibrary.com]
Figure 3
Figure 3
Differential methylation between Myzus persicae asexual female and male morphs. (a) Principle component analysis (PCA) based on methylation levels at 350,782 CpG sites significantly methylated in at least one sample. PC1 separates the samples based on sex (45% of the variation), whilst PC2 and PC3 seperate male and asexual female replicates, respectively (explaining 18% to 17% of the variation). (b) Volcano plot showing results of MethylKit (Akalin et al., 2012) site‐wise tests of differential methylation between asexual females (FA) and males (M). Methylation differences are shown for M relative to FA. Only CpG sites showing significant differential methylation (DM) (BH corrected p < .05) are shown. A minimum methylation difference threshold of 15% per site was applied to define a site DM between FA and M. MBm, male‐biased methylation; FABm, female‐biased methylation; UB, unbiased methylation. (c) The number of differentially methylated sites per gene (±1 Kb flanking region). DM, differentially methylated. (d) The distribution of DM CpG sites along M. persicae gene bodies. TSS, transcription start site; TES, transcription end site [Colour figure can be viewed at http://wileyonlinelibrary.com]
Figure 4
Figure 4
Genome‐wide changes in gene body methylation between asexual female and male morphs. (a) Male (M; x‐axis) and asexual female (FA; y‐axis) gene‐wise methylation levels averaged over three biological replicates for genes methylated >1% in at least one of the two morphs (n = 6,699). Differentially methylated (DM) genes (MethylKit; >10% methylation difference, BH corrected p < .05) are coloured according to the direction of sex‐bias: MBm, male‐biased methylation; FABm, female‐biased methylation; UB, unbiased methylation. (b) FABm genes outnumber MBm genes. (c) Violin plot showing the distribution of mean methylation level in FA and M for DM genes. Dots and whiskers indicate median and interquartile range, respectively; ****Wilcoxon signed‐rank test p < .0001. (d) Enriched GO terms relating to molecular function plotted in semantic space for FABm genes and MBm genes (for terms relating to biological process see Figure S3). GO terms are arranged in the semantic space according to their similarity in physiological and metabolically processes, as well as their functional categories, which reflects their biological meaning. A full list of enriched GO terms for each DM class and functional category is given in Table S8) [Colour figure can be viewed at http://wileyonlinelibrary.com]
Figure 5
Figure 5
Distinct patterns of methylation and expression between the Myzus persicae X chromosome and autosomes. (a) X‐linked and autosomal scaffolds (≥20 Kb) in the M. persicae genome were identified based on the relative coverage of BS‐seq reads in males (M) compared to asexual females (FA). Given the XO sex determination system of aphids, X‐linked scaffolds are predicted to have half autosomal coverage in males. A bimodal distribution in the ratio of M to FA coverage is clearly visible (upper panel). We considered scaffolds falling in the lower coverage peak (ratio of adjusted coverage < 1) as X‐linked and scaffolds in the second, higher coverage peak (ratio of adjusted coverage > 1), as autosomal. The assignment of scaffolds to the X chromosome or autosomes was validated by comparing the M:FA ratio of coverage for scaffolds containing microsatellite markers on the X‐chromosome (blue dots) and autosome (red dots) (lower panel). (b) The distribution of gene body methylation levels for X‐linked and autosomal genes analysed in asexual females, averaged over all three replicates. (c) Observed/expected (odds ratio) counts of DM and DE genes on the X chromosome by expression or methylation bias category. The X chromosome is significantly enriched for genes with strongly male‐biased expression (MB+, ≥10‐fold upregulation in M) and genes with male‐biased methylation (MBm). (d) The distribution of mean methylation levels in asexual females (FA) and males (M) for X‐linked and autosomal DM genes (MethylKit; >10% methylation difference, BH corrected p < .05). Methylation levels are significantly higher in FA than M for autosomal genes, whereas M have a higher methylation than FA in X‐linked genes (d) dots and whiskers inside the violin plots indicate median and interquartile range, respectively; ***Wilcoxon signed‐rank test p < .001 ****p < .0001 [Colour figure can be viewed at http://wileyonlinelibrary.com]
Figure 6
Figure 6
Correlated changes in expression and methylation between asexual females and males. (a) Scatter plot showing the relationship between fold‐change (FC) in gene expression and methylation between asexual females (FA) and males (M) for genes expressed (>1 FPKM) and methylated (>1%) in at least one of the sexes (n = 6,699). Methylation levels of genes were estimated across the whole gene body and averaged across replicates. Positive values indicate increased expression or methylation in males, relative to asexual females; negative values indicate increased expression or methylation in asexual females, relative to males. (b) The correlation between gene expression changes and methylation changes between FA and M is significantly stronger for X‐linked genes (X; n = 925) than autosomal genes (A; n = 5,272). Spearman's ρ was used to assess significance and strength of the relationship between change in expression and methylation for each set of genes. The trend lines indicate linear fit with shaded areas indicating 95% confidence intervals [Colour figure can be viewed at http://wileyonlinelibrary.com]

References

    1. Akalin, A. , Kormaksson, M. , Li, S. , Garrett‐Bakelman, F. E. , Figueroa, M. E. , Melnick, A. , & Mason, C. E. (2012). methylKit: A comprehensive R package for the analysis of genome‐wide DNA methylation profiles. Genome Biology, 13, R87 10.1186/gb-2012-13-10-r87 - DOI - PMC - PubMed
    1. Albritton, S. E. , Kranz, A. L. , Rao, P. , Kramer, M. , Dieterich, C. , & Ercan, S. (2014). Sex‐biased gene expression and evolution of the X chromosome in nematodes. Genetics, 197, 865–883. 10.1534/genetics.114.163311 - DOI - PMC - PubMed
    1. Allis, C. D. , & Jenuwein, T. (2016). The molecular hallmarks of epigenetic control. Nature Reviews Genetics, 17, 487–500. 10.1038/nrg.2016.59 - DOI - PubMed
    1. Benjamini, Y. , & Hochberg, Y. (1995). Controlling the false discovery rate: A practical and powerful approach to multiple testing. Journal of the Royal Statistical Society, 57, 289–300. 10.1111/j.2517-6161.1995.tb02031.x - DOI
    1. Bestor, T. H. , Edwards, J. R. , & Boulard, M. (2014). Notes on the role of dynamic DNA methylation in mammalian development. Proceedings of the National Academy of Sciences of the USA, 112, 6796–6799. - PMC - PubMed

Publication types

Associated data

LinkOut - more resources