Review
. 2020 Jan:74:100774.
doi: 10.1016/j.preteyeres.2019.100774. Epub 2019 Aug 28.

Lessons learned from quantitative fundus autofluorescence

Affiliations
Review

Lessons learned from quantitative fundus autofluorescence

Janet R Sparrow et al. Prog Retin Eye Res. 2020 Jan.

Abstract

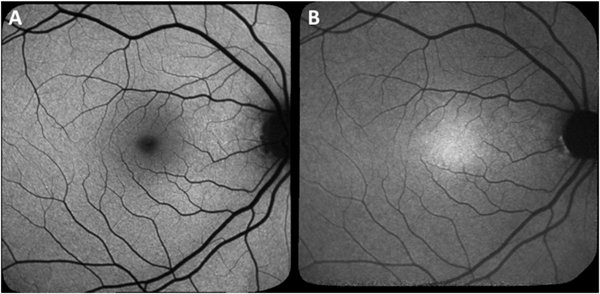
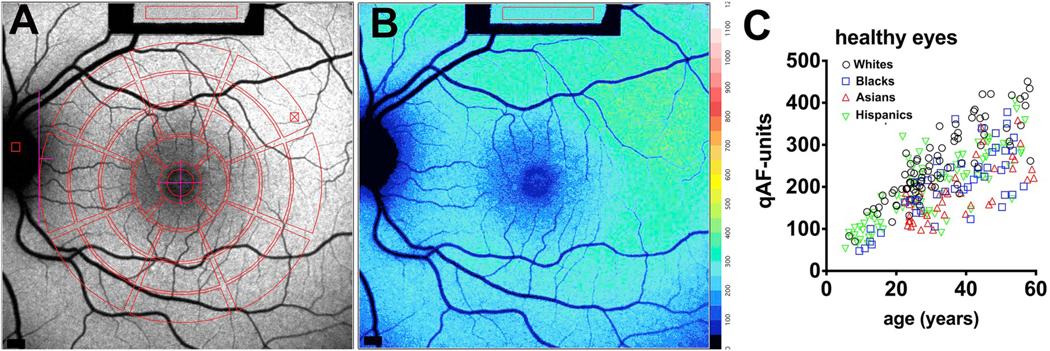
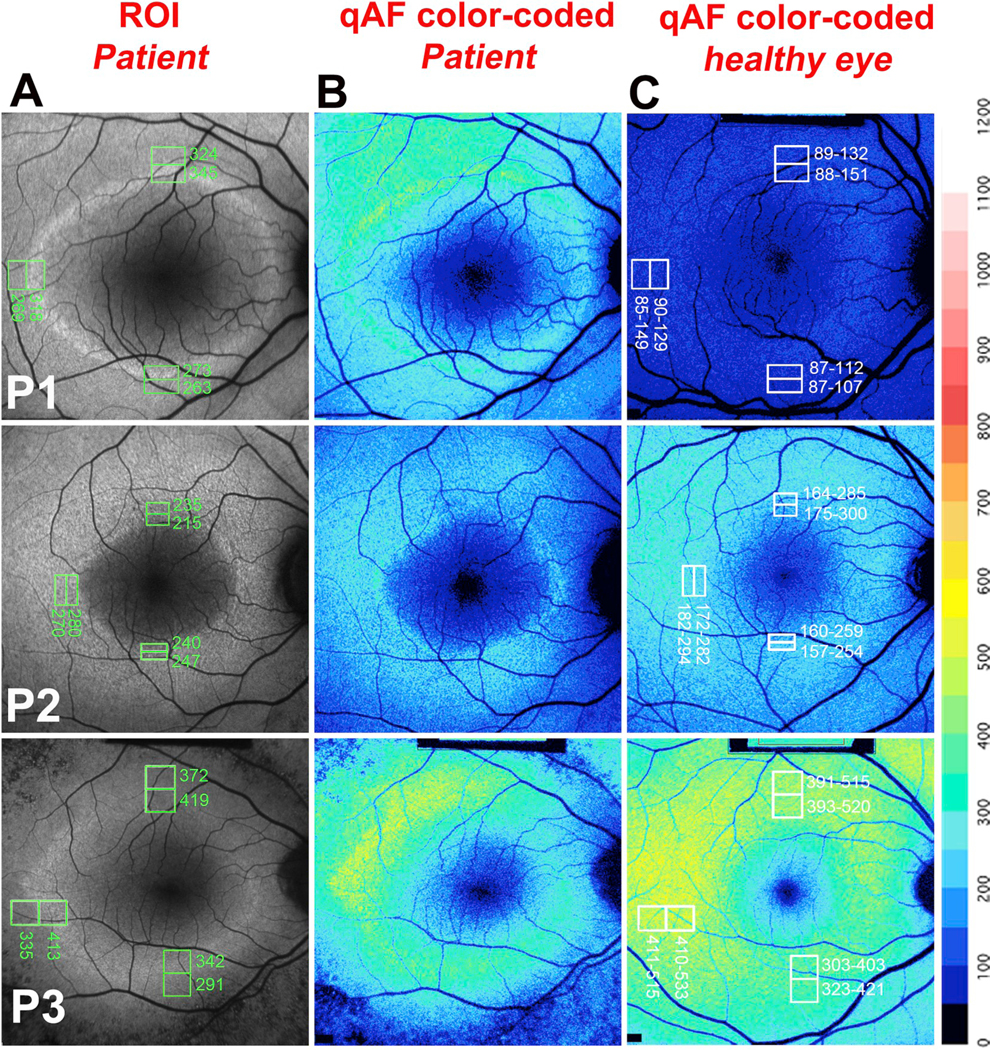
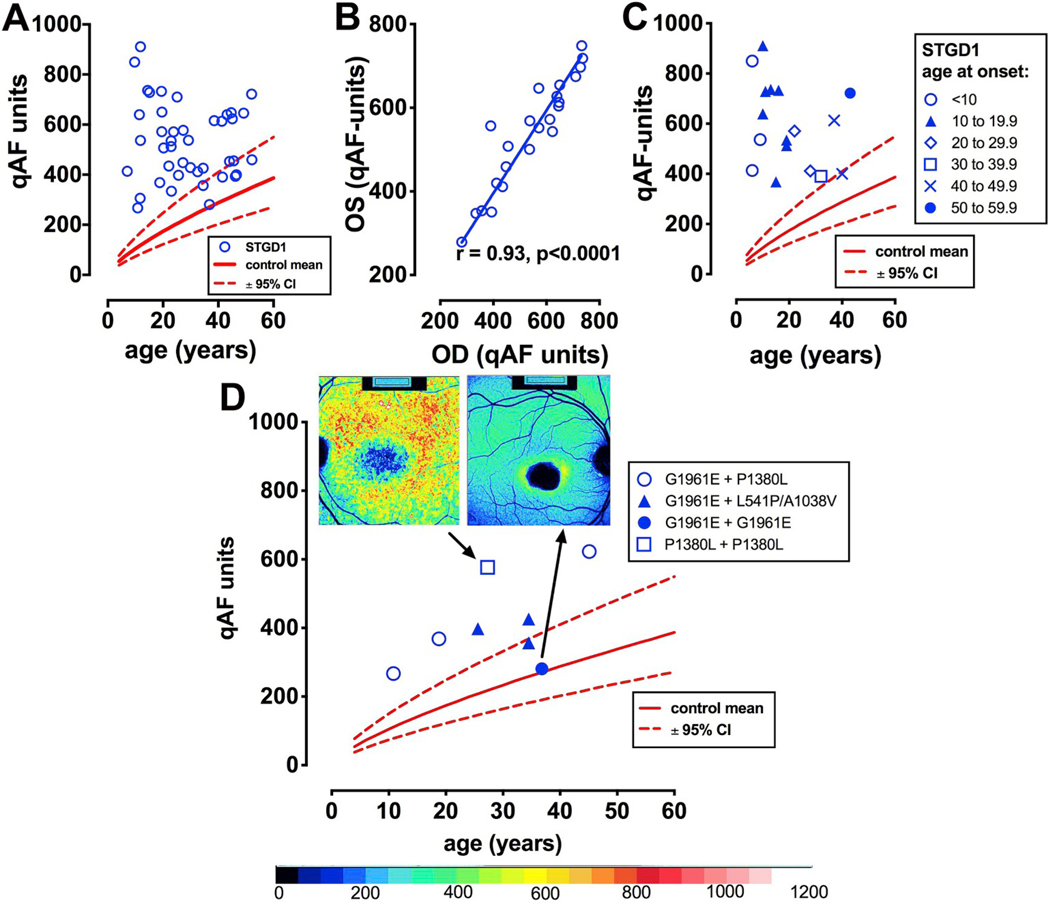
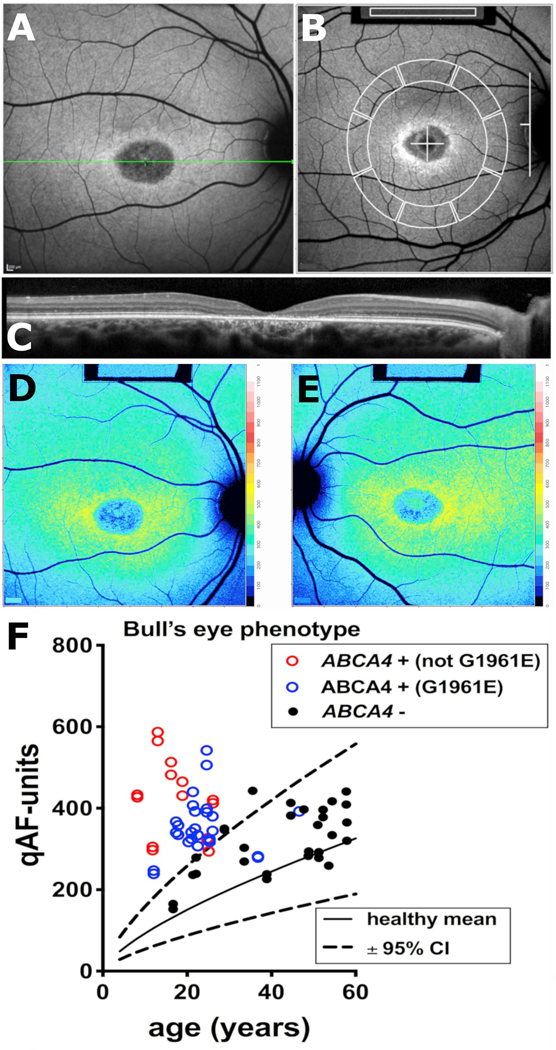
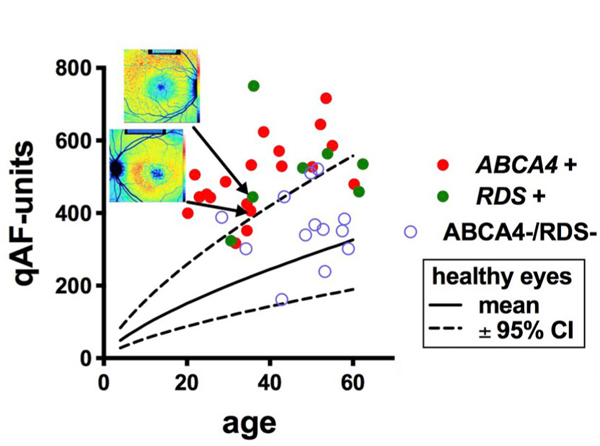
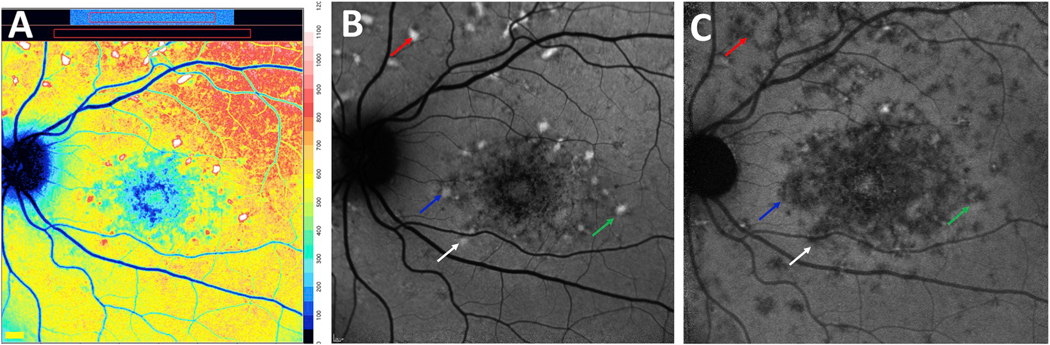
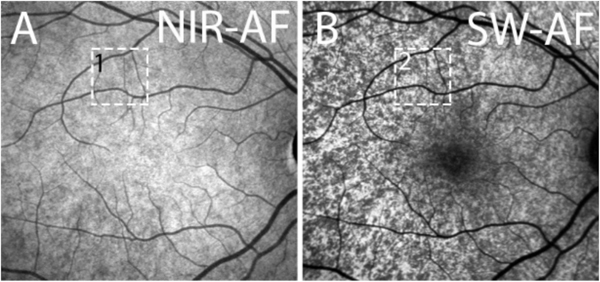
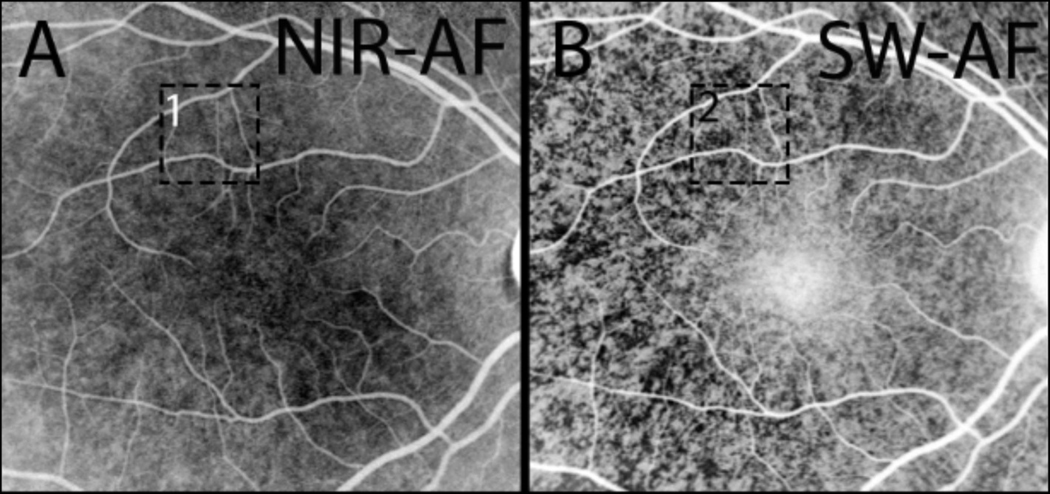
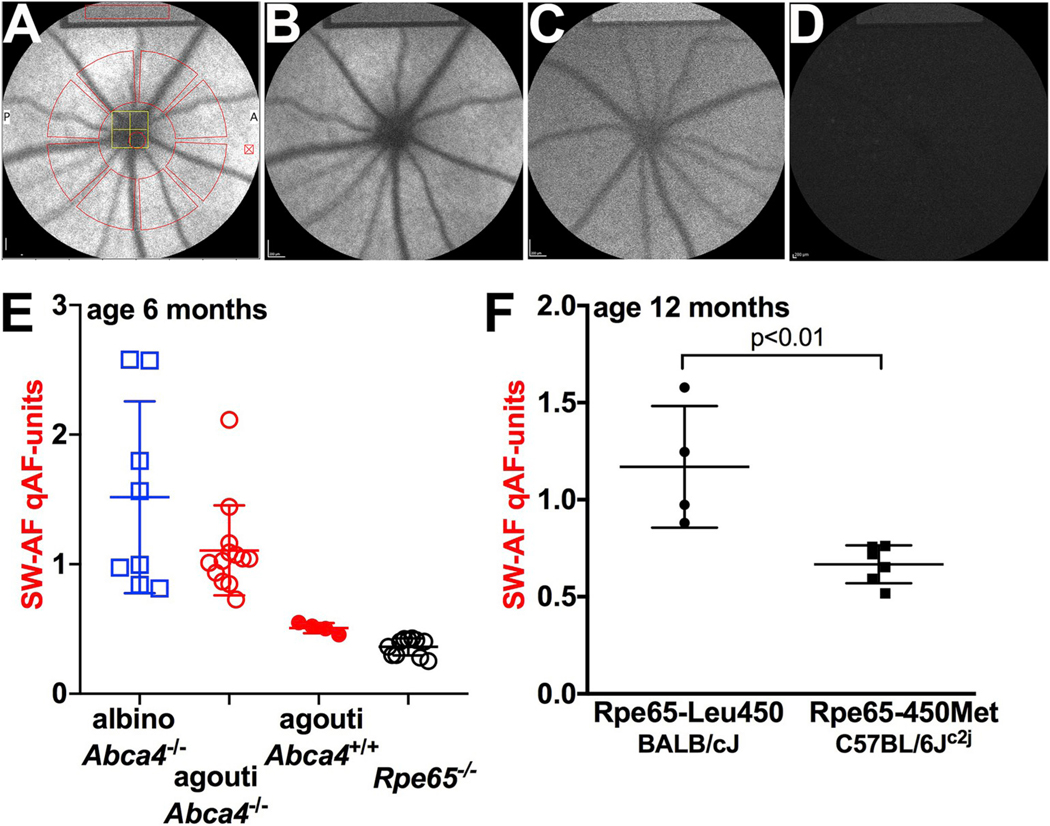
Quantitative fundus autofluorescence (qAF) is an approach that is built on a confocal scanning laser platform and used to measure the intensity of the inherent autofluorescence of retina elicited by short-wavelength (488 nm) excitation. Being non-invasive, qAF does not interrupt tissue architecture, thus allowing for structural correlations. The spectral features, cellular origin and topographic distribution of the natural autofluorescence of the fundus indicate that it is emitted from retinaldehyde-adducts that form in photoreceptor cells and accumulate, under most conditions, in retinal pigment epithelial cells. The distributions and intensities of fundus autofluorescence deviate from normal in many retinal disorders and it is widely recognized that these changing patterns can aid in the diagnosis and monitoring of retinal disease. The standardized protocol employed by qAF involves the normalization of fundus grey levels to a fluorescent reference installed in the imaging instrument. Together with corrections for magnification and anterior media absorption, this approach facilitates comparisons with serial images and images acquired within groups of patients. Here we provide a comprehensive summary of the principles and practice of qAF and we highlight recent efforts to elucidate retinal disease processes by combining qAF with multi-modal imaging.

Keywords: ABCA4; Acute zonal occult outer retinopathy; Age-related macular degeneration; Confocal scanning laser ophthalmoscopy; Fundus; Fundus autofluorescence; Quantitative fundus autofluorescence; Recessive stargardt disease; Retina; Retinitis pigmentosa.


Figures

Fig. 1.
Fig. 1.
Fundus autofluorescence imaging by confocal scanning laser ophthalmoscopy. A. Short-wavelength fundus autofluorescence, 488 nm excitation. B. Near-infrared fundus autofluorescence, 787 nm excitation.
Fig. 2.
Fig. 2.
Quantitative fundus autofluorescence (qAF) in healthy eyes. A. Short-wavelength fundus autofluorescence image with overlapping measurement grid. Mean grey levels are acquired within segments (8) of three concentric rings (outer, middle, inner) and a circular foveal area. The middle ring is commonly used for quantitation as uniformity was determined to be highest in this area. Values are normalized to grey levels in the internal reference (rectangle at top of image). B. Color-coded qAF image acquired from the same eye as shown in A. Lower qAF values are coded in blue and higher levels in red (see color-code scale). C. qAF values plotted for subjects (age 5–60 years) with healthy eye status. Mean qAF8 intensity units (qAF-units) were obtained by averaging the 8 segments in the middle ring shown in A. qAF-units are plotted as function of age; race/ethnicities of the subjects are indicated. Adapted from Greenberg et al. (2013). (For interpretation of the references to color in this figure legend, the reader is referred to the Web version of this article.)
Fig. 3.
Fig. 3.
Multimodal imaging in patients exhibiting Bestrophin-1 (BEST1) mutations. A. Quantitative fundus autofluorescence (qAF). Color-coded image of vitelliruptive stage. Lowest values are indicated in blue and highest values in red. B. Short-wavelength fundus autofluorescence (SW-AF) image with overlapping qAF measurement grid. Mean grey levels in the segments were normalized to the internal reference (not shown in this image). C and D. Vitelliruptive stage presented in near-infrared (NIR-AF) (C) and SW-AF (D) images. E. Spectral domain optical coherence tomography. Within the lesion (horizontal scan, line 1), the hyperreflective interdigitation zone (IZ) is disorganized. Outer segments project into the fluid-filled lesion. Inferiorly (line 2), the hyperreflective projection is suggestive of a fibrotic scar within the central lesion. Adapted from Lima de Carvalho et al. (2019). (For interpretation of the references to color in this figure legend, the reader is referred to the Web version of this article.)
Fig. 4.
Fig. 4.
Quantitative fundus autofluorescence in Best vitelliform macular dystrophy patients (BVMD). qAF values of BVMD patients (27 eyes of 16 patients) (red circles) and healthy eyes (black open circles) are plotted as a function of age. Means are indicated by solid lines. The disease stages include: sub-clinical, 9 eyes; vitelliform, 3 eyes; pseudohypopon, 2 eyes; vitelliruptive, 12 eyes; atrophic, 1 eye. Adapted from Duncker et al. (2014). (For interpretation of the references to color in this figure legend, the reader is referred to the Web version of this article.)
Fig. 5.
Fig. 5.
Quantitative fundus autofluorescence in retinitis pigmentosa. P, Patient. A. Representative short-wavelength fundus autofluorescence (SW-AF) images of RP patients are presented together with the positions of regions of interest (ROI) measurement areas (green rectangles) and corresponding qAF values. B. Color coded maps of qAF in patients with RP. C. Color coded maps of qAF of age-similar healthy eyes. A color scale of qAF-units (0–1200) is provided on the right margin. P1 is representative of a characteristic SW-AF ring with ROI-qAF being outside the 95% confidence (CI) of healthy individuals. P2 and P3 are examples of patients with ROI-qAF values within the 95% CI. Adapted from Schuerch et al. (2017). (For interpretation of the references to color in this figure legend, the reader is referred to the Web version of this article.)
Fig. 6.
Fig. 6.
Quantitative fundus autofluorescence in recessive Stargardt disease (STGD1). A. qAF8 values (blue circles) are plotted as a function of age. Comparison is made to mean (solid red line) and 95% confidence intervals (dashed lines) for healthy eyes. B. Linear regression analysis indicates good correspondence between left (OS) and right (OD) eyes. C. Early age of STGD1-onset can be associated with higher levels of qAF. D. qAF8 versus age is plotted in relationship to some homozygous (p.G1961E; p. P1380L) and compound heterozygous (p.[G1961E; P1380L] [p.G1961E; p. L541/A1038V]) ABCA4 mutations. Insets at top, color-coded images and corresponding qAF values are shown for patients carrying homozygous G1961E and P1380L mutations. Adapted from Burke et al. (2014). (For interpretation of the references to color in this figure legend, the reader is referred to the Web version of this article.)
Fig. 7.
Fig. 7.
Fig. 7. Quantitative fundus autofluorescence in patients exhibiting bull’s eye lesions. A. Short-wavelength fundus autofluorescence image presenting with a central bull’s eye phenotype. B. qAF8 was calculated from mean grey levels recorded within 8 circularly arranged segments positioned with 7°–9° eccentricity. Grey levels within the internal reference (rectangle, top of image) were used to correct for sensitivity and laser power. C. Spectral domain optical coherence tomography. Atrophy of the outer nuclear layer, ellipsoid zone and interdigitation zone are appreciated along with hypertransmission of signal into the choroid. D, E. Color-coded qAF images of bull’s eye lesions (OD, OS) in a patient positive for ABCA4 mutations. Patient age 17 years. F. qAF values are plotted as a function of age for patients carrying ABCA4 mutations (ABCA4 +) not including the p. G1961E mutation (red circle); ABCA4 mutations including p. G1961E (blue circles); and patients who were negative for ABCA4 mutations (ABCA4 -) (black symbols) but exhibited a bull’s eye phenotype. Comparison is also made to mean (solid black line) and 95% confidence intervals (dashed lines) of healthy eyes. E. Adapted from Duncker et al. (2015b). (For interpretation of the references to color in this figure legend, the reader is referred to the Web version of this article.)
Fig. 8.
Fig. 8.
Quantitative fundus autofluorescence (qAF8) in patients presenting with a pattern dystrophy phenotype. qAF8 is plotted as a function of age. Genetic analysis revealed mutations in ABCA4 (ABCA4 +) or peripherin2/RDS (RDS +) or neither (ABCA4 -/RDS-). The pattern dystrophy phenotype was defined as a central atrophy with a jagged border, mottling and flecks. Insets at top, color-coded qAF images are shown for patients carrying mutations in ABCA4 and RDS. Adapted from Duncker et al. (2015c). (For interpretation of the references to color in this figure legend, the reader is referred to the Web version of this article.)
Fig. 9.
Fig. 9.
Short-wavelength (SW-AF) and near infrared fundus autofluorescence (NIR-AF) images acquired from patients with recessive Stargardt disease. A. Color-coded quantitative fundus autofluorescence image. B. SW-AF image. C. NIR-AF image. Flecks are indicated with colored arrows to denote correspondence in the SW-AF and NIR-AF modalities. Many flecks that are bright in the SW-AF image are hypoautofluorescent in the NIR-AF image. (For interpretation of the references to color in this figure legend, the reader is referred to the Web version of this article.)
Fig. 10.
Fig. 10.
Fundus flecks in a recessive Stargardt patient. A. Flecks visualized in color-coded quantitative fundus autofluorescence images (qAF color map) (A, D) are shown together with the corresponding short-wavelength fundus autofluorescence (SW-AF, 488 nm excitation) (B, C) images. OD (A, B) and OS (C, D). Serial images were acquired at a 15-month (1, 2) and 18-month (2, 3) intervals. Note that the qAF intensity of flecks increases with time (transition from red to white coding; A1 to A2, D1 to D2) and flecks coded white have the highest qAF intensity in the images. After 18 months (A2–3; D2–3) fleck intensity faded (white transition to yellowcoded flecks). Adapted from Paavo et al. (2019). (For interpretation of the references to color in this figure legend, the reader is referred to the Web version of this article.)
Fig. 11.
Fig. 11.
Near-infrared autofluorescence (787 nm) and short-wavelength autofluorescence (488 nm) images of a GPR143/OA1 carrier of albinism. In NIR-AF images (A) acquired from GPR143/OA1 carriers, the non-uniform fundus pigmentation presents centrally as patches of brightness (melanin pigment) that alternate with patches of darkness (melanin-deficient). The pattern is reversed in the SW-AF image (B). Adapted from Paavo et al. (2018).
Fig. 12.
Fig. 12.
Quantitative fundus autofluorescence (qAF) in the mouse. A. Short-wavelength (SW) fundus AF image with measurement grid overlaid; the latter is used to acquire grey levels for qAF calculation. SW-AF image of agouti Abca4−/− mouse (B) agouti Abca4+/+ (C) and Rpe65−/− (D). Note the internal reference (rectangle) at the top of the images. A darker reference is indicative of the use of a reduced sensitivity setting for imaging and thus higher qAF. E. qAF in mice varying in genotype (Abca4−/−, Abca4+/+ and Rpe65−/−) and coat-color (albino, agouti, black). F. qAF is higher in Rpe65-Leu450 mice (BALB/cJ) than in Rpe65-450Met (C57BL/6Jc2j). (For interpretation of the references to color in this figure legend, the reader is referred to the Web version of this article.)
Fig. 13.
Fig. 13.
Vitamin E-mediated protection against photoxidation and photodegradation of bisretinoid in Abca4−/− mice. Vitamin E supplementation results in elevated qAF (A), elevated bisretinoid measured by HPLC (B) and reduction of the outer nuclear layer thinning characteristic of these mice (C). Adapted from Ueda et al., 2016.

Similar articles

Cited by

References

    1. Aizawa S, Mitamura Y, Hagiwara A, Sugawara T, Yamamoto S, 2010. Changes of fundus autofluorescence, photoreceptor inner and outer segment junction line, and visual function in patients with retinitis pigmentosa. Clin. Exp. Ophthalmol 38, 597–604. - PubMed
    1. ANSI, 2014. American National Standard for Safe Use of Lasers. (ANSI Z136.1). Laser Institute of America, Orlando, FL.
    1. Bakall B, Radu RA, Stanton JB, Burke JM, McKay BS, Wadelius C, Mullins RF, Stone EM, Travis GH, Marmorstein AD, 2007. Enhanced accumulation of A2E in individuals homozygous or heterozygous for mutations in BEST1 (VMD2). Exp. Eye Res 85, 34–43. - PubMed
    1. Bassuk AG, Sujirakul T, Tsang SH, Mahajan VB, 2014. A novel RPGR mutation masquerading as Stargardt disease. Br. J. Ophthalmol 98, 709–711. - PMC - PubMed
    1. Ben-Shabat S, Itagaki Y, Jockusch S, Sparrow JR, Turro NJ, Nakanishi K, 2002. Formation of a nona-oxirane from A2E, a lipofuscin fluorophore related to macular degeneration, and evidence of singlet oxygen involvement. Angew. Chem. Int. Ed 41, 814–817. - PubMed

Publication types

MeSH terms