. 2019 Nov 15:202:116131.
doi: 10.1016/j.neuroimage.2019.116131. Epub 2019 Aug 28.

Differential tractography as a track-based biomarker for neuronal injury

Affiliations

Differential tractography as a track-based biomarker for neuronal injury

Fang-Cheng Yeh et al. Neuroimage. .

Abstract

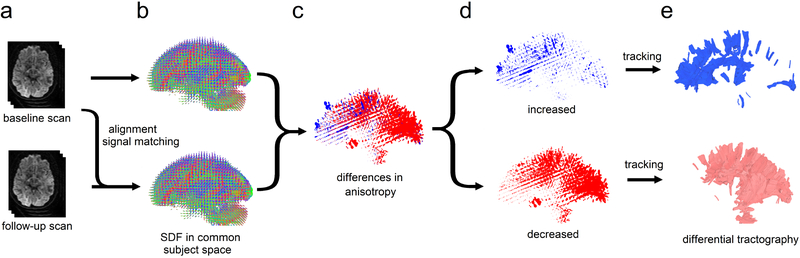
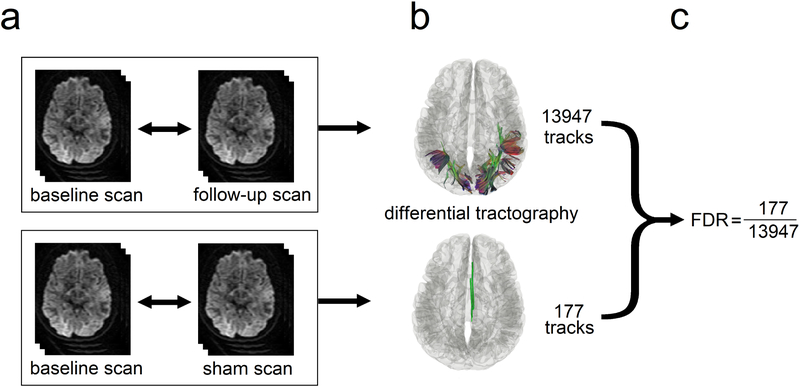
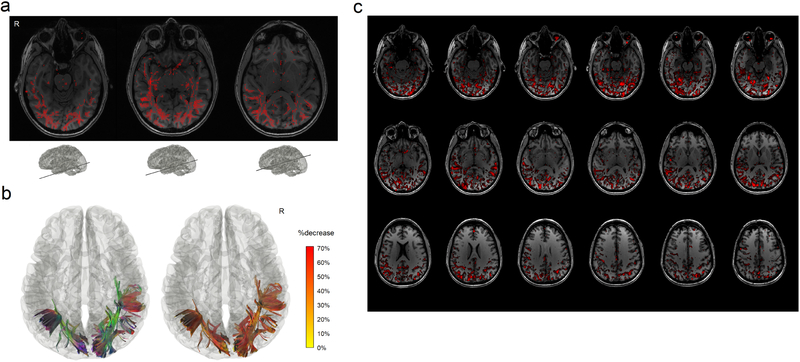
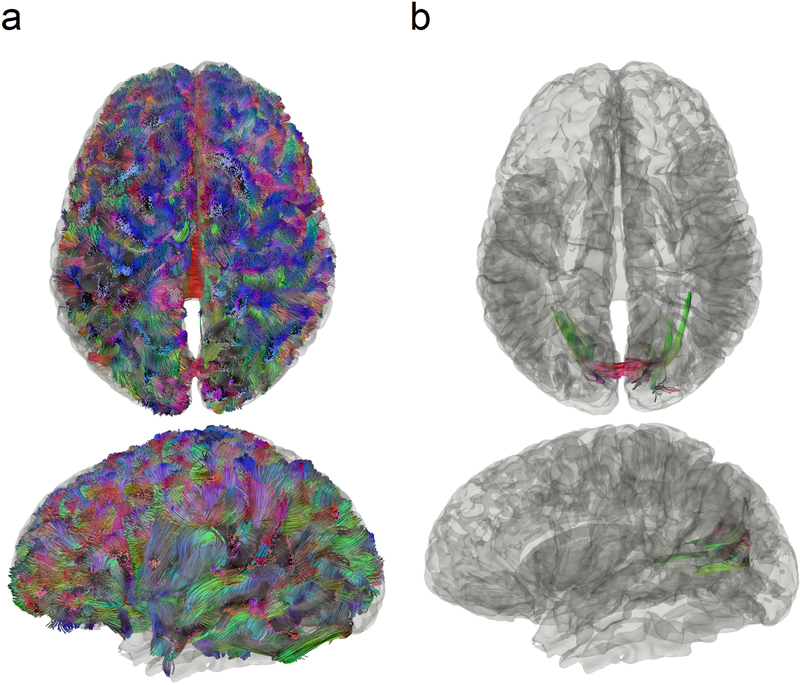
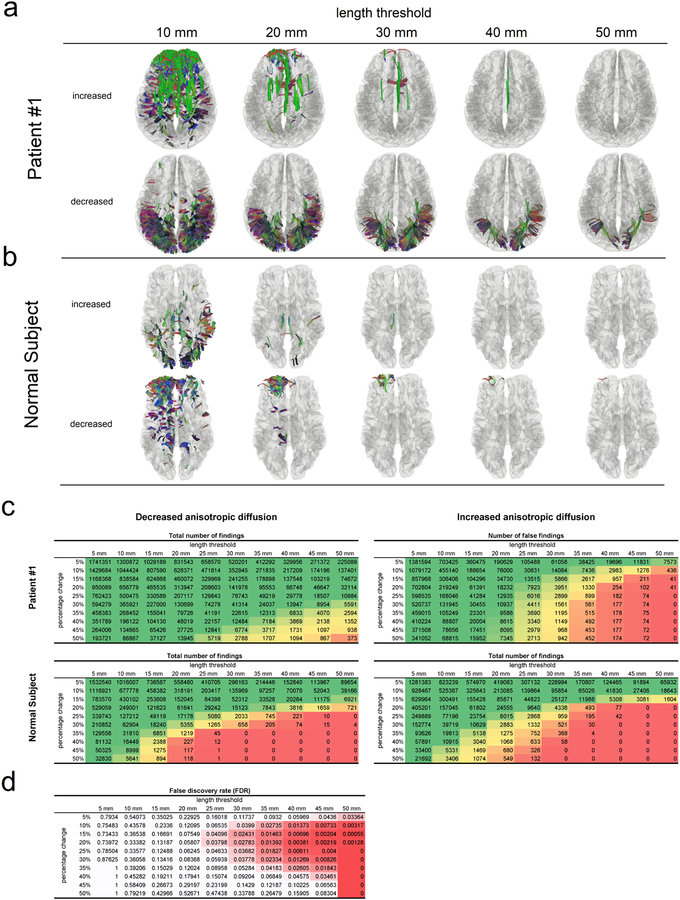
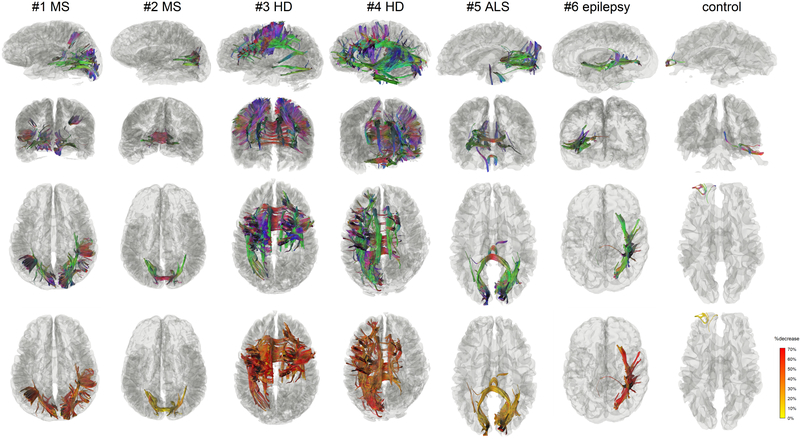
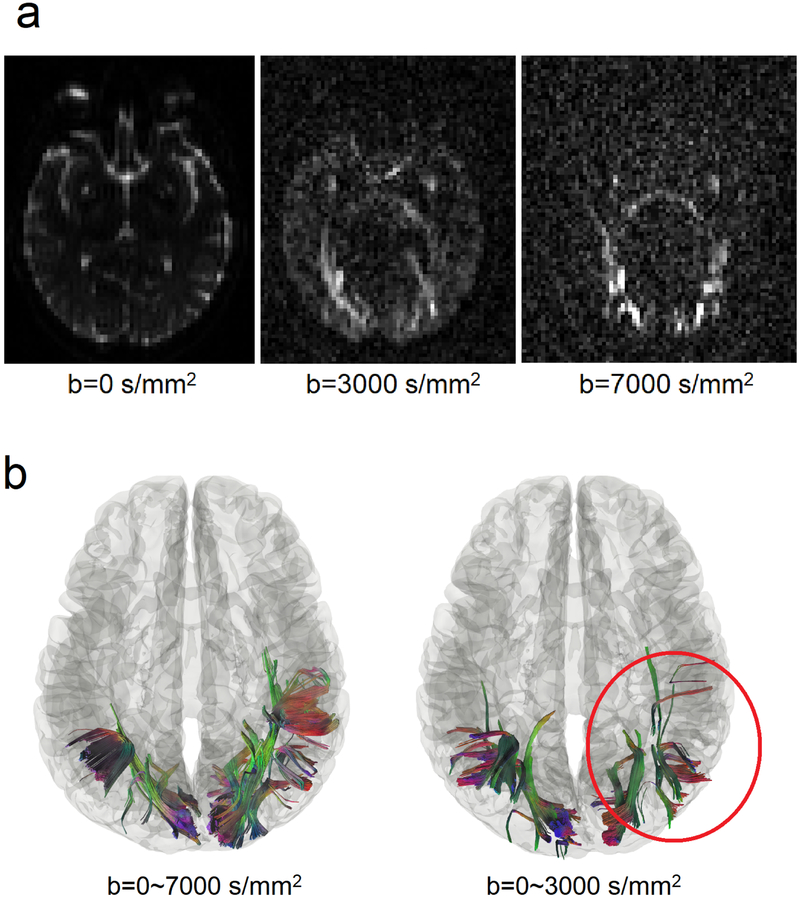
Diffusion MRI tractography has been used to map the axonal structure of the human brain, but its ability to detect neuronal injury is yet to be explored. Here we report differential tractography, a new type of tractography that utilizes repeat MRI scans and a novel tracking strategy to map the exact segment of fiber pathways with a neuronal injury. We examined differential tractography on multiple sclerosis, Huntington's disease, amyotrophic lateral sclerosis, and epileptic patients. The results showed that the affected pathways shown by differential tractography matched well with the unique clinical symptoms of the patients, and the false discovery rate of the findings could be estimated using a sham setting to provide a reliability measurement. This novel approach enables a quantitative and objective method to monitor neuronal injury in individuals, allowing for diagnostic and prognostic evaluation of brain diseases.

Keywords: Amyotrophic lateral sclerosis; Differential tractography; Diffusion MRI; Epilepsy; Fiber tracking; Huntington’s disease; Imaging biomarker; Multiple sclerosis; Neuronal injury.


Figures

Fig. 1
Fig. 1
The flow chart of differential tractography. (a) The baseline and follow-up scans of the same subject are spatially aligned, and the diffusion signals are scaled to the same unit. (b) The spin distribution function (SDF) from two scans are reconstructed in the same common subject space. (c) The difference in the anisotropic component of SDF is computed for each fiber orientation. (d) Increased and decreased anisotropy values are separated to guide a “tracking-the-difference” algorithm. (e) Differential tractography shows the exact segment of tracks with increased and decreased anisotropy, respectively. The tracks with decreased anisotropy suggest possible neuronal injury, whereas the number of tracks with increased anisotropy can be used to estimate the number of false findings.
Fig. 2
Fig. 2
Diagram showing the sham setting for calculating the false discovery rate (FDR). (a) The baseline scan is compared with a follow-up scan (upper row) and a sham scan (lower row), respectively. The follow-up scan is often acquired months after the baseline scan to capture the true positive findings, whereas the sham scan can be a repeat scan on the same day or any scan setting that ensures the findings are all false positives. (b) The number of findings from the follow-up scan (upper row) includes both true and false positives, whereas the number from the sham scan (lower row) include only false-positive findings. (c) These two numbers can be used to estimate FDR.
Fig. 3
Fig. 3
Differential tractography of a multiple sclerosis patient with the first episode of optic neuritis. (a) The intermediate result of differential tractography shows red sticks indicating local fiber orientations with a negative change threshold of 30% between repeat scans. The sticks are mostly distributed along the primary visual pathways, while sporadic false findings can also be found throughout the entire whiter matter regions due to local signal variations. (b) The red sticks are tracked and connected into continuous trajectories, whereas the other unaffected parts of the white matter pathways are ignored. The resulting 3D presentation is the differential tractogram of the patient showing the exact segment of pathways with a substantial decrease in anisotropy. The tractography can be rendered by directional colors (left) or severity-coded color (right) to provide information about the spatial location, and the severity of the axonal damage can be quantified by percentage decrease of anisotropic diffusion. (c) The same data analyzed by voxel-based differences show numerous fragmented findings, possibly due to numerous local random error. There is no track information to assist correlating structure with a function and differentiating true findings from false ones.
Fig. 4
Fig. 4
Conventional tractography compared with differential tractography on a multiple sclerosis patient with the first episode of optic neuritis. (a) Conventional tractography shows all existing fiber pathways in the human brain and is insensitive to any subtle decrease in the diffusion property. (b) Differential tractography ignores unaffected regions and shows the exact segments of the pathways that have a substantial decrease of anisotropy quantified between repeat scans of the same individual.
Fig. 5
Fig. 5
Reliability assessment of differential tractography using the length threshold. (a) Differential tractography is applied to a multiple sclerosis patient at different length thresholds. Only the tracks with decreased anisotropy in the patient may contain true positive findings. A longer length threshold (e.g. > 40mm) can reduce false findings at the expense of sensitivity, whereas a shorter threshold may introduce more false results. (b) Differential tractography is applied to a healthy subject, and any findings in the normal subject are false positives for neuronal injury. (c) The numbers of findings at different length thresholds and change thresholds are listed in tables. The patient has substantially large numbers of tracks with decreased anisotropy, suggesting a possible neurological injury. In comparison, the healthy subject has similar numbers of tracks with increased and decreased anisotropy. (d) False discovery rate (FDR) of the findings in a patient can be calculated by using the patient’s numbers of tracks with increased anisotropy as an estimation of the number of false findings. It allows for adjusting the sensitivity and specificity of differential tractography and quantifying the reliability at different length and percentage change thresholds.
Fig. 6
Fig. 6
Differential tractograms of patients with different neurological disorders in comparison with a healthy subject. The results were generated automatically without expert selection. The differential tractograms of the two MS patients match well with their clinical presentation of optic neuritis. Patient #1 has a much severer drop in visual acuity, which can be quantitatively reflected by her larger the volume of the findings and a larger percentage decrease of the anisotropy along the affected pathways. The differential tractograms of the two Huntington diseases show extensive affected striatal pathways. Patient #4 had more asymmetric dystonia, matching the asymmetry presentation of the differential tractography. The ALS patient had lower motor neuron presentation of left-hand weakness, matching the finding of right lower corticospinal pathways in differential tractography. The epileptic patients received right anterior temporal lobectomy, matching the findings in the differential tractogram that shows the affected pathways around the surgical location. The false findings in the healthy subject can be differentiated by their less significant decrease of anisotropy and their location at the anterior frontal region, which is known to be more susceptible to phase distortion artifact.
Fig. 7
Fig. 7
Performance differences in differential tractography due to different b-values. (a) Diffusion-weighted images of a patient at b-values of 0, 3000, and 7000 s/mm2. Signals at high b-values are sensitive to restricted diffusion but have a lower signal-to-noise ratio. Thus most clinical scans only acquire b-value lower than 3000 s/mm2. (b) Differential tractography using reduced b-values between 0 and 3,000 s/mm2 shows 54% fewer findings than those from the full dataset using b-values between 0 and 7,000 s/mm2. Although the reduced b-value dataset also shows a grossly similar result, its FDR is substantially higher (FDR=0.32) and thus not as reliable as the full dataset that includes high b-value data. The result indicates the important role of high b-value acquisition in detecting early neuronal injury.

References

    1. Abhinav K, Yeh FC, El-Dokla A, Ferrando LM, Chang YF, Lacomis D, Friedlander RM, Fernandez-Miranda JC, 2014. Use of diffusion spectrum imaging in preliminary longitudinal evaluation of amyotrophic lateral sclerosis: development of an imaging biomarker. Front Hum Neurosci 8, 270. - PMC - PubMed
    1. Ashburner J, Friston KJ, 2000. Voxel-based morphometry--the methods. Neuroimage 11, 805–821. - PubMed
    1. Basser PJ, Mattiello J, LeBihan D, 1994. Estimation of the effective self-diffusion tensor from the NMR spin echo. J Magn Reson B 103, 247–254. - PubMed
    1. Budde MD, Xie M, Cross AH, Song SK, 2009. Axial diffusivity is the primary correlate of axonal injury in the experimental autoimmune encephalomyelitis spinal cord: a quantitative pixelwise analysis. J Neurosci 29, 2805–2813. - PMC - PubMed
    1. Callaghan PT, 1991. Principles of Nuclear Magnetic Resonance Microscopy. Oxford University Press.

Publication types