

What change in body mass index is associated with improvement in percentage body fat in childhood obesity? A meta-regression
- PMID: 31473614
- PMCID: PMC6720247
- DOI: 10.1136/bmjopen-2018-028231
What change in body mass index is associated with improvement in percentage body fat in childhood obesity? A meta-regression
Abstract
Objective: Using meta-regression this paper sets out the minimum change in body mass index-SD score (BMI-SDS) required to improve adiposity as percentage body fat for children and adolescents with obesity.
Design: Meta-regression.
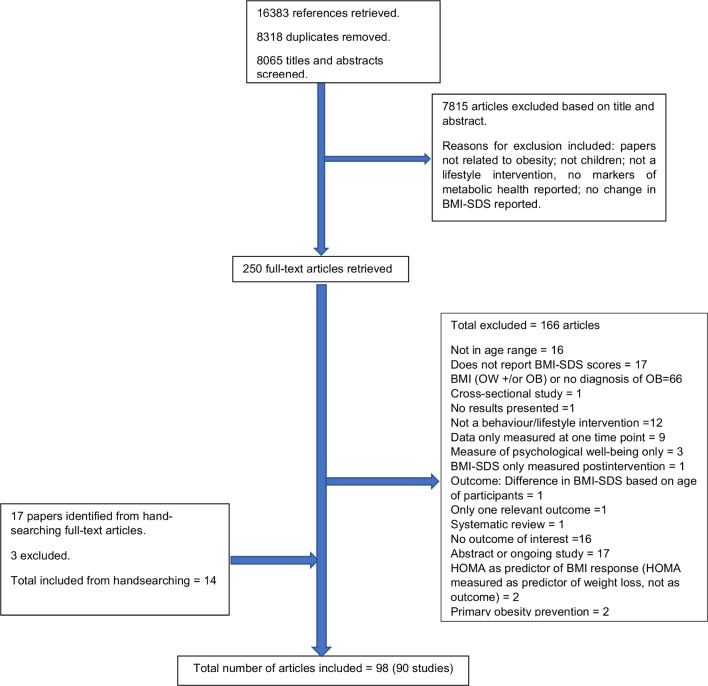
Setting: Studies were identified as part of a large-scale systematic review of the following electronic databases: AMED, Embase, MEDLINE via OVID, Web of Science and CENTRAL via Cochrane library.
Participants: Individuals aged 4-19 years with a diagnosis of obesity according to defined BMI thresholds.
Interventions: Studies of lifestyle treatment interventions that included dietary, physical activity and/or behavioural components with the objective of reducing obesity were included. Interventions of <2 weeks duration and those that involved surgical and/or pharmacological components (eg, bariatric surgery, drug therapy) were excluded.
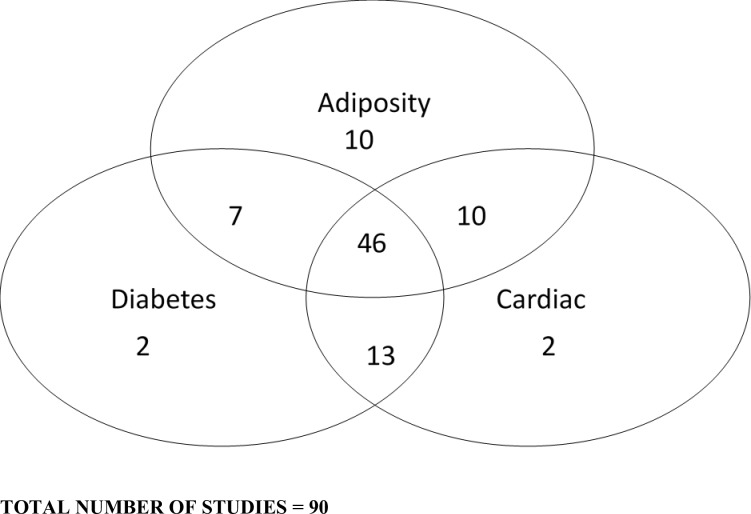
Primary and secondary outcome measures: To be included in the review, studies had to report baseline and post-intervention BMI-SDS or change measurements (primary outcome measures) plus one or more of the following markers of metabolic health (secondary outcome measures): adiposity measures other than BMI; blood pressure; glucose; inflammation; insulin sensitivity/resistance; lipid profile; liver function. This paper focuses on adiposity measures only. Further papers in this series will report on other outcome measures.
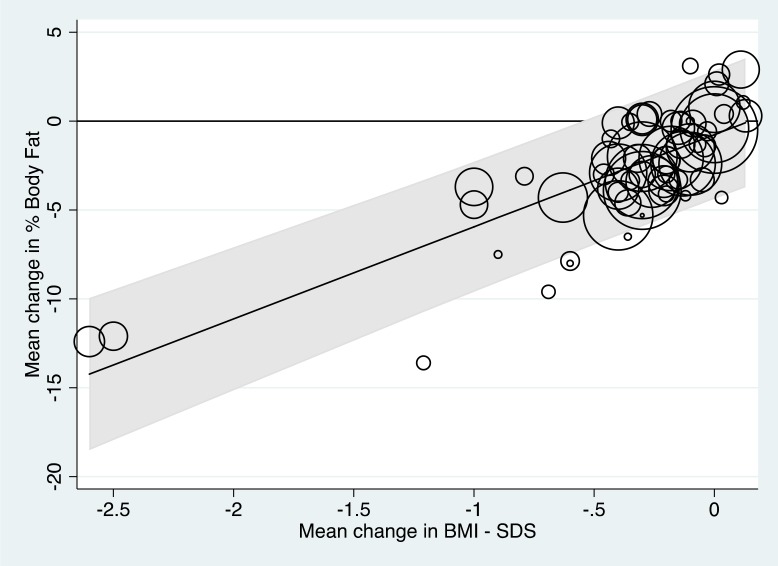
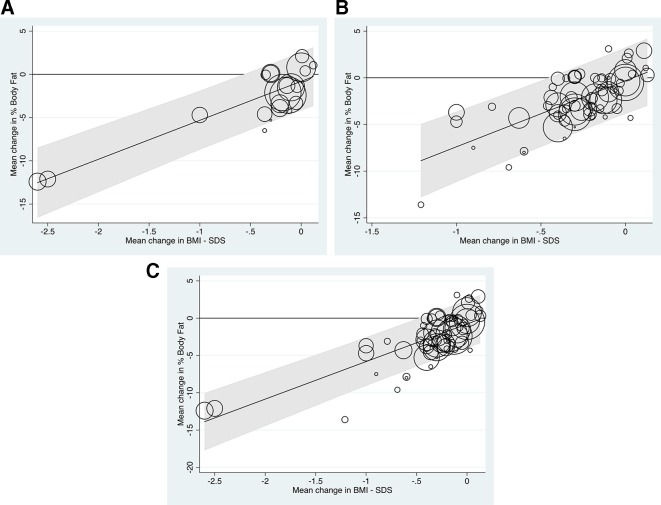
Results: This paper explores the potential impact of BMI-SDS reduction in terms of change in percentage body fat. Thirty-nine studies reporting change in mean percentage body fat were analysed. Meta-regression demonstrated that reduction of at least 0.6 in mean BMI-SDS ensured a mean reduction of percentage body fat mass, in the sense that the associated 95% prediction interval for change in mean percentage body fat was wholly negative.
Conclusions: Interventions demonstrating reductions of 0.6 BMI-SDS might be termed successful in reducing adiposity, a key purpose of weight management interventions.
Trial registration number: CRD42016025317.
Keywords: adolescence; body fat; body mass index; childhood; obesity.
© Author(s) (or their employer(s)) 2019. Re-use permitted under CC BY. Published by BMJ.
Conflict of interest statement
Competing interests: JPHS and LPH are authors on two studies included in the systematic review that this paper reports on.
Figures
Similar articles
-
What change in body mass index is needed to improve metabolic health status in childhood obesity: protocol for a systematic review.Syst Rev. 2016 Jul 26;5(1):120. doi: 10.1186/s13643-016-0299-0. Syst Rev. 2016. PMID: 27456962 Free PMC article.
-
What Change in Body Mass Index Is Required to Improve Cardiovascular Outcomes in Childhood and Adolescent Obesity through Lifestyle Interventions: A Meta-Regression.Child Obes. 2020 Oct;16(7):449-478. doi: 10.1089/chi.2019.0286. Epub 2020 Aug 11. Child Obes. 2020. PMID: 32780648 Free PMC article.
-
Clinical measures of adiposity and percentage fat loss: which measure most accurately reflects fat loss and what should we aim for?Arch Dis Child. 2007 May;92(5):399-403. doi: 10.1136/adc.2006.103986. Epub 2007 Jan 29. Arch Dis Child. 2007. PMID: 17261578 Free PMC article.
-
Exercise and adiposity in overweight and obese children and adolescents: a systematic review with network meta-analysis of randomised trials.BMJ Open. 2019 Nov 11;9(11):e031220. doi: 10.1136/bmjopen-2019-031220. BMJ Open. 2019. PMID: 31719081 Free PMC article.
-
Change in obesity-related metabolic abnormalities associated with body mass index improvement through life-style intervention: A meta-regression.Pediatr Diabetes. 2020 Mar;21(2):173-193. doi: 10.1111/pedi.12955. Epub 2019 Dec 27. Pediatr Diabetes. 2020. PMID: 31820534
Cited by
-
Evaluating 12 Years of Implementing a Multidisciplinary Specialist Child and Adolescent Obesity Treatment Service: Patient-Level Outcomes.Front Nutr. 2022 Jun 3;9:895091. doi: 10.3389/fnut.2022.895091. eCollection 2022. Front Nutr. 2022. PMID: 35719167 Free PMC article.
-
Body Mass Index Trends before and during the COVID-19 Pandemic in Primary School Students in Split-Dalmatia County, Croatia: A Retrospective Study.Nutrients. 2023 Dec 22;16(1):50. doi: 10.3390/nu16010050. Nutrients. 2023. PMID: 38201879 Free PMC article.
-
A 24-h activity profile and adiposity among children and adolescents: Does the difference between school and weekend days matter?PLoS One. 2023 May 18;18(5):e0285952. doi: 10.1371/journal.pone.0285952. eCollection 2023. PLoS One. 2023. PMID: 37200304 Free PMC article.
-
Weight Gain after Hormone Receptor-Positive Breast Cancer.Curr Oncol. 2022 Jun 6;29(6):4090-4103. doi: 10.3390/curroncol29060326. Curr Oncol. 2022. PMID: 35735435 Free PMC article.
-
Mindfulness affects stress, ghrelin, and BMI of obese children: a clinical trial.Endocr Connect. 2020 Feb;9(2):163-172. doi: 10.1530/EC-19-0461. Endocr Connect. 2020. PMID: 32045358 Free PMC article.
References
-
- Organization, WHO. Report of the commission on ending childhood obesity: World Health Organization, 2016.
-
- National Child Measurement Programme - England, 2017-18 [National Statistics] National Child Measurement Programme data source: Health and Social Care Information Centre; 2018. Content.digital.nhs.uk. (n.d.). National Child Measurement Programme - NHS Digital. [online}. Available at http://content.digital.nhs.uk/ncmp.
-
- National Child Measurement Programme - England, 2016-17 [National Statistics] National Child Measurement Programme data source: Health and Social Care Information Centre; 2018. Content.digital.nhs.uk. (n.d.). National Child Measurement Programme - NHS Digital. [online}. Available at http://content.digital.nhs.uk/ncmp.
Publication types
MeSH terms
LinkOut - more resources
Full Text Sources
Medical