. 2019 Sep 5;178(6):1493-1508.e20.
doi: 10.1016/j.cell.2019.08.008. Epub 2019 Aug 29.

Single-Cell Analysis of Crohn's Disease Lesions Identifies a Pathogenic Cellular Module Associated with Resistance to Anti-TNF Therapy

Affiliations

Single-Cell Analysis of Crohn's Disease Lesions Identifies a Pathogenic Cellular Module Associated with Resistance to Anti-TNF Therapy

Jerome C Martin et al. Cell. .

Abstract

Clinical benefits of cytokine blockade in ileal Crohn's disease (iCD) are limited to a subset of patients. Here, we applied single-cell technologies to iCD lesions to address whether cellular heterogeneity contributes to treatment resistance. We found that a subset of patients expressed a unique cellular module in inflamed tissues that consisted of IgG plasma cells, inflammatory mononuclear phagocytes, activated T cells, and stromal cells, which we named the GIMATS module. Analysis of ligand-receptor interaction pairs identified a distinct network connectivity that likely drives the GIMATS module. Strikingly, the GIMATS module was also present in a subset of patients in four independent iCD cohorts (n = 441), and its presence at diagnosis correlated with failure to achieve durable corticosteroid-free remission upon anti-TNF therapy. These results emphasize the limitations of current diagnostic assays and the potential for single-cell mapping tools to identify novel biomarkers of treatment response and tailored therapeutic opportunities.

Keywords: Crohn’s disease; high-dimensional profiling; inflammatory bowel disease; molecular classification; single-cell RNA sequencing.


Figures

Figure 1.
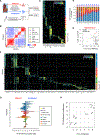
Figure 1.. High-Resolution Cell-type Mapping of Inflamed and Uninflamed Ileum in Crohn’s Disease
(A) Workflow showing the processing of freshly collected blood and surgical resections, including paired inflamed and uninflamed tissues of ileal Crohn’s disease patients for scRNA-seq and CyTOF. (B) Grouping scRNA-seq cell clusters by similarity. Heatmap showing Pearson correlation coefficients between the log-averaged expression profiles of clusters. Ordering was determined by hierarchical clustering (see STAR Methods), which unbiasedly grouped the clusters by cellular lineage (color-coded bar). (C) Single-cell expression of key cell-type markers across the eight cellular compartments. Heatmap visualization color-coding the mRNA (UMI) counts per single cells (stacked rows) for selected marker genes (columns). Visualized are 100 randomly selected cells per cluster, which were downsampled to 2,000 UMIs/cell. Clusters are separated by gray bars and ordered by lineage (color-coded labels as in B). (D) Percentages of cellular lineages in individual samples included in the scRNA-seq analysis. For each sample, a bar graph depicts the percentage of cells in clusters associated with each lineage (lineages are labeled with the same color code as in B and C). (E) CyTOF validation of frequencies estimated by scRNA-seq. Frequencies (log-scale) of the seven immune lineages as estimated by CyTOF versus scRNA-seq in four inflamed iCD ileums. Frequencies of granulocyte populations as determined by CyTOF are also shown but were excluded from the correlation analysis. (F) High-resolution characterization of cellular subtypes and states. Heatmap for visualization of single-cell expression data, similar to (C) but showing an extended gene list demonstrating the distinct cellular states within the lineages captured by scRNA-seq (lineages are labeled with the same color code as in B, C, and D). (G) Percentages of individual scRNA-seq clusters in nine inflamed and nine uninflamed ileums (mean ± SEM) (patients 5, 7, 8, 10, 11, 12, 13, 14, and 15). (H) Principle-component analysis of cellular-subtype composition. First component values were extracted by principal-component analysis of adjusted cell-subtype frequencies of variable subtypes (see STAR Methods). Shown is the PC1 difference between matched inflamed and uninflamed samples (y axis) versus PC1 inflamed (x axis). Positive y axis values indicate shared inflamed versus uninflamed component. Patient identification numbers are indicated. See also Figure S1 and Tables S1 and S2, sheets 1–3.
Figure 2.
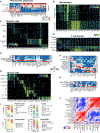
Figure 2.. High-Resolution Analyses of Immune and Stromal Cells Reveal Distinct Cellular Organization in Inflamed Ileums of Crohn’s Disease Patients
(A) Expression profiles distinguish macrophages and dendritic cells. Heatmap showing relative expression values of genes (columns) enriched in macrophages or dendritic cells clusters (rows). Relative expression was defined as log ratio (2-based) of the expression of the gene in a cluster and its average across all shown clusters. (B and C) Distinct transcriptional programs among MNP subtypes. Heatmaps showing color-coded downsampled UMI counts of highly variable genes between macrophage clusters (B) and between dendritic cell clusters (C). Clusters are demarcated by gray bars. For each cluster, 300 cells were randomly selected and downsampled to 2,000 UMIs/cell. (D) Heatmap showing relative expression of cytokines and chemokines (columns) detected at increased levels in MNP clusters (rows) across all inflamed and uninflamed samples. (E) Capturing T cell identities by transcriptional scores. Heatmap showing the relative expression of five transcriptional scores (rows) in single T cells (columns). Scores integrate expression of multiple highly correlated genes (STAR Methods). Cell clusters are demarcated by gray bars. (F) Heatmap showing relative expression of cytokines and chemokines (columns) increased in T cell and ILC clusters (rows) across all inflamed and uninflamed samples. (G) Stromal and glial diversity in inflamed and uninflamed ileum. Heatmap showing color-coded downsampled UMI counts of highly variable genes (columns) between single cells (rows) of different stromal subtypes. For each cluster, 100 cells were randomly selected and downsampled to 2,000 UMIs/cell. (H) Heatmap showing relative expression of cytokines and chemokines (columns) increased in stromal-cell clusters (rows) across all inflamed and uninflamed samples. (I) Diversity of myeloid cells, T cells, plasma cells, and stromal cells in inflamed versus uninflamed regions. Shown are stacked frequencies of each subtype divided by the respective total compartment frequency estimated by scRNA-seq in uninflamed or inflamed ileum. (J) Co-segregation of cell subtypes across inflamed tissues. Pearson correlation between the normalized frequencies of the lamina propria cell subtypes in CD-inflamed ileums (n = 9). Subtypes are reordered by hierarchical clustering (STAR Methods). See also Figures S2–S4 and Table S2, sheets 4 and 5.
Figure 3.
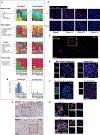
Figure 3.. Identification of a Unique Cellular Signature in a Subset of Ileal Crohn’s Disease Patients
(A) Independent analyses of cell-subtype frequencies within the different cellular compartments. The number of cells in each cellular subtype is divided by the total number of cells in its cellular compartment and visualized in a stacked bar for each sample. Each of the four cellular compartments (MNPs, T cells, plasma cells, stromal-glial cells) is shown separately in inflamed and uninflamed samples of each patient. Patients are ordered by hierarchical clustering (see STAR Methods) of frequency data in inflamed ileum. This unbiased visualization exposes the GIMATS module signature in a subgroup of patients. (B) Striking differences in GIMATS module intensity between patient groups. Shown is the geometric mean of the normalized frequencies of the GIMATS module subtypes (IgG plasma cells, infl. macs, activated DCs, activated T cells, activated fibroblasts, and ACKR1+ endothelial cells) in each sample. (C) Representative pictures of macrophage staining in the inflamed (top) and uninflamed (bottom) lamina propria of patients enriched (nos. 7, 11, 12) or not enriched (no. 10) for the GIMATS module. (D) Representative picture of CD68 and DC-LAMP staining in the inflamed lamina propria of a patient enriched for the GIMATS module. (E) Higher magnification of white square (i) in (D) showing an activated DC-associated lymphocyte aggregate. Left: MNPs were stained with CD68, CD206, and DC-LAMP. White arrows indicate CD68+ CD206− macrophages in close contact to CD68− DC-LAMP+-activated DCs. Right: staining of T cells (CD3), B cells (CD20), and the proliferation marker Ki67. (F) T cell-dense area surrounded by subepithelial CD68+ CD206+-resident macrophages. Left: MNPs were stained with CD68, CD206, and DC-LAMP. CD68+ CD206− macrophages and CD68− DC-LAMP+-activated DCs were not detected. Right: T (CD3) and B (CD20) lymphocytes were stained. CD20+ B cells were not detected. (G) Representative podoplanin (PDPN) staining by immunohistochemistry in the inflamed lamina propria of two patients enriched for the GIMATS module. Black squares depict areas enriched in PDPN+-activated fibroblasts in the lamina propria. (H) CD68, CD206, DC-LAMP, and PDPN MICSSS imaging of areas enriched in activated fibroblasts (black squares in G), showing preferential localization of activated fibroblast in the vicinity of CD68+ CD206− infl. macs over CD68− DC-LAMP+-activated DCs. See also Figure S5.
Figure 4.
Figure 4.. The GIMATS Module Is Organized by a Specific Cytokine-Chemokine Network
(A) Comparative ligand-receptor network analysis between the two patient groups. Shown is the log ratio between the intensity of the ligand (rows)-receptor (columns) pair in inflamed samples of patients enriched with the module versus patients not enriched with the module (color coded) for different cellular cell-type pairs. The intensity of a ligand-receptor pair is the product between the total expression of the ligand and the expression of the receptor (STAR Methods). Only validated pairs, which are expressed at least in one of the patient groups, are included. Stars indicate Benjamini-Hochberg adjusted p < 0.01 as estimated by permutation test (STAR Methods). (B and C) Ligand-receptor expression map. Heatmaps showing the expression averaged across all inflamed and uninflamed samples for genes (columns) per cell subtype (rows) of indicated cytokines or chemokines (B) and their receptors (C). Established ligand-receptor pairs are connected with lines. Colored lines highlight pairs relevant to the GIMATS module. Pink, activated DC-TCM; yellow, inf. MNP-activated T cells -CTLs -pDCs; green, infl. macs-stromal cells; blue, activated fibroblasts-ACKR1+ endothelial cells. (D) Infl. macs express a continuum of monocyte to macrophage genes. Larger heatmap shows downsampled UMI counts of program 1 and program 2 genes as well as infl. mac genes for cells of the infl. mac cluster. Averaged expression of program 1 and program 2 genes shown in parallel heatmap. Cells in both heatmaps were ordered by the ratio between averaged expression of program 1 and program 2 genes. For reference, PBMC cells mapped to cluster “Classical monocytes-1” are shown on top. (E) Scatterplot showing frequencies of blood classical monocytes (y axis) versus intestinal inflammatory macrophages (x axis) in GIMATS module high (blue dots) and GIMATS module low (green dots) patients. See also Figure S6 and Table S2, sheet 6.
Figure 5.
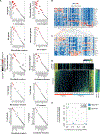
Figure 5.. Enrichment for the GIMATS Module before Treatment Is Associated with Resistance to Anti-TNF
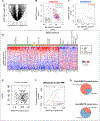
(A) Differential expression analysis between pooled scRNA-seq data from inflamed samples of patients stratified by GIMATS module enrichment. Volcano plot showing for each gene the log2 ratio between averages in GIMATS module high and GIMATS module low patients (x axis) and minus log2 Benjamini-Hochberg adjusted p value (y axis). See STAR Methods for detailed description of the permutation test that provided the empirical p values. (B and C) Validation of the GIMATS module in bulk RNA datasets. Scatterplots showing the projected bulk RNA microarray and sequencing data of inflamed (B) and uninflamed (C) biopsies from four Crohn’s disease cohorts onto the signature scores (see STAR Methods). The negative correlation over inflamed samples indicates enrichment of the GIMATS module in a subset of patients in each cohort. (D) Heatmap of normalized bulk RNA-seq expression values (red, high; blue, low) of selected genes (columns) among CD-inflamed ileal biopsies (stacked rows) ordered according to their GIMATS module signature enrichment. (E) Pediatric Crohn’s disease index (PCDAI) does not correlate with the GIMATS module score in newly diagnosed patients before anti-TNF therapy. Shown is PCDAI of RISK patients (y axis) versus GIMATS module score at diagnosis (x axis). Pearson correlation test (r = 0.06) was not significant. (F) High GIMATS module score is associated with non-response to anti-TNF therapy. Cumulative distribution of GIMATS module scores in responders and non-responders to anti-TNF at diagnosis before treatment. Non-responders have significantly higher GIMATS module scores (Kolmogrov-Smirnov D = 0.42; p = 0.006). Dashed line indicates the score value corresponding to Kolmogrov-Smirnov D statistic (score = −0.2). (G) Pie charts showing the enrichment for responders and non-responders to anti-TNF in patients classified as GIMATS module high or low according to Kolmogrov-Smirnov D statistic. See also Figure S7 and Table S2, sheet 7.

Comment in

References

    1. Abraham C, Dulai PS, Vermeire S, and Sandborn WJ (2016). Lessons Learned From Trials Targeting Cytokine Pathways in Patients With Inflammatory Bowel Diseases. Gastroenterology 152, 374–388.e4. - PMC - PubMed
    1. Aird WC (2007). Phenotypic heterogeneity of the endothelium: II. Representative vascular beds. Circ. Res. 100, 174–190. - PubMed
    1. Anginot A, Espeli M, Chasson L, Mancini SJC, and Schiff C (2013). Galectin 1 modulates plasma cell homeostasis and regulates the humoral immune response. J. Immunol. 190, 5526–5533. - PMC - PubMed
    1. Azizi E, Carr AJ, Plitas G, Cornish AE, Konopacki C, Prabhakaran S, Nainys J, Wu K, Kiseliovas V, Setty M, et al. (2018). Single-Cell Map of Diverse Immune Phenotypes in the Breast Tumor Microenvironment. Cell 174, 1293–1308.e36. - PMC - PubMed
    1. Bamba S, Andoh A, Yasui H, Makino J, Kim S, and Fujiyama Y (2003). Regulation of IL-11 expression in intestinal myofibroblasts: role of c-Jun AP-1-and MAPK-dependent pathways. Am. J. Physiol. Gastrointest. Liver Physiol 285, G529–G538. - PubMed

Publication types