. 2019 Oct 1;30(4):784-799.e5.
doi: 10.1016/j.cmet.2019.08.003. Epub 2019 Aug 29.

Mitochondrial Damage and Activation of the STING Pathway Lead to Renal Inflammation and Fibrosis

Affiliations

Mitochondrial Damage and Activation of the STING Pathway Lead to Renal Inflammation and Fibrosis

Ki Wung Chung et al. Cell Metab. .

Abstract

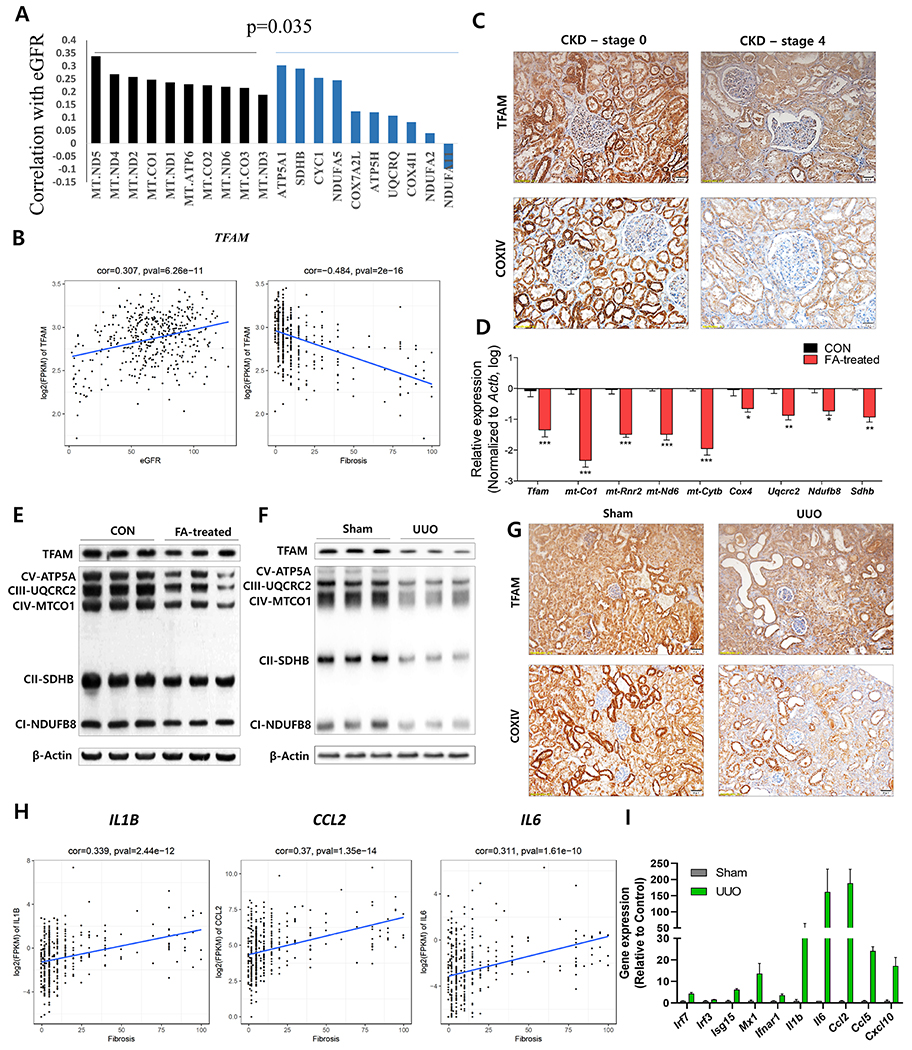
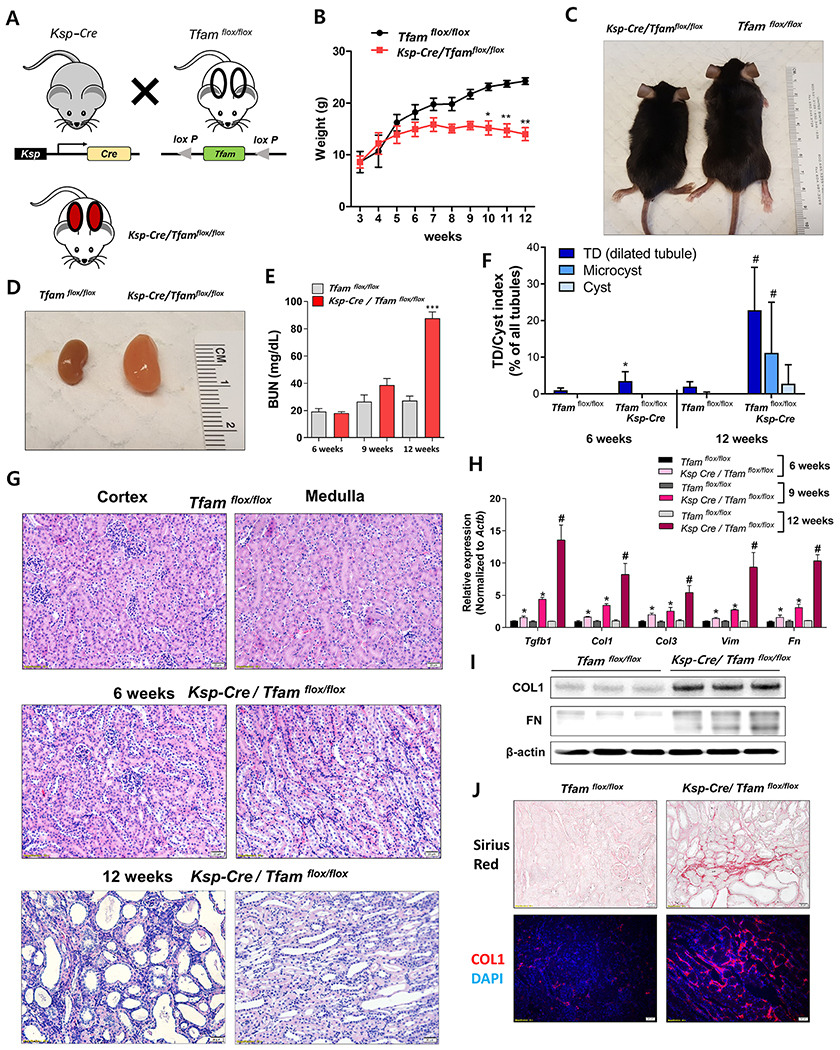
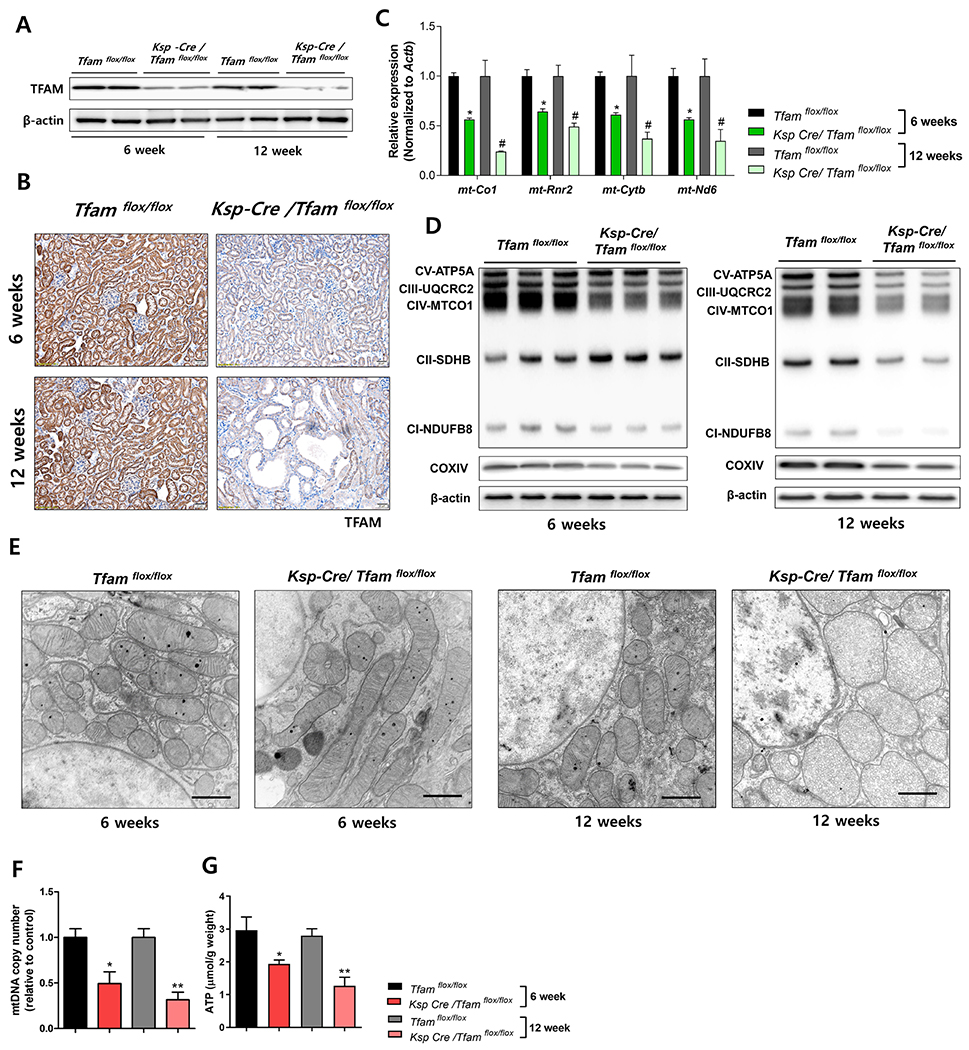
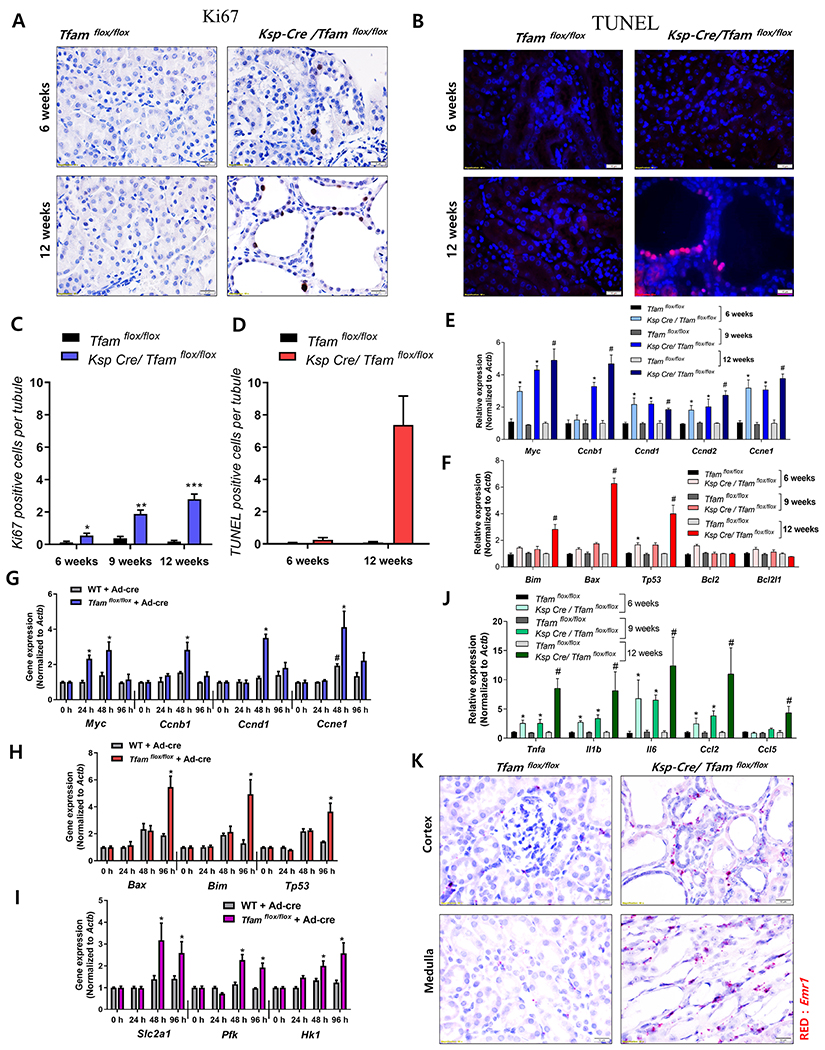
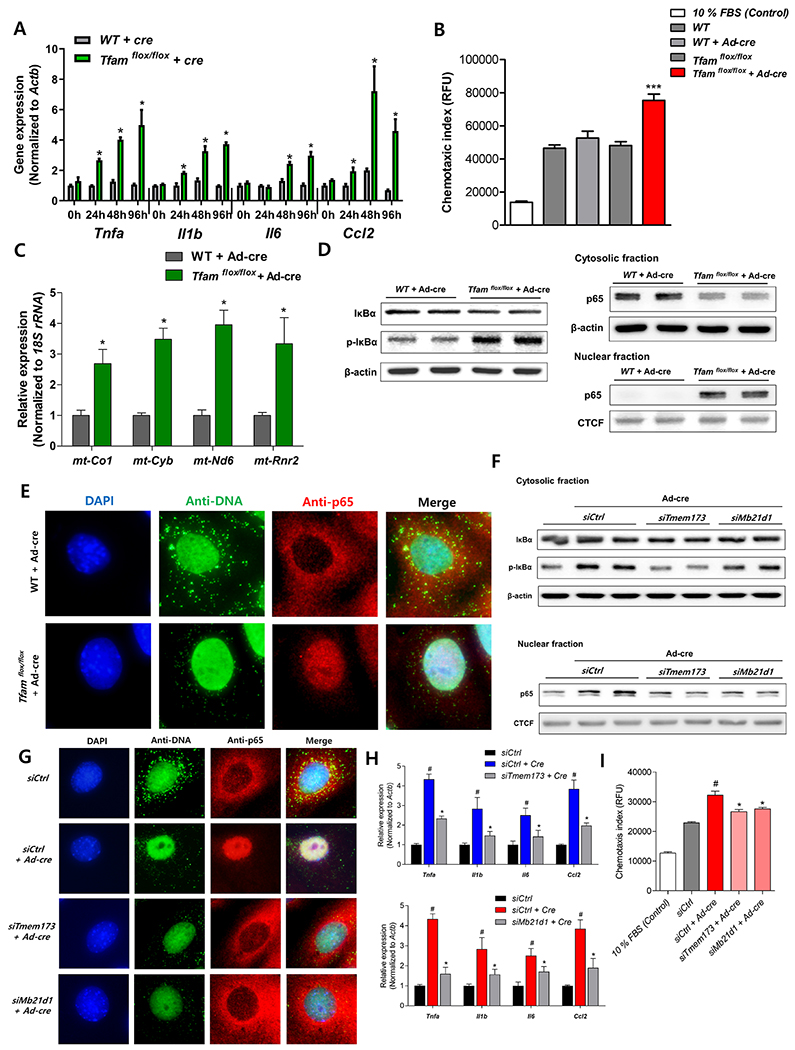
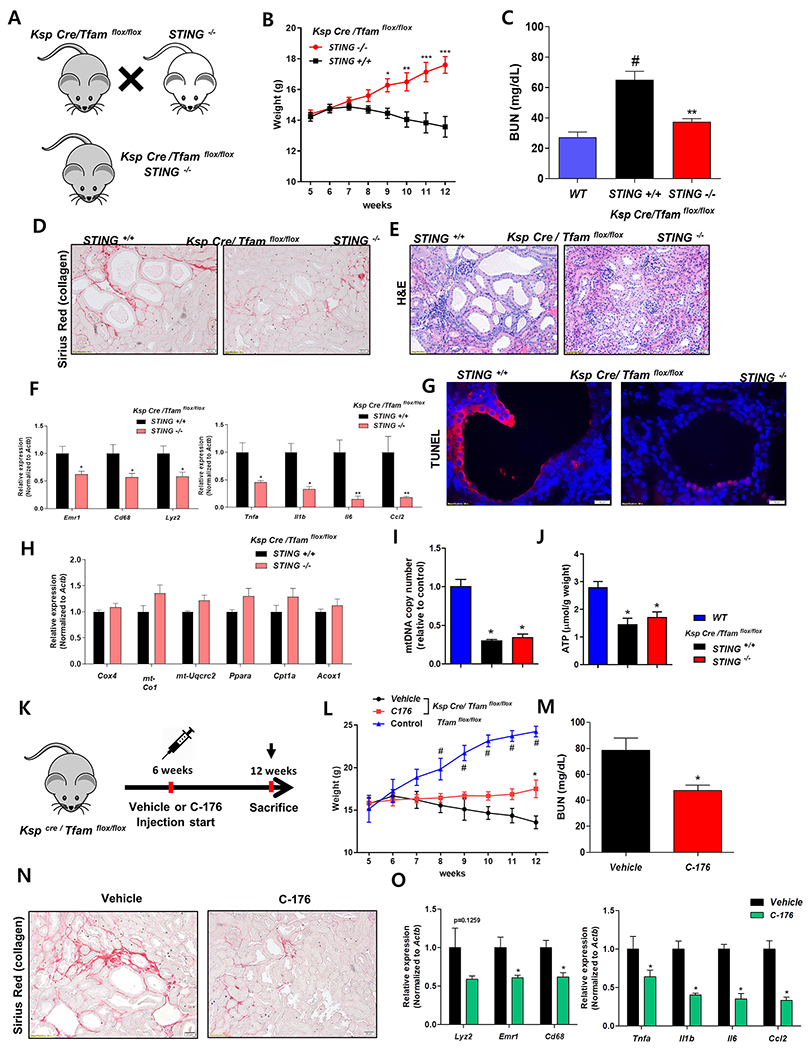
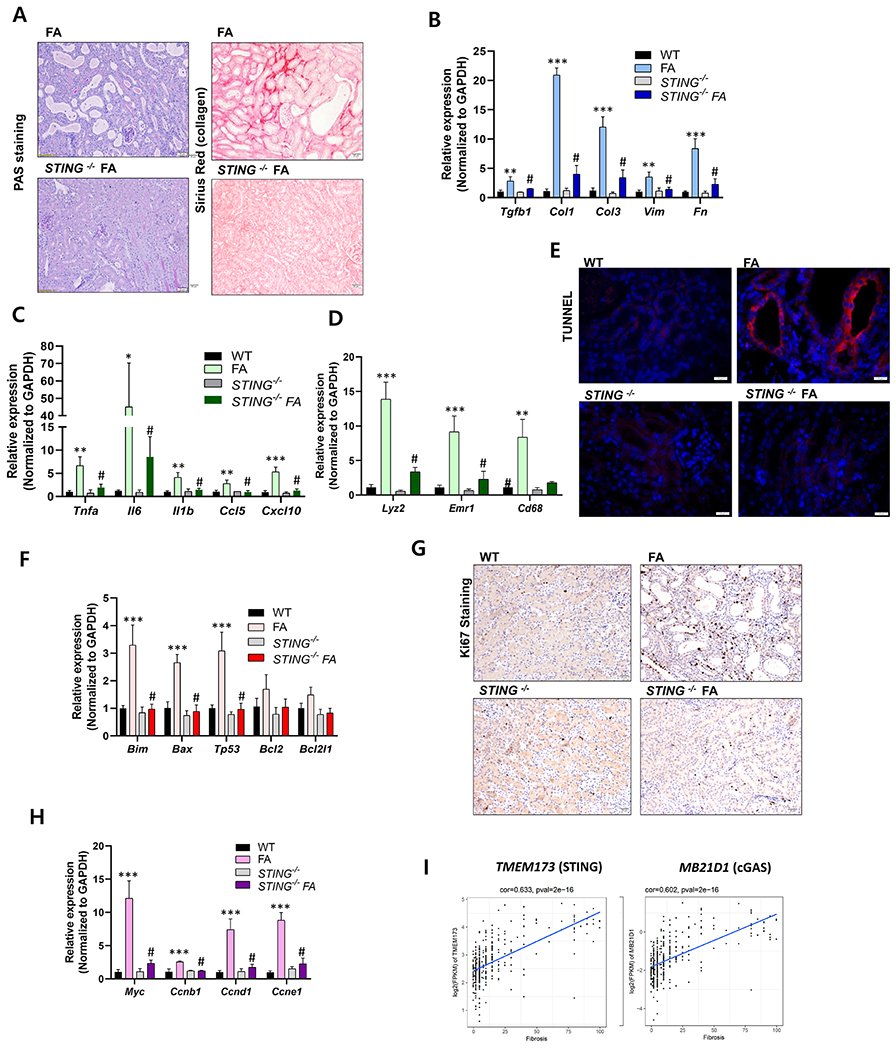
Fibrosis is the final common pathway leading to end-stage renal failure. By analyzing the kidneys of patients and animal models with fibrosis, we observed a significant mitochondrial defect, including the loss of the mitochondrial transcription factor A (TFAM) in kidney tubule cells. Here, we generated mice with tubule-specific deletion of TFAM (Ksp-Cre/Tfamflox/flox). While these mice developed severe mitochondrial loss and energetic deficit by 6 weeks of age, kidney fibrosis, immune cell infiltration, and progressive azotemia causing death were only observed around 12 weeks of age. In renal cells of TFAM KO (knockout) mice, aberrant packaging of the mitochondrial DNA (mtDNA) resulted in its cytosolic translocation, activation of the cytosolic cGAS-stimulator of interferon genes (STING) DNA sensing pathway, and thus cytokine expression and immune cell recruitment. Ablation of STING ameliorated kidney fibrosis in mouse models of chronic kidney disease, demonstrating how TFAM sequesters mtDNA to limit the inflammation leading to fibrosis.

Keywords: TFAM; cGAS-STING pathway; chronic kidney disease; innate immunity; mitochondrial DNA; mitochondrial transcription factor A; renal fibrosis.


Figures

Figure 1.
Figure 1.. Mouse and human kidney disease is characterized a lower expression of TFAM and metabolic genes and an higher level of inflammatory genes
(A) Correlation between kidney function (eGFR) and transcript levels of mitochondrial (Black) and nuclear-encoded mitochondrial genes (Blue). (B) Relative transcript levels of TFAM (FPKM) and kidney function (eGFR) kidney fibrosis as analyzed in 433 microdissected human kidney samples. (C) TFAM and COXIV expressions in human chronic kidney diseases (stage 0 and stage 4) were visualized by immunohistochemical (IHC) staining. Scale bar = 20 μm. (D) Relative mRNA levels of Tfam and mitochondrial OXPHOS genes (mt-Co1, mt-Rnr2, mt-Nd6, mt-Cytb, Cox4, Uqcrc2, Ndufb8, and Sdhb) in FA-induced mice kidney fibrosis model (red) as compared to control (Black). * P < 0.05, ** P < 0.01, *** P < 0.001 . (E) Protein levels of TFAM and mitochondrial OXPHOS proteins (CV-ATP5A, CIII-UQCRC2, CIV-MTCO1, CII-SDHB, and CI-NDUFB8) in FA-induced mice kidney fibrosis model and (F) UUO-induced mice kidney fibrosis models. β-actin was used as a loading control. (G) TFAM and COXIV expressions in UUO-induced mice kidney fibrosis model were visualized by IHC staining. Scale bar = 20 μm. (H) Transcript levels (RNA-sequencing) of IL6, CCL2, and IL1B, correlated with the degree of kidney fibrosis in 433 microdissected human kidney samples. (I) Proinflammatory gene expression (RNA-seq) in UUO-induced kidney fibrosis mice.
Figure 2.
Figure 2.. Tubule-specific TFAM deletion in mice causes renal failure
(A) Experimental scheme for generating the Ksp-Cre/Tfamflox/flox mice. (B) Weight changes of Ksp-Cre/Tfamflox/flox mice and WT/Tfamflox/flox mice. * P < 0.05, ** P < 0.01. (C) Representative images of mice and (D) kidneys of Ksp-Cre/Tfamflox/flox mice and WT/Tfamflox/flox mice taken at 12 weeks of age. (E) Blood urea nitrogen (BUN) levels of Ksp-Cre/Tfamflox/flox and WT/Tfamflox/flox mice ***P < 0.001. (F) Quantification of tubule dilation (TD), microcysts, and cysts in Ksp-Cre/Tfamflox/flox and WT/Tfamflox/flox mice kidney. *P < 0.05 vs. 6 weeks WT mice. #P < 0.05 vs. 12 weeks WT mice. (G) Representative haematoxylin and eosin (H&E) staining of 6 and 12 weeks old Ksp-Cre/Tfamflox/flox and WT/Tfamflox/flox kidneys. Scale bar = 20 μm. (H) Relative mRNA levels of fibrosis-associated genes (Tgfb1, Col1, Col3, Vim, and Fn1) in 6 weeks, 9 weeks and 12 weeks of Ksp-Cre/Tfamflox/flox mice and WT/Tfamflox/flox mice kidneys. * P < 0.05 vs. 6 weeks WT/Tfamflox/flox. * P < 0.01 vs. 9 weeks WT/Tfamflox/flox. # P < 0.05 vs. 12 weeks WT/Tfamflox/flox. (I) Protein levels of collagen1 and fibronectin in 12 weeks of Ksp-Cre/Tfamflox/flox mice and WT/Tfamflox/flox mice kidney. β-actin was used as a loading control. (J) Representative images of Sirius-red staining of 12 weeks of Ksp-Cre/Tfamflox/flox mice and WT/Tfamflox/flox mice kidneys. Representative immunofluorescence images of Collagen I (COL1) staining (Red) and DAPI (Blue) in 12 weeks of Ksp-Cre/Tfamflox/flox and WT/Tfamflox/flox mice kidneys.
Figure 3.
Figure 3.. Ksp-Cre/Tfamflox/flox kidneys are characterized by severe metabolic defects
(A) TFAM protein expression in whole kidney lysates of 6 and 12 weeks of Ksp-Cre/Tfamflox/flox and WT/Tfamflox/flox mice. β-actin was used as a loading control. (B) Representative IHC images of TFAM. Scale bar = 20 μm. (C) Relative mRNA levels of mitochondrially-encoded genes (mt-Co1, mt-Rnr2, mt-Nd6, and mt-Cytb) in 6 and 12 weeks of Ksp-Cre/Tfamflox/flox mice and WT/Tfamflox/flox mice kidneys. * P < 0.05 vs. 6 weeks WT/Tfamflox/flox. # P < 0.05 vs. 12 weeks WT/Tfamflox/flox. (D) Protein levels of mitochondrial OXPHOS proteins (CV-ATP5A, CIII-UQCRC2, CIV-MTCO1, CII-SDHB, CI-NDUFB8, and COXIV) at 6 weeks and 12 weeks of Ksp-Cre/Tfamflox/flox mice and WT/Tfamflox/flox mice kidney. β-actin was used as a loading control. (E) Representative transmission electron microscopy (TEM) images of Ksp-Cre/Tfamflox/flox mice and WT/Tfamflox/flox mice kidney tubules (6 and 12 weeks). Scale bar = 500 nm. (F) mtDNA copy number was quantified by qPCR. * P < 0.05 vs. 6 weeks WT/Tfamflox/flox. ** P < 0.01 vs. 12 weeks WT/Tfamflox/flox. (G) ATP concentration per total protein amount was measured. * P < 0.05 vs. 6 weeks WT/Tfamflox/flox. ** P < 0.01 vs. 12 weeks WT/Tfamflox/flox.
Figure 4.
Figure 4.. Early wave of proliferation is followed by higher level cell death in Ksp-Cre/Tfamflox/flox mice
(A) Representative Ki67 immunostaining of kidney section of control and Ksp-Cre/Tfamflox/flox mice. Scale bar = 10 μm. (B) Representative images showing TUNEL staining of control and Ksp-Cre/Tfamflox/flox mice kidneys. Scale bar = 10 μm. (C) Quantification of Ki67-positive cells. * P < 0.05 vs. 6 WT/Tfamflox/flox. ** P < 0.01 vs. 9 weeks WT/Tfamflox/flox. *** P < 0.001 vs. 12 weeks WT/Tfamflox/flox. (D) Quantification of TUNEL positive cells. *** P < 0.001 vs. 12 weeks WT/Tfamflox/flox. (E) Relative mRNA levels of genes associated with cell proliferation (Myc, Ccnb1, Ccnd1, Ccnd2, and Ccne1) in control and Ksp-Cre/Tfamflox/flox mice. * P < 0.05 vs. 6 weeks WT/Tfamflox/flox. *P <0.01 vs. 9 weeks WT/Tfamflox/flox. # P < 0.05 vs. 12 weeks WT/Tfamflox/flox. (F) Relative mRNA levels of apoptosis-related genes (Bim, Bax, Tp53, Bcl2, and Bcl2l1) in control and TFAM deficient mice. * P < 0.05 vs. 6 weeks WT/Tfamflox/flox. *P <0.01 vs. 9 weeks WT/Tfamflox/flox. # P < 0.05 vs. 12 weeks WT/Tfamflox/flox. (G) Relative mRNA levels of proliferation associated genes (Myc, Ccnb1, Ccnd1, and Ccne1) in control and TFAM deficient primary cultured tubule cells. # P < 0.05 vs. wild type cells at 0 h. * P < 0.05 vs. Cre adenovirus treated cells at 0 h. (H) Relative mRNA levels of apoptosis associated genes (Bax, Bim, and Tp53) in primary cultured control and TFAM knock-out cells. * P < 0.05 vs. Cre adenovirus treated cells at 0 h. (I) Relative mRNA levels of glycolysis associated genes (Pfk, Slc2a1, and Hk1) in primary cultured control and TFAM knock-out cells. * P < 0.05 vs. Cre adenovirus treated cells at 0 h. (J) Relative mRNA levels of pro-inflammatory cytokines (Tnfa, Il1b, Il6, Ccl2, and Ccl5) in 6 weeks, 9 weeks and 12 weeks of Ksp-Cre/Tfamflox/flox mice and WT/Tfamflox/flox mice kidneys. * P < 0.05 vs. 6 weeks WT/Tfamflox/flox. *P <0.05 vs. 9 weeks WT/Tfamflox/flox. # P < 0.05 vs. 12 weeks WT/Tfamflox/flox. (K) Representative images of in situ hybridization with Emr1 (red) probe in Tfam-deficient kidney cortex and medulla. Scale bar = 10 μm.
Figure 5.
Figure 5.. TFAM deficiency causes cytosolic leak of mtDNA and cGAS-STING, NF-κB activation
(A) Relative mRNA levels of pro-inflammatory cytokine genes (Tnfa, Il1b, Il6, and Ccl2) in Tfam-deficient primary cultured TECs. * P < 0.05 vs. control group. (B) Macrophage chemotaxis index. Raw 267.4 macrophage cells were incubated with medium of control and Tfam-deficient primary tubule cells. *** P < 0.001 vs. Cre-treated group. (C) Cytosolic translocation of mtDNA was quantified by qPCR. Cytosol fractions of control and Tfam-deficient primary cultured TECs were analyzed * P < 0.05 vs. control group. (D) Protein levels of IκBα, phosphorylated IκBα, and p65 were determined in cytosolic fraction, protein level of p65 was determined in nuclear fraction in primary cultured cell in different condition. β-actin and CTCF were used as the loading control for cytosolic and nuclear fractions, respectively. (E) Microscopy images of control and Tfam knock-down primary cultured TECs stained with anti-DNA and anti-p65 antibodies and DAPI. Scale bar = 10 μm. (F) Cytosolic protein levels of IκBα and phosphorylated IκBα and nuclear p65 was determined in primary Tfam-null TECs at baseline or in the combination of siRNA mediated Mb21d1(cGAS) and Tmem173 (STING) knock-down. β-actin and CTCF were used as loading control for cytosolic and nuclear fractions, respectively. (G) Representative immunofluorescence images of primary cultured TECs stained with anti-DNA and anti-p65 antibodies and DAPI. All cells were incubated with AdCre to delete Tfam and control siRNA or Mb21d1(cGAS)/Tmem173 (STING) knock-down. Scale bar = 10 μm. (H) Relative mRNA levels of proinflammatory cytokine genes (Tnfa, Il1b, Il6, and Ccl2). Cells were incubated with AdCre to delete Tfam and control siRNA or Mb21d1(cGAS)/Tmem173 (STING) knock-down. # P < 0.05 vs. control group. * P < 0.05 vs. Cre-treated group. (I) Macrophage chemotaxis index from media obtained from TECs. TECs were incubated with AdCre to knock-out Tfam and control siRNA or Mb21d1(cGAS)/Tmem173 (STING) knock-down. # P < 0.05 vs. control group. * P < 0.05 vs. Cre-treated group.
Figure 6.
Figure 6.. Genetic deletion of pharmacological inhibition of STING attenuates renal disease of TFAM-deficient kidneys.
(A) Experimental scheme for the generation Ksp-Cre/Tfamflox/floxSTING−/− mice. (B) Weight changes. *P <0.05. ** P < 0.01. *** P< 0.001 vs. STING +/+ group. (C) Blood urea nitrogen (BUN) levels at 12 weeks of age in control Ksp-Cre/Tfamflox/flox and Ksp-Cre/Tfamflox/floxSTING−/− mice. ** P < 0.01 vs. STING +/+ group. (D) Representative images of Sirius-red staining in 12 weeks of Ksp-Cre/Tfamflox/flox and Ksp-Cre/Tfamflox/floxSTING−/− mice. (E) Representative images of hematoxylin and eosin staining of 12 weeks of Ksp-Cre/Tfamflox/flox and Ksp-Cre/Tfamflox/floxSTING−/− mice. (F) Relative mRNA levels of inflammatory cell marker genes (Lyz2, Emr1, and Cd68) and pro-inflammatory cytokines (Tnfa, Il1b, Il6, and Ccl2) in Ksp-Cre/Tfamflox/flox and Ksp-Cre/Tfamflox/floxSTING−/− mice. *P <0.05. ** P < 0.01 vs. STING +/+ group. (G) Representative TUNEL staining of Ksp-Cre/Tfamflox/flox and Ksp-Cre/Tfamflox/floxSTING−/− mice. Scale bar = 10 μm. (H) Relative mRNA levels of mitochondrial genes (Cox4, mt-Cox1, and mt-Uqcrc2) and lipid metabolism associated genes (Ppara, Cpt1a, and Acox1) in Ksp-Cre/Tfamflox/flox and Ksp-Cre/Tfamflox/floxSTING−/− mice. (I) mtDNA copy number and (J) ATP concentration per protein was measured in Ksp-Cre/Tfamflox/flox and Ksp-Cre/Tfamflox/floxSTING−/− mice. * P < 0.05 vs. wild type kidneys. (K) Study design of STING inhibitor (C-176) experiment. (L) Weight changes of control and Ksp-Cre/Tfamflox/flox mice treated with C-176 or vehicle. * P < 0.05 vs. vehicle treated mice, # P < 0.05 vs. vehicle treated mice. (M) Blood urea nitrogen levels were measured in Ksp-Cre/Tfamflox/flox mice treated with C-176 or vehicle. * P < 0.05 vs. vehicle treated mice. (N) Representative images of Sirius-red staining in 12 weeks old Ksp-Cre/Tfamflox/flox mice treated with C-176 or vehicle. Scale bar = 20μm. (O) Relative mRNA levels of inflammatory marker genes (Lyz2, Emr1, and Cd68) and pro-inflammatory cytokine genes (Tnfa, Il1b, Il6, and Ccl2) in Ksp-Cre/Tfamflox/flox mice treated with C-176 or vehicle. * P < 0.05 vs. vehicle treated mice.
Figure 7.
Figure 7.. STING plays and important role in kidney fibrosis.
(A) Periodic acid-Schiff (PAS) staining and Picrosirius-red staining of FA-injected WT and STING−/− mice. (B) Relative mRNA levels of fibrosis-associated genes (Tgfb1, Col1, Col3, Vim, and Fn1), ** P < 0.01, *** P< 0.001 vs. WT. # P < 0.01 vs. FA mice. (n = 3) (C) pro-inflammatory cytokines (Tnfa, Il1b, Il6, CCL5 and Cxcl10), (D) inflammatory cell marker genes (Lyz2, Emr1, and Cd68) in Wt and STING−/− mice injected with vehicle or FA. ** P < 0.01, *** P< 0.001 vs. WT. # P < 0.01 vs. FA mice. (E) Representative images showing TUNEL staining of WT and STING−/− mice injected with vehicle or FA. Scale bar = 10μm (F) Relative mRNA levels of apoptosis-related genes (Bim, Bax, Tp53, Bcl2, and Bcl2l1) in kidneys of WT and STING−/− mice injected with vehicle/FA. *** P < 0.001 vs. WT. # P < 0.01 vs. FA mice. (G) Ki67 positive staining (Scale bar = 20 μm) and (H) relative mRNA levels of cell proliferative markers (Myc, Ccnb1, Ccnd1, and Ccne1) of WT and STING−/− mice injected with vehicle/FA kidneys. *** P < 0.001 vs. WT. # P < 0.01 vs. FA mice. (I) Transcript level (RNA-sequencing) of STING (TMEM173) and cGAS (MB21D1), correlates with the degree of kidney fibrosis in 433 microdissected human kidney tubule samples.

Comment in

References

    1. Beckerman P, Qiu C, Park J, Ledo N, Ko YA, Park AD, Han SY, Choi P, Palmer M, and Susztak K (2017). Human Kidney Tubule-Specific Gene Expression Based Dissection of Chronic Kidney Disease Traits. EBioMedicine 24, 267–276. - PMC - PubMed
    1. Bonnet F, and Scheen AJ (2018). Effects of SGLT2 inhibitors on systemic and tissue low-grade inflammation: The potential contribution to diabetes complications and cardiovascular disease. Diabetes Metab 44, 457–464. - PubMed
    1. Breyer MD, and Susztak K (2016). The next generation of therapeutics for chronic kidney disease. Nat Rev Drug Discov 15, 568–88 - PMC - PubMed
    1. Bronner DN, Abuaita BH, Chen X, Fitzgerald KA, Nuñez G, He Y, Yin XM, O’Riordan MX (2015). Endoplasmic Reticulum Stress Activates the Inflammasome via NLRP3- and Caspase-2-Driven Mitochondrial Damage 43, 451–62. - PMC - PubMed
    1. Bronner DN and O’Riordan MX (2016). Measurement of Mitochondrial DNA Release in Response to ER Stress. Bio-protocol 6, e1839. - PMC - PubMed

Publication types