Comparative Study
. 2019 Oct 3;76(1):110-125.e9.
doi: 10.1016/j.molcel.2019.08.005. Epub 2019 Aug 29.

Polyamines Control eIF5A Hypusination, TFEB Translation, and Autophagy to Reverse B Cell Senescence

Affiliations
Comparative Study

Polyamines Control eIF5A Hypusination, TFEB Translation, and Autophagy to Reverse B Cell Senescence

Hanlin Zhang et al. Mol Cell. .

Abstract

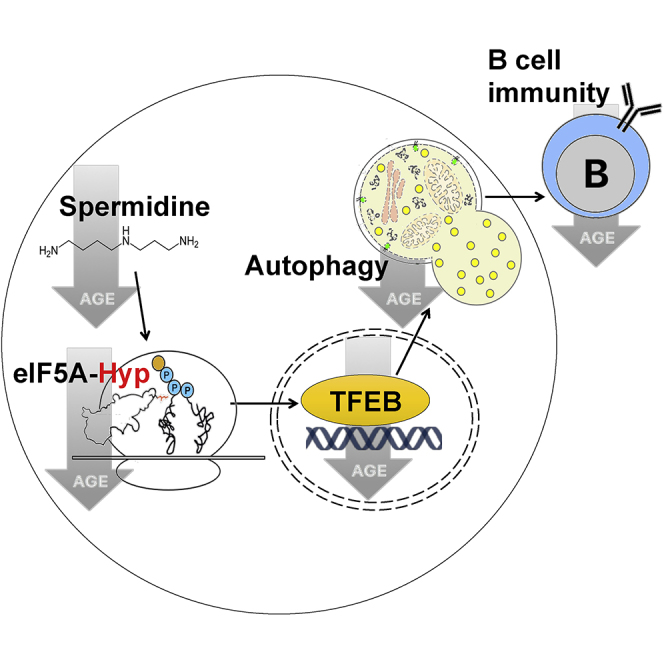
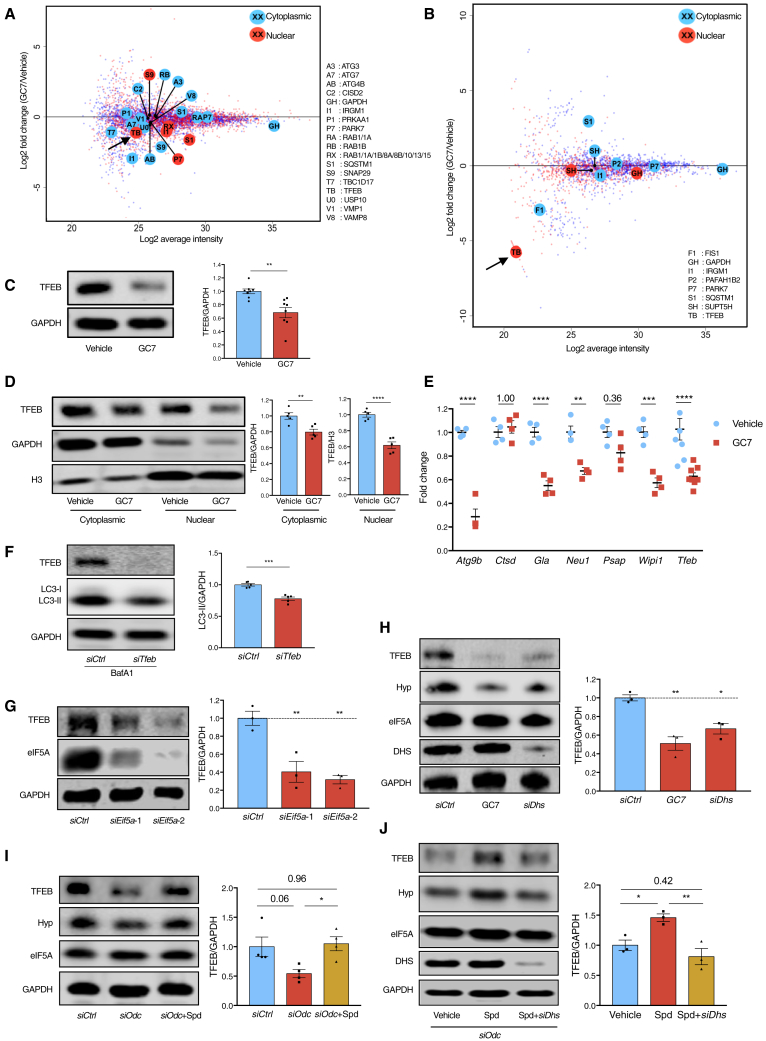
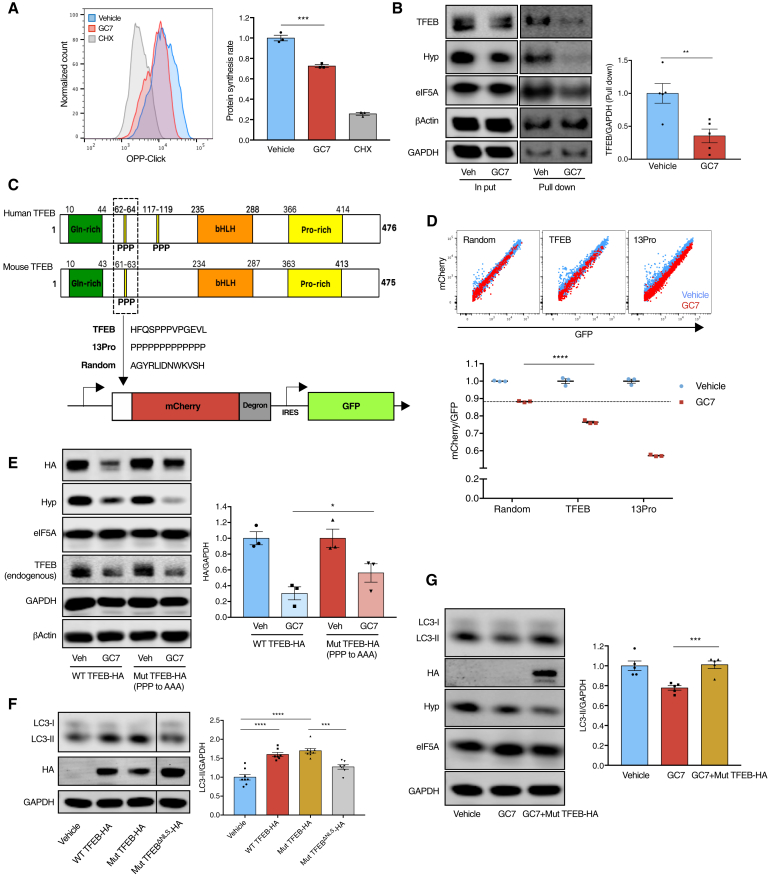
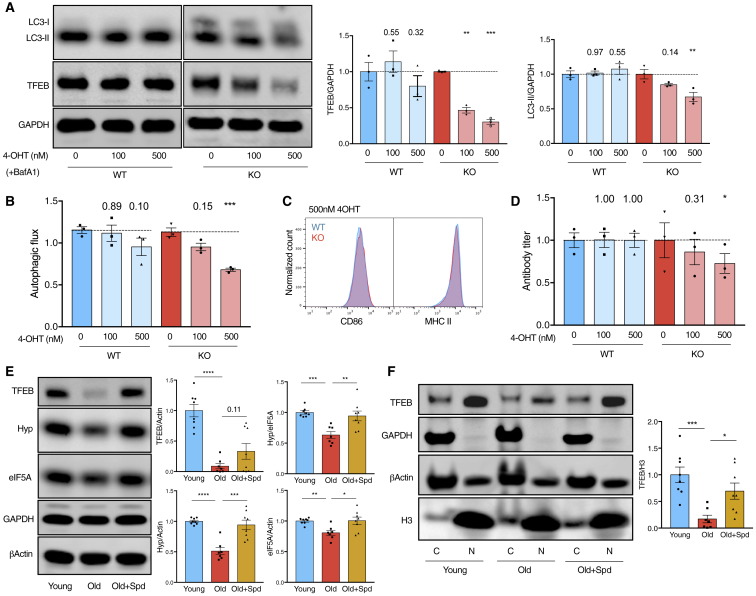
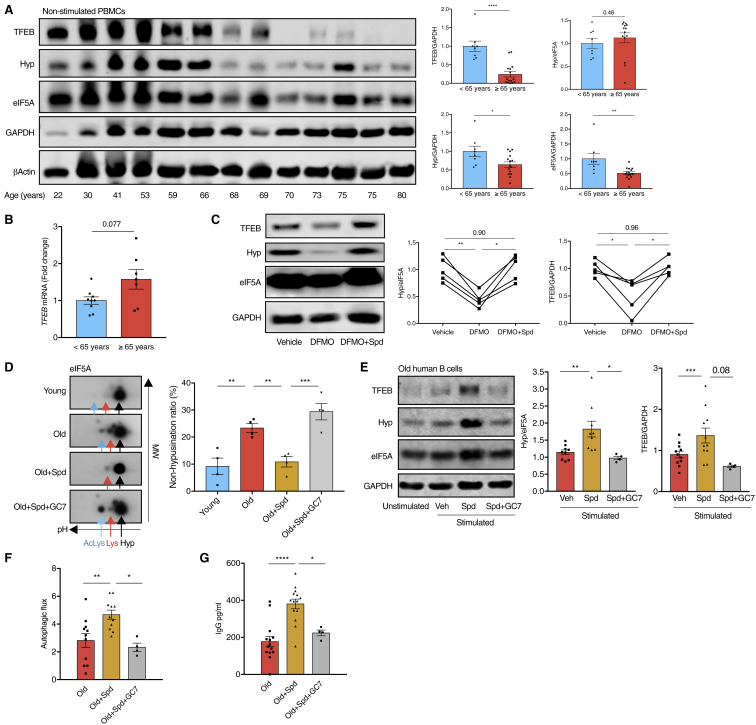
Failure to make adaptive immune responses is a hallmark of aging. Reduced B cell function leads to poor vaccination efficacy and a high prevalence of infections in the elderly. Here we show that reduced autophagy is a central molecular mechanism underlying immune senescence. Autophagy levels are specifically reduced in mature lymphocytes, leading to compromised memory B cell responses in old individuals. Spermidine, an endogenous polyamine metabolite, induces autophagy in vivo and rejuvenates memory B cell responses. Mechanistically, spermidine post-translationally modifies the translation factor eIF5A, which is essential for the synthesis of the autophagy transcription factor TFEB. Spermidine is depleted in the elderly, leading to reduced TFEB expression and autophagy. Spermidine supplementation restored this pathway and improved the responses of old human B cells. Taken together, our results reveal an unexpected autophagy regulatory mechanism mediated by eIF5A at the translational level, which can be harnessed to reverse immune senescence in humans.

Keywords: B cell; TFEB; aging; autophagy; eIF5A; spermidine.


Conflict of interest statement

A.B. is a co-founder of CASMA Therapeutics.

Figures

None
Graphical abstract
Figure 1
Figure 1
Six-Week In Vivo Treatment with Spermidine Induces Autophagy but Does Not Affect Hematopoiesis in Old Mice (A) The autophagic flux of indicated cell types from young mice (12 weeks), old mice (24 months), and old mice administered spermidine (Spd) for 6 weeks was measured using LC3-II staining using flow cytometry after 2 h treatment with bafilomycin A1 (BafA1). Representative LC3-II plots of hematopoietic stem cells (HSCs) and CD4+ T cells are shown (left). Autophagic flux was calculated as LC3-II geometric mean fluorescence intensity: (BafA1-Vehicle)/Vehicle (right). LMPP, lymphoid-biased multipotent progenitor; MPP, multipotent progenitor. n = 5, 6, and 7 mice for young, old, and old + Spd, respectively. (B–F) Absolute count of indicated cell types in mice treated as in (A). (B) Expanded hematopoietic stem and progenitor cells in old mice. LSK, LinSca1+cKit+ cell. n = 6 or 7 mice. (C) Old mice are lymphopenic (spleen). n = 6–17 mice. (D) Expanded myeloid progenitors in bone marrow of old mice. GMP, granulocyte-macrophage progenitor; MkP, megakaryocyte progenitor; Pre-GM, pre-granulocyte/macrophage; Pre-MegE, pre-megakaryocyte/erythrocyte; Pro-Ery, pro-erythroblast cell. n = 6 or 7 mice. (E) Hardy fractions (A–F) and their correlation with B cell developmental stages. CLP, common lymphoid progenitor; FO, follicular B cell (mature recirculating B cell); NF, newly formed B cell; Pre-B, precursor B cell; Pro-B, progenitor B cell. (F) B cell development is mildly blocked at the pro-B cell stage in old mice. n = 7–11 mice. Data are represented as mean ± SEM. Two-tailed Student’s t test for comparison of young versus old; one-tailed Student’s t test for comparison of old versus old + Spd (A). Two-tailed Welch’s t test (B–F). p ≤ 0.05, ∗∗p ≤ 0.01, ∗∗∗p ≤ 0.001, and ∗∗∗∗p ≤ 0.0001. See also Figure S1.
Figure 2
Figure 2
Spermidine Restores B Cell Responses in Old Mice (A) Representative plot of LC3-II staining of B cells (CD19+) from Figure 1A. (B) Autophagy (LC3-II) of purified B cells from wild-type mice (treated as in Figure 1A) was assessed using western blot. n = 6 or 7 mice. (C) Old GFP-LC3 transgenic mice were administered spermidine as in Figure 1A. The GFP-LC3 puncta of purified B cells were measured using confocal microscopy. N = 210–616 cells from four to six mice. (D) Young or old mice were immunized with NP-CGG and administered spermidine throughout the experiment. Serum NP-specific IgG1 titers were measured using ELISA. n = 14 (young) or 10 (old/old + spd) mice from two experiments. (E) B cell-specific Atg7-KO mice (Mb1-Cre, Atg7f/f) were immunized and IgG1 responses assessed as in (D). n = 7 (B-Atg7+/+) or n = 3 (B-Atg7−/−) mice. (F) Mice from (D) were culled on day 75, and bone marrow plasma cells secreting NP-specific IgG1 were measured using ELISpot. n = 6–9 mice. Data are represented as mean ± SEM. Paired one-tailed Student’s t test (B). Mann-Whitney test (C). Welch’s t test (D–F). p values were adjusted using the Holm-Sidak method for multiple comparisons of the three time points in (D) and (E). p ≤ 0.05, ∗∗p ≤ 0.01, ∗∗∗p ≤ 0.001, and ∗∗∗∗p ≤ 0.0001. See also Figure S2.
Figure 3
Figure 3
Spermidine Maintains Cellular Autophagy by Hypusinating eIF5A. (A) Spermidine synthesis and eIF5A hypusination pathway in eukaryotes. (B) NIH 3T3 cells were transfected with non-targeting control siRNA (siCtrl), siOdc with or without 10 μM spermidine for 3 days, or treated with DFMO for 24 h where indicated. Cellular spermidine levels were measured using GC-MS. n = 3. (C) NIH 3T3 cells were treated with DFMO and spermidine as indicated for 24 h. n = 3. (D) NIH 3T3 cells were transfected with siCtrl or siEif5a-1/2 for 3 days. n = 3. siEif5a-2 was used in all other figures unless specified otherwise. (E) The KO of Dohh was induced by 4-OHT for indicated days in immortalized transgenic MEFs. n = 3 or 4. (F) Spermidine-depleted NIH 3T3 cells by siOdc transfection were rescued with spermidine alone or spermidine together with siDhs. LC3-II was measured 3 days post-transfection. n = 3. (G and H) Purified murine B cells were cultured with LPS for indicated days. LC3-II and/or eIF5A expression was measured using flow cytometry (G, n = 3 mice) and western blot (H, n = 7 mice). (I) B cells were cultured as in (G) for 3 days with indicated concentrations of GC7 added on day 2 for 24 h. n = 6–10 mice. To measure autophagic flux, cells were treated with 10 nM BafA1 for 2 h before harvesting where indicated. Data represented as mean ± SEM. One-way or two-way ANOVA with post hoc Dunnett’s test (D, E, and G, where LC3-II levels under either basal [red bars] or BafA1 [red + blue bars] conditions are compared, H and I). One-way ANOVA with post hoc Tukey’s test (B, C, and F). p ≤ 0.05, ∗∗p ≤ 0.01, ∗∗∗p ≤ 0.001, and ∗∗∗∗p ≤ 0.0001. See also Figures S3 and S4.
Figure 4
Figure 4
eIF5A Hypusination Is Required for TFEB Expression (A) Murine B cells were treated with 10 μM GC7 as in Figure 3I and fractionated for label-free quantitative protein MS analysis. Identified autophagy proteins are highlighted by enlarged, annotated circles. (B) Murine B cells were cultured in medium containing amino acids with heavy isotope labeling (GC7 treated) or light isotopes (vehicle). Cells that had divided four times or more were sorted by flow cytometry and mixed at 1:1 ratio (heavy: light isotope labeling), followed by cell fractionation and protein MS analysis. For the repeat, the labeling was swapped. Data represent the average of protein changes from the two repeats. Identified autophagy proteins are highlighted as in (A). (C–E) Murine B cells were treated with GC7 as in (A). The overall TFEB (C) and cytoplasmic/nuclear TFEB (D) were assessed using western blot. (E) The expression of TFEB-target genes was measured using qPCR with Gapdh as the reference gene. n = 4–8 mice. (F–I) NIH 3T3 cells were transfected with siTfeb (F), siEif5a (G), siDhs (H), or siOdc (I) and treated with 10 μM spermidine where indicated (I) for 3 days or treated with 100 μM GC7 for 24 h (H). LC3-II (F) or TFEB (G–I) was measured using western blot. n = 3–5. (J) NIH 3T3 cells were transfected with siOdc to deplete endogenous spermidine and treated with 10 μM spermidine alone or in combination with siDhs transfection. n = 3. Data are represented as mean ± SEM. Student’s t test (C, D, and F). Two-way ANOVA with post hoc Sidak’s test (E). One-way ANOVA with post hoc Dunnett’s test (G and H) or Tukey’s test (I and J). p ≤ 0.05, ∗∗p ≤ 0.01, ∗∗∗p ≤ 0.001, and ∗∗∗∗p ≤ 0.0001. See also Figure S5.
Figure 5
Figure 5
Hypusinated eIF5A Regulates TFEB Synthesis (A) LPS-stimulated murine splenocytes were treated with GC7 as in Figure 3I or with cycloheximide (CHX) for 2 h. The relative protein synthesis rate of B cells (B220+CD19+) was measured using OPP-Click assay with flow cytometry. n = 3. (B) Nascent proteins of GC7-treated murine B cells were labeled with AHA for 4 h, conjugated to biotin by click reaction, and pulled down for western blot. n = 5 mice. (C) The polyproline motif of TFEB with its surrounding sequence was inserted before mCherry-degron to report on protein translation. GFP was used to report on transfection. Thirteen consecutive prolines (13Pro) was used as positive control for translational stalling, while 13 random amino acids (random) was used as negative control. (D) NIH 3T3 cells were transfected with the plasmids in (C) for 24 h and treated together with GC7. The expression of GFP and mCherry was measured using flow cytometry. n = 3. (E–G) NIH 3T3 cells were transfected with the plasmids expressing wild-type (WT TFEB-HA) (E and F), mutant (Mut TFEB-HA, PPP to AAA) (E–G), or NLS-mutated (ΔNLS, RRRR to AAAA) mutant (F) murine TFEB fused with an HA tag at C terminus for 24 h, treated together with GC7 (E and G). The expression of HA-tagged TFEB (E) and LC3-II (F and G) was assessed using western blot. Irrelevant lanes from the same membrane were removed (F). n = 3–8. Data are represented as mean ± SEM. Student’s t test (A, B, D, and G), paired t test (E), or one-way ANOVA with post hoc Tukey’s test (F). p ≤ 0.05, ∗∗p ≤ 0.01, ∗∗∗p ≤ 0.001, and ∗∗∗∗p ≤ 0.0001. See also Figure S5.
Figure 6
Figure 6
Spermidine Induces the Expression of Hypusinated eIF5A and TFEB in Old Mice (A–D) Splenic B cells from tamoxifen-inducible Tfeb-KO mice (WT: CAG-Cre/Esr1+, Tfeb+/+; KO: CAG-Cre/Esr1+, Tfebf/f) were cultured with IL4/anti-CD40 and 4-OHT for 4 days. The expression of TFEB, LC3-II, and the activation markers CD86/MHC II were assessed using western blot (A) and flow cytometry (B and C). The autophagic flux was calculated as in Figure 1A. IgM in culture supernatants was measured using ELISA (D). n = 3 mice. (E and F) B cells were purified from young mice (6 weeks), old mice (24 months), or old mice administered spermidine for 6 weeks. The expression of overall eIF5A, hypusinated eIF5A, overall TFEB (E), cytoplasmic (C) and nuclear (N) TFEB (F) was assessed using western blot (n = 7 or 8 mice, combined from two independent experiments). Data are represented as mean ± SEM. Two-way ANOVA with post hoc Dunnett’s test (A, B, and D). Welch’s t test (E and F). p ≤ 0.05, ∗∗p ≤ 0.01, ∗∗∗p ≤ 0.001, and ∗∗∗∗p ≤ 0.0001. See also Figure S6.
Figure 7
Figure 7
Spermidine Induces TFEB Expression and Improves the Function of Old Human B Cells (A) The protein levels of TFEB, hypusinated eIF5A, and overall eIF5A of PBMCs from healthy human donors of indicated ages were assessed using western blot. A representative plot (left) and quantifications (right) are shown. n = 8–15 donors. (B) TFEB mRNA of human PBMCs was measured using qPCR with GAPDH as the reference gene. n = 7–9 donors. (C) Sorted B cells from young human donors were cultured with anti-IgM/CD40L and treated with DFMO with or without 10 μM spermidine for 7 days. n = 5 donors. (D) Sorted B cells from human donors were cultured as in (C) with spermidine and/or GC7 as indicated. The expression of hypusinated (Hyp) or non-hypusinated (AcLys or Lys) eIF5A was distinguished by two-dimensional western blot of eIF5A. Black arrow, hypusinated Lys50, pH 5.2; red arrow, unmodified Lys50, pH 5.1; blue arrow, acetylated Lys47 with unmodified Lys50, pH 5.0. The non-hypusination ratio was calculated as eIF5A dot densitometric intensity (AcLys + Lys)/(AcLys + Lys + Hyp). n = 4 donors. (E–G) Sorted B cells from old human donors (age 77.5 ± 6.3 years) were cultured as in (C) together with spermidine and GC7. (E) The protein levels of TFEB and eIF5A hypusination were measured using western blot. (F) Autophagic flux was determined by flow cytometry as in Figure 1A. (G) Supernatant IgG was assessed using ELISA. n = 4–14 donors. Data are represented as mean ± SEM. Unpaired two-tailed Student’s t test (A and D, comparison of young versus old). Welch’s t test (B). Paired one-way ANOVA with post hoc Tukey’s test (C). Paired one-tailed t test (D, comparisons of old versus old + Spd, old + Spd versus old + Spd + GC7 comparison, E–G). p ≤ 0.05, ∗∗p ≤ 0.01, ∗∗∗p ≤ 0.001, and ∗∗∗∗p ≤ 0.0001. See also Figure S7.

Comment in

Similar articles

Cited by

References

    1. Bjedov I., Toivonen J.M., Kerr F., Slack C., Jacobson J., Foley A., Partridge L. Mechanisms of life span extension by rapamycin in the fruit fly Drosophila melanogaster. Cell Metab. 2010;11:35–46. - PMC - PubMed
    1. Cambridge S.B., Gnad F., Nguyen C., Bermejo J.L., Krüger M., Mann M. Systems-wide proteomic analysis in mammalian cells reveals conserved, functional protein turnover. J. Proteome Res. 2011;10:5275–5284. - PubMed
    1. Chen M., Hong M.J., Sun H., Wang L., Shi X., Gilbert B.E., Corry D.B., Kheradmand F., Wang J. Essential role for autophagy in the maintenance of immunological memory against influenza infection. Nat. Med. 2014;20:503–510. - PMC - PubMed
    1. Clarke A.J., Ellinghaus U., Cortini A., Stranks A., Simon A.K., Botto M., Vyse T.J. Autophagy is activated in systemic lupus erythematosus and required for plasmablast development. Ann. Rheum. Dis. 2015;74:912–920. - PMC - PubMed
    1. Cossarizza A., Chang H.D., Radbruch A., Akdis M., Andrä I., Annunziato F., Bacher P., Barnaba V., Battistini L., Bauer W.M. Guidelines for the use of flow cytometry and cell sorting in immunological studies. Eur. J. Immunol. 2017;47:1584–1797. - PMC - PubMed

Publication types

MeSH terms

Substances