

Determinants of Inter-Individual Variability in Corticomotor Excitability Induced by Paired Associative Stimulation
- PMID: 31474818
- PMCID: PMC6702284
- DOI: 10.3389/fnins.2019.00841
Determinants of Inter-Individual Variability in Corticomotor Excitability Induced by Paired Associative Stimulation
Abstract
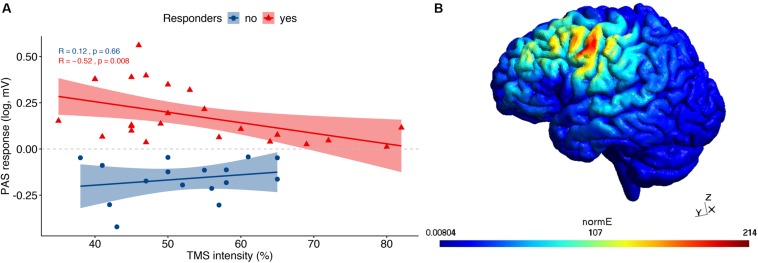
Transcranial magnetic stimulation (TMS) is a well-established tool in probing cortical plasticity in vivo. Changes in corticomotor excitability can be induced using paired associative stimulation (PAS) protocol, in which TMS over the primary motor cortex is conditioned with an electrical peripheral nerve stimulation of the contralateral hand. PAS with an inter-stimulus interval of 25 ms induces long-term potentiation (LTP)-like effects in cortical excitability. However, the response to a PAS protocol tends to vary substantially across individuals. In this study, we used univariate and multivariate data-driven methods to investigate various previously proposed determinants of inter-individual variability in PAS efficacy, such as demographic, cognitive, clinical, neurophysiological, and neuroimaging measures. Forty-one right-handed participants, comprising 22 patients with amnestic mild cognitive impairment (MCI) and 19 healthy controls (HC), underwent the PAS protocol. Prior to stimulation, demographic, genetic, clinical, as well as structural and resting-state functional MRI data were acquired. The two groups did not differ in any of the variables, except by global cognitive status. Univariate analysis showed that only 61% of all participants were classified as PAS responders, irrespective of group membership. Higher PAS response was associated with lower TMS intensity and with higher resting-state connectivity within the sensorimotor network, but only in responders, as opposed to non-responders. We also found an overall positive correlation between PAS response and structural connectivity within the corticospinal tract, which did not differ between groups. A multivariate random forest (RF) model identified age, gender, education, IQ, global cognitive status, sleep quality, alertness, TMS intensity, genetic factors, and neuroimaging measures (functional and structural connectivity, gray matter (GM) volume, and cortical thickness as poor predictors of PAS response. The model resulted in low accuracy of the RF classifier (58%; 95% CI: 42 - 74%), with a higher relative importance of brain connectivity measures compared to the other variables. We conclude that PAS variability in our sample was not well explained by factors known to influence PAS efficacy, emphasizing the need for future replication studies.
Keywords: DTI; TMS; corticospinal tract; paired associative stimulation; random forest; resting-state fMRI; sensorimotor network.
Figures


Similar articles
-
Motor cortical excitability and paired-associative stimulation-induced plasticity in amnestic mild cognitive impairment and Alzheimer's disease.Clin Neurophysiol. 2021 Sep;132(9):2264-2273. doi: 10.1016/j.clinph.2021.01.011. Epub 2021 Feb 3. Clin Neurophysiol. 2021. PMID: 33612394
-
Paired Associative Electroacupuncture and Transcranial Magnetic Stimulation in Humans.Front Hum Neurosci. 2019 Feb 12;13:49. doi: 10.3389/fnhum.2019.00049. eCollection 2019. Front Hum Neurosci. 2019. PMID: 30809140 Free PMC article.
-
Modulation of excitability in human primary somatosensory and motor cortex by paired associative stimulation targeting the primary somatosensory cortex.Eur J Neurosci. 2011 Oct;34(8):1292-300. doi: 10.1111/j.1460-9568.2011.07849.x. Epub 2011 Oct 6. Eur J Neurosci. 2011. PMID: 21978102
-
A Systematic Review of Paired Associative Stimulation (PAS) to Modulate Lower Limb Corticomotor Excitability: Implications for Stimulation Parameter Selection and Experimental Design.Front Neurosci. 2019 Aug 27;13:895. doi: 10.3389/fnins.2019.00895. eCollection 2019. Front Neurosci. 2019. PMID: 31507367 Free PMC article.
-
Modulation of human corticospinal excitability by paired associative stimulation.Front Hum Neurosci. 2013 Dec 3;7:823. doi: 10.3389/fnhum.2013.00823. Front Hum Neurosci. 2013. PMID: 24348369 Free PMC article. Review.
Cited by
-
Association Between Responsiveness to Transcranial Magnetic Stimulation and Interhemispheric Functional Connectivity of Sensorimotor Cortex in Older Adults.Brain Connect. 2023 Feb;13(1):39-50. doi: 10.1089/brain.2021.0180. Epub 2022 Jun 27. Brain Connect. 2023. PMID: 35620910 Free PMC article.
-
Cortical excitability and plasticity in Alzheimer's disease and mild cognitive impairment: A systematic review and meta-analysis of transcranial magnetic stimulation studies.Ageing Res Rev. 2022 Aug;79:101660. doi: 10.1016/j.arr.2022.101660. Epub 2022 Jun 6. Ageing Res Rev. 2022. PMID: 35680080 Free PMC article.
-
Convergent Associative Motor Cortical Plasticity Induced by Conditional Somatosensory and Motor Reaction Afferents.Front Hum Neurosci. 2020 Oct 21;14:576171. doi: 10.3389/fnhum.2020.576171. eCollection 2020. Front Hum Neurosci. 2020. PMID: 33192405 Free PMC article.
-
Targeted Modulation of Human Brain Interregional Effective Connectivity With Spike-Timing Dependent Plasticity.Neuromodulation. 2023 Jun;26(4):745-754. doi: 10.1016/j.neurom.2022.10.045. Epub 2022 Nov 18. Neuromodulation. 2023. PMID: 36404214 Free PMC article.
-
Spontaneous Fluctuations in Oscillatory Brain State Cause Differences in Transcranial Magnetic Stimulation Effects Within and Between Individuals.Front Hum Neurosci. 2021 Dec 2;15:802244. doi: 10.3389/fnhum.2021.802244. eCollection 2021. Front Hum Neurosci. 2021. PMID: 34924982 Free PMC article. Review.
References
-
- Albert M. S., DeKosky S. T., Dickson D., Dubois B., Feldman H. H., Fox N. C., et al. (2011). The diagnosis of mild cognitive impairment due to Alzheimer’s disease: recommendations from the national institute on aging-Alzheimer’s Association workgroups on diagnostic guidelines for Alzheimer’s disease. Alzheimers Dement. 7 270–279. 10.1016/j.jalz.2011.03.008 - DOI - PMC - PubMed
LinkOut - more resources
Full Text Sources
Medical