. 2019 Aug 14:12:198.
doi: 10.3389/fnmol.2019.00198. eCollection 2019.

Secreted Amyloid Precursor Protein-Alpha Promotes Arc Protein Synthesis in Hippocampal Neurons

Affiliations

Secreted Amyloid Precursor Protein-Alpha Promotes Arc Protein Synthesis in Hippocampal Neurons

Rhys W Livingstone et al. Front Mol Neurosci. .

Abstract

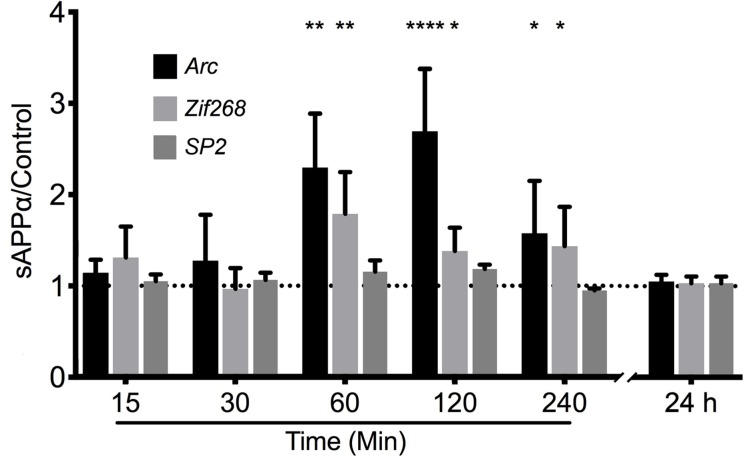
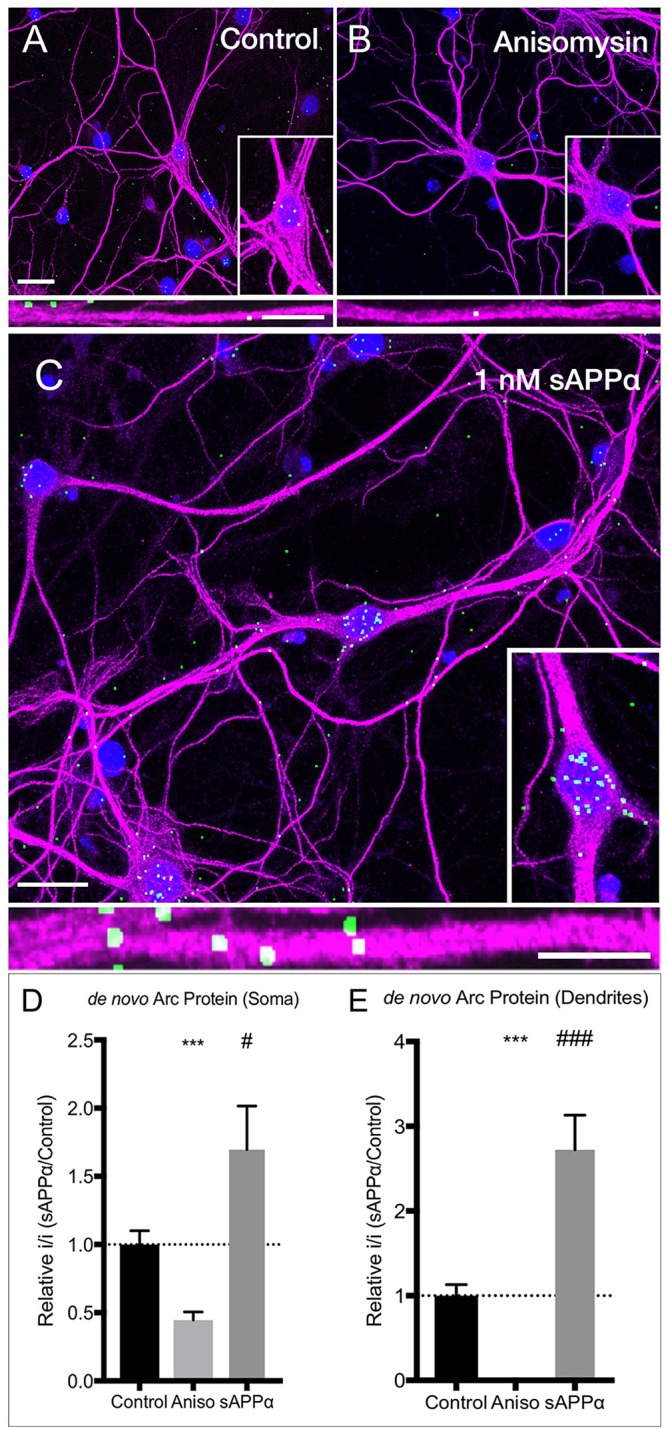
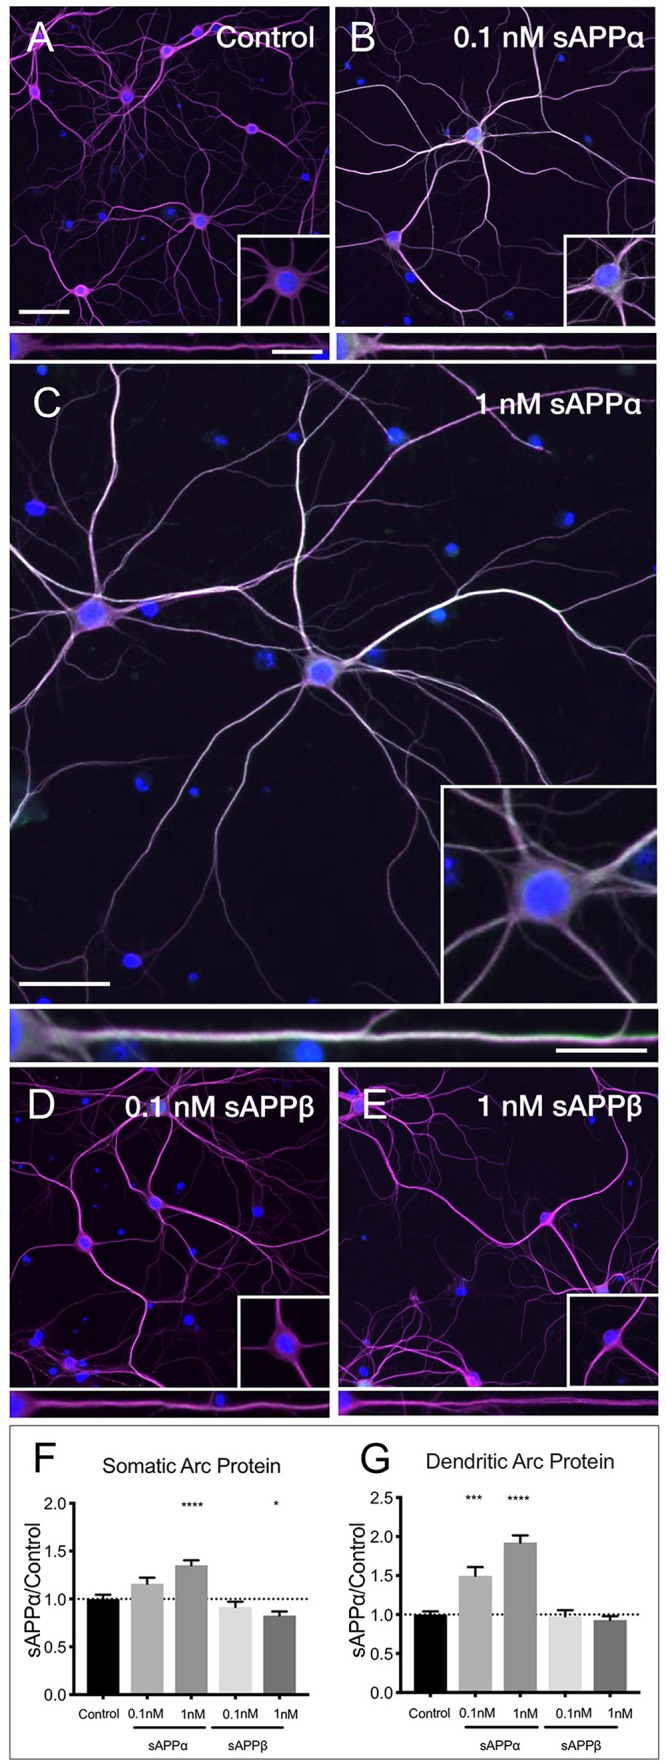
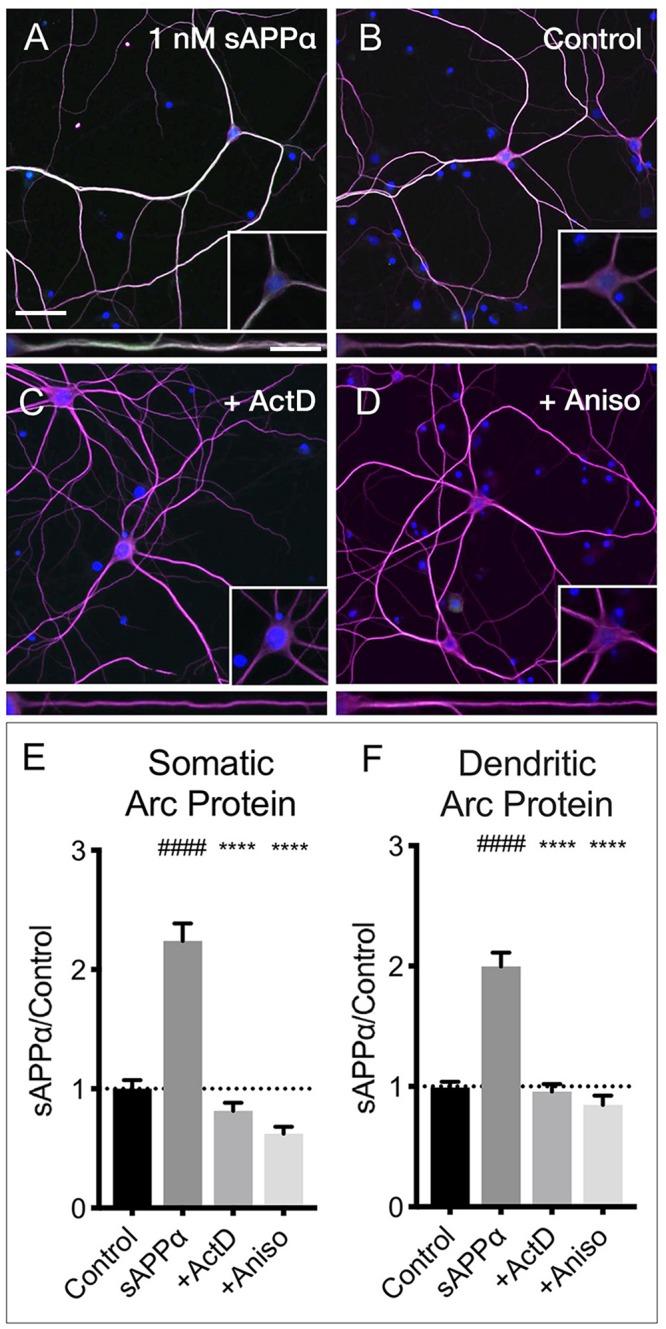
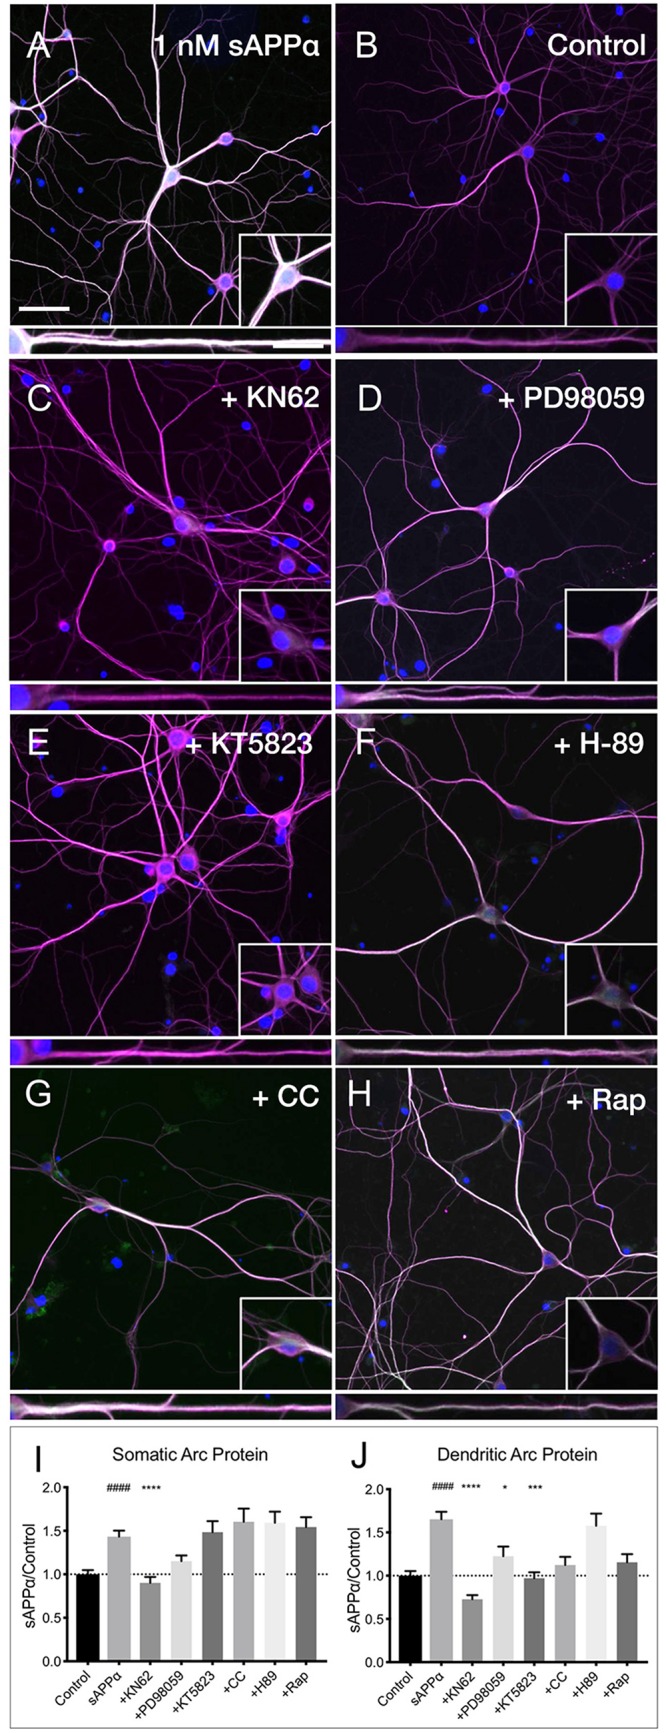
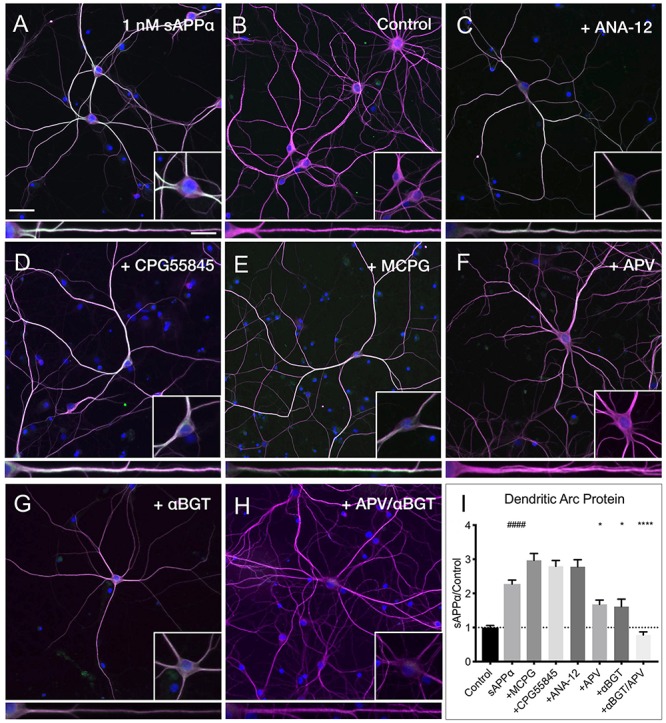
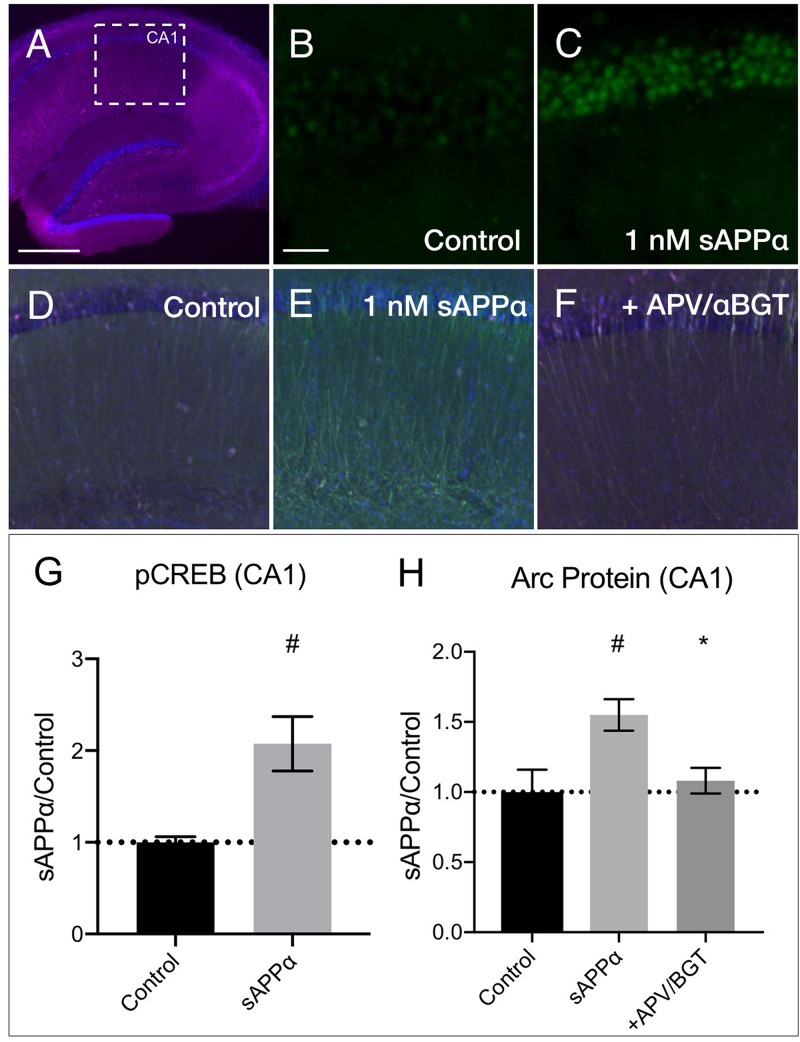
Secreted amyloid precursor protein-α (sAPPα) is a neuroprotective and memory-enhancing molecule, however, the mechanisms through which sAPPα promotes these effects are not well understood. Recently, we have shown that sAPPα enhances cell-surface expression of glutamate receptors. Activity-related cytoskeletal-associated protein Arc (Arg3.1) is an immediate early gene capable of modulating long-term potentiation, long-term depression and homeostatic plasticity through regulation of α-amino-3-hydroxy-5-methyl-4-isoxazolepropionic acid receptor localization. Accordingly, we hypothesized that sAPPα may enhance synaptic plasticity, in part, by the de novo synthesis of Arc. Using primary cortical and hippocampal neuronal cultures we found that sAPPα (1 nM, 2 h) enhances levels of Arc mRNA and protein. Arc protein levels were increased in both the neuronal somata and dendrites in a Ca2+/calmodulin-dependent protein kinase II-dependent manner. Additionally, dendritic Arc expression was dependent upon activation of mitogen-activated protein kinase and protein kinase G. The enhancement of dendritic Arc protein was significantly reduced by antagonism of N-methyl-D-aspartate (NMDA) and nicotinic acetylcholine (α7nACh) receptors, and fully eliminated by dual application of these antagonists. This effect was further corroborated in area CA1 of acute hippocampal slices. These data suggest sAPPα-regulated plasticity within hippocampal neurons is mediated by cooperation of NMDA and α7nACh receptors to engage a cascade of signal transduction molecules to enhance the transcription and translation of Arc.

Keywords: Alzheimer’s disease; Arc/Arg3.1; FUNCAT-PLA; NMDA; PKG; plasticity; sAPPα; α7nACh.


Figures

FIGURE 1
FIGURE 1
Primary cell cultures display normal expression of cellular and synaptic markers at DIV24-27. (A) Representative immunocytochemistry images of DIV 21-27 neurons show the colocalization of the presynaptic protein synapsin-1 (red) and the postsynaptic AMPA receptor subunit GluA1 (green) with MAP2-positive neurons (magenta) and nuclei (DAPI; blue) (scale bar = 50 μm). Lower panels show further magnified dendritic compartments (100 μm) from Synapsin-1 (top), GluA1 (middle) and the colocalization of both (bottom; scale bar = 10 μm). Primary cell cultures also show populations of (B) GFAP-positive astrocytes (magenta) closely associating with GluA1-positive neurons (green). Inset images show further magnified somatic compartments. (C) Representative electron micrograph showing the presence of synapses between neighboring primary hippocampal cells in culture. Pre- and postsynaptic regions were observed separated by a synaptic cleft. Pre, presynaptic terminal; Post, postsynaptic region; PRs, polyribosomes; PSD, postsynaptic density; SC, synaptic cleft; M, mitochondria. Scale bar = 100 nm.
FIGURE 2
FIGURE 2
sAPPα promotes the transcription of Arc and Zif268 mRNA. RT-qPCR showed that sAPPα (1 nM) promotes an increase in the expression of Arc mRNA in primary cortical cells in culture at 60, 120 min (n = 5) and 240 min (n = 4) relative to no-drug controls (n = 9; mean ± SEM). No significant change was detected at 15 or 30 min, nor 24 h (n = 4), nor was there a significant change in the negative control gene SP2 (n = 4). One sample t-tests; p ≤ 0.05, ∗∗p ≤ 0.01, ∗∗∗∗p ≤ 0.0001.
FIGURE 3
FIGURE 3
sAPPα increases somatic and dendritic expression of de novo Arc protein. Representative images show neurons (MAP2 positive neurons; magenta) expressing FUNCAT-PLA signal (green puncta) representing newly synthesized Arc protein in (A) no-drug control cells, (B) anisomycin-treated, and (C) sAPPα-treated (1 nM, 2 h) primary hippocampal cultures. Nuclei are stained blue (DAPI). The relative integrated intensity of (D) somatic and (E) dendritic signal from treatment groups is expressed as drug/average of control and presented as mean ± SEM (n = 25–34 cells from three independent experiments). Co-incubation of AHA with anisomycin inhibited Arc protein synthesis. Incubation with sAPPα significantly increased the expression of de novo synthesized Arc protein in the somata and dendrites. Images show whole cell (scale bar = 50 μm), and magnified somatic (inset, bottom right) and dendritic (50 μm; lower panels; scale bar = 10 μm). Outliers were removed from each experiment prior to amalgamation using Grubb’s tests, and normality was detected by D’Agostino and Pearson omnibus normality tests. Significance was calculated on data expressed relative to control by use of one sample t-tests; hashes (#) indicate significance between control and sAPPα-treated, asterisks () indicate significance between control and anisomycin treated, #p = 0.038, ∗∗∗/### p ≤ 0.0001.
FIGURE 4
FIGURE 4
sAPPα promotes Arc protein expression in a concentration- dependent manner. Representative images showing Arc protein levels in (A) no drug control, (B) 0.1 nM sAPPα, (C) 1 nM sAPPα, (D) 0.1 nM sAPPβ and (E) 1 nM sAPPβ-treated primary hippocampal neurons. (F) Average data showing 1 nM sAPPα promotes an increase, and 1 nM sAPPβ a modest decrease in Arc protein expression in the somata. (G) Average data showing 0.1 and 1 nM sAPPα promotes an increase in dendritic Arc protein. Data are expressed as mean ± SEM from ≥4 experiments. 0.1 nM: n = 40 cells; 1 nM: n = 80 cells. Significance was calculated using a Kruskal–Wallis one-way ANOVA with Dunn’s multiple comparisons test. p = 0.0378, ∗∗∗p = 0.0002, ∗∗∗∗p ≤ 0.0001. Representative images show neuronal somata and dendritic projections (MAP2; magenta), Arc protein (green), nuclei (DAPI; blue), (scale bar = 50 μm), and magnified somatic (inset, bottom right) and dendritic (100 μm; lower panels; scale bar = 10 μm) compartments.
FIGURE 5
FIGURE 5
Arc protein expression increases throughout primary and secondary dendrites. Average fluorescent intensity of Arc expression throughout (A) primary and (B) secondary dendrites (mean ± SEM, n = 40–141). Significance was determined by averaging dendritic gray value within each cell and is expressed per treatment group within (A) 50 and (B) 25 microns. Asterisks () and hashes (#) indicate significance found between 1 and 0.1 nM sAPPα, respectively, relative to controls. Representative fluorescence images illustrate Arc protein expression (green) within primary (A1,2) and secondary (B1,2) dendrites in the presence of 1 nM sAPPα (A1,B1) or no drug (A2,B2). Significance was determined by Kruskal–Wallis One-Way ANOVA and Dunn’s multiple comparisons test. ∗/#p = ≤ 0.05 ∗∗/##p = ≤ 0.005, ∗∗∗/###p = 0.0005, ∗∗∗∗/####p = ≤ 0.0001. Scale bar = 50 μm.
FIGURE 6
FIGURE 6
Arc protein expression is prevented by inhibitors of transcription and translation. Representative images showing Arc protein levels in (A) sAPPα (1 nM, 2 h, n = 157) and (B) no drug control (n = 115 cells) conditions. sAPPα-mediated Arc increase is inhibited with co-application of (C) Actinomycin-D (n = 104) or (D) Anisomycin (n = 30) in the (E) somata and (F) dendrites. Significance was calculated using a Kruskal–Wallis one-way ANOVA with Dunn’s multiple comparisons test. ∗∗∗∗/####p ≤ 0.0001. Representative images show neurons (magenta), Arc protein (green), nuclei (DAPI; blue) (scale bar = 50 μm) and magnified somatic (inset, bottom right) and dendritic (100 μm; lower panels; scale bar = 10 μm).
FIGURE 7
FIGURE 7
Arc protein expression in response to sAPPα is affected by kinase inhibitors. Representative images showing (A) sAPPα (1 nM, 2 h, n = 125) promotes an increase in the expression of Arc protein in cultured neurons relative to (B) no drug controls (n = 134). Cells were simultaneously treated with (C) KN62 (n = 51), (D) PD98059 (n = 51), and (E) KT5823 (n = 42), (F) H-89 dihydrochloride (n = 40), (G) Chelerythrine chloride (n = 30), or (H) Rapamycin (n = 40) and Arc levels in the (I) somata and (J) dendrites was measured. Data are expressed as mean ± SEM from ≥3 experiments. Significance was calculated using a Kruskal–Wallis one-way ANOVA with Dunn’s multiple comparisons test. Hashes (#) indicate significance between control and sAPPα-treated; asterisks () indicate significance between sAPPα- and inhibitor-treated; ####p ≤ 0.0001, p = 0.0428, ∗∗∗p = 0.0001, ∗∗∗∗p ≤ 0.0001. Representative images show neurons (magenta), Arc protein (green), DAPI (blue) (scale bar = 50 m), and magnified somatic (inset, bottom right) and dendritic (100 μm; lower panels; scale bar = 10 μm) compartments.
FIGURE 8
FIGURE 8
Arc protein expression is dependent on NMDA and α7nAch receptors. Representative images showing (A) sAPPα (1 nM, 2 h, n = 80) promotes and increase in the expression of Arc protein in cultured hippocampal neurons relative to (B) no drug controls (n = 80). Co-incubation of sAPPα with (C) ANA-12 (n = 40), (D) CPG55845 (n = 40), and (E) MCPG (n = 40) had no effect on sAPPα-induced Arc expression. Co-incubation with (F) APV (n = 40), or (G) αBGT (n = 30) significantly reduced Arc protein expression, while co-incubation with both (H) APV and αBGT (n = 30) fully eliminated this effect in the (I) dendrites. Outliers were removed from each experiment prior to amalgamation using Grubb’s tests, and normality was detected by D’Agostino and Pearson omnibus normality tests. Data are expressed as mean ± SEM from ≥3 experiments. Significance was calculated using a Kruskal–Wallis one-way ANOVA with Dunn’s multiple comparisons test. Hashes (#) indicate significance between control and sAPPα-treated; asterisks () indicate significance between sAPPα- and antagonist-treated; ####p ≤ 0.0001, p = 0.0163, ∗∗∗∗p ≤ 0.0001. Representative images show neurons (magenta), Arc protein (green), DAPI (blue) (scale bar = 50 μm), and magnified somatic (inset, bottom right) and dendritic (100 μm; lower panels; scale bar = 10 μm) compartments.
FIGURE 9
FIGURE 9
sAPPα increases in CREB phosphorylation and Arc protein in acute hippocampal slices. (A) A representative transverse section of an acute hippocampal slice, with a subregion of area CA1, used for quantitative analysis, outlined by a white dotted box (neurons: MAP2/magenta; nuclei: DAPI/blue; imaged at 4x magnification; scale bar = (500 μm). Relative to (B) no drug controls, (C) incubation of slices with sAPPα (1 nM, 15 min, n = 2 rats, 4 slices) increased pCREBser133 (green; imaged at 20x magnification; scale bar = 100 μm) in the PCL of CA1. Relative to (D) no drug controls, (E) incubation of slices with sAPPα (1 nM, 2 h, n = 3 rats, 4 slices) significantly increased Arc protein expression (green; imaged at 4x magnification) in area CA1. Co-incubation of sAPPα with (F) APV and αBGT (n = 3 rats, 4 slices) attenuated this effect. Normality was detected by Shapiro–Wilk normality tests. Data are expressed as mean ± SEM. Significance of pCREB (G) and (H) Arc protein expression was calculated using a students t-test, and one-way ANOVA with Šidák’s multiple comparisons test, respectively. Hashes (#) indicate significance between control and sAPPα-treated; asterisks () indicate significance between sAPPα- and antagonist-treated; #p ≤ 0.05, p = 0.04. CA1, cornu ammonis 1; PCL, pyramidal cell layer.

Similar articles

Cited by

References

    1. Ang A. L., Taguchi T., Francis S., Folsch H., Murrells L. J., Pypaert M., et al. (2004). Recycling endosomes can serve as intermediates during transport from the Golgi to the plasma membrane of MDCK cells. J. Cell Biol. 167 531–543. 10.1083/jcb.200408165 - DOI - PMC - PubMed
    1. Aramakis V. B., Metherate R. (1998). Nicotine selectively enhances NMDA receptor-mediated synaptic transmission during postnatal development in sensory neocortex. J. Neurosci. 18 8485–8495. 10.1523/JNEUROSCI.18-20-08485.1998 - DOI - PMC - PubMed
    1. Ashley J., Cordy B., Lucia D., Fradkin L. G., Budnik V., Thomson T. (2018). Retrovirus-like gag protein Arc1 binds RNA and traffics across synaptic boutons. Cell 172 262–274.e11. 10.1016/j.cell.2017.12.022 - DOI - PMC - PubMed
    1. Atkins C. M., Nozaki N., Shigeri Y., Soderling T. R. (2004). Cytoplasmic polyadenylation element binding protein-dependent protein synthesis is regulated by calcium/calmodulin-dependent protein kinase II. J. Neurosci. 24 5193–5201. 10.1523/jneurosci.0854-04.2004 - DOI - PMC - PubMed
    1. Bagni C., Mannucci L., Dotti C. G., Amaldi F. (2000). Chemical stimulation of synaptosomes modulates alpha -Ca2+/calmodulin-dependent protein kinase II mRNA association to polysomes. J. Neurosci. 20:Rc76. - PMC - PubMed