

Consonant and Vowel Confusions in Well-Performing Children and Adolescents With Cochlear Implants, Measured by a Nonsense Syllable Repetition Test
- PMID: 31474900
- PMCID: PMC6702790
- DOI: 10.3389/fpsyg.2019.01813
Consonant and Vowel Confusions in Well-Performing Children and Adolescents With Cochlear Implants, Measured by a Nonsense Syllable Repetition Test
Abstract
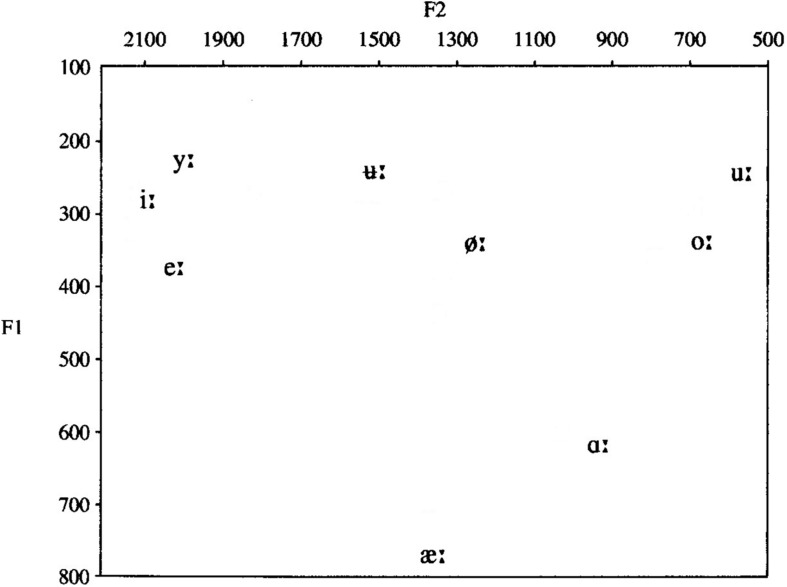
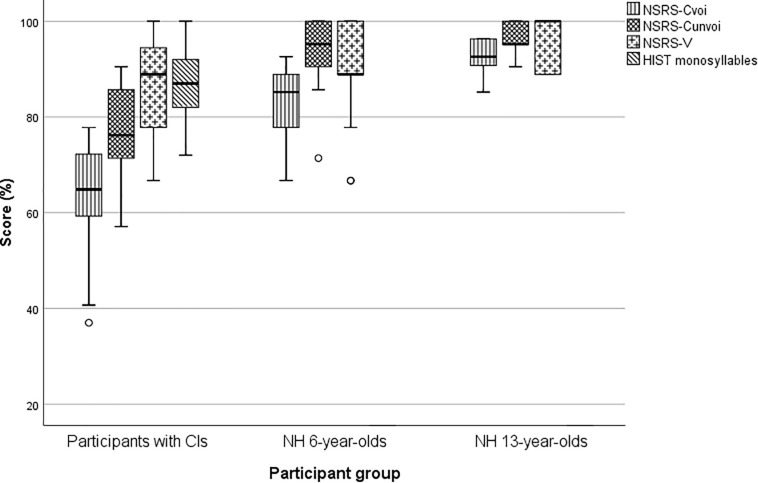
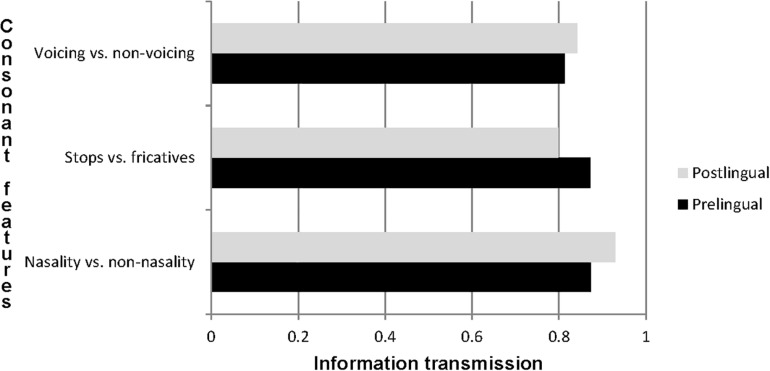
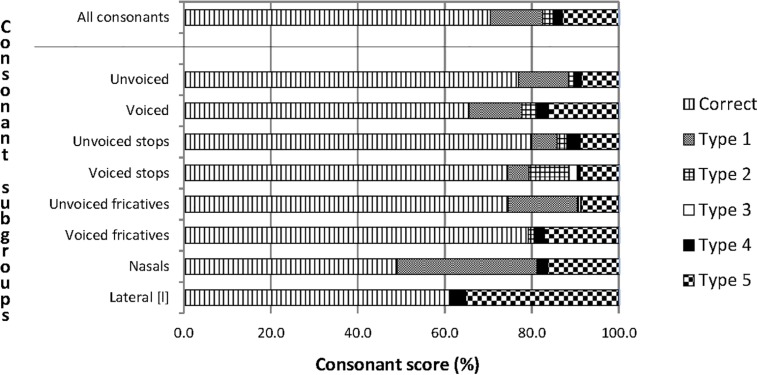
Although the majority of early implanted, profoundly deaf children with cochlear implants (CIs), will develop correct pronunciation if they receive adequate oral language stimulation, many of them have difficulties with perceiving minute details of speech. The main aim of this study is to measure the confusion of consonants and vowels in well-performing children and adolescents with CIs. The study also aims to investigate how age at onset of severe to profound deafness influences perception. The participants are 36 children and adolescents with CIs (18 girls), with a mean (SD) age of 11.6 (3.0) years (range: 5.9-16.0 years). Twenty-nine of them are prelingually deaf and seven are postlingually deaf. Two reference groups of normal-hearing (NH) 6- and 13-year-olds are included. Consonant and vowel perception is measured by repetition of 16 bisyllabic vowel-consonant-vowel nonsense words and nine monosyllabic consonant-vowel-consonant nonsense words in an open-set design. For the participants with CIs, consonants were mostly confused with consonants with the same voicing and manner, and the mean (SD) voiced consonant repetition score, 63.9 (10.6)%, was considerably lower than the mean (SD) unvoiced consonant score, 76.9 (9.3)%. There was a devoicing bias for the stops; unvoiced stops were confused with other unvoiced stops and not with voiced stops, and voiced stops were confused with both unvoiced stops and other voiced stops. The mean (SD) vowel repetition score was 85.2 (10.6)% and there was a bias in the confusions of [i:] and [y:]; [y:] was perceived as [i:] twice as often as [y:] was repeated correctly. Subgroup analyses showed no statistically significant differences between the consonant scores for pre- and postlingually deaf participants. For the NH participants, the consonant repetition scores were substantially higher and the difference between voiced and unvoiced consonant repetition scores considerably lower than for the participants with CIs. The participants with CIs obtained scores close to ceiling on vowels and real-word monosyllables, but their perception was substantially lower for voiced consonants. This may partly be related to limitations in the CI technology for the transmission of low-frequency sounds, such as insertion depth of the electrode and ability to convey temporal information.
Keywords: cochlear implants; consonants; hearing; speech perception; speech sound confusions; vowels.
Figures
Similar articles
-
Consonant and vowel confusions in well-performing adult cochlear implant users, measured with a nonsense syllable repetition test.Int J Audiol. 2024 Apr;63(4):260-268. doi: 10.1080/14992027.2023.2177893. Epub 2023 Feb 28. Int J Audiol. 2024. PMID: 36853200
-
Consonant and Vowel Identification in Cochlear Implant Users Measured by Nonsense Words: A Systematic Review and Meta-Analysis.J Speech Lang Hear Res. 2018 Apr 17;61(4):1023-1050. doi: 10.1044/2018_JSLHR-H-16-0463. J Speech Lang Hear Res. 2018. PMID: 29623340
-
Effects of vowel context on the recognition of initial and medial consonants by cochlear implant users.Ear Hear. 2006 Dec;27(6):658-77. doi: 10.1097/01.aud.0000240543.31567.54. Ear Hear. 2006. PMID: 17086077
-
Intelligibility of Word-Initial Obstruent Consonants in Mandarin-Speaking Prelingually Deafened Children With Cochlear Implants.J Speech Lang Hear Res. 2023 Jun 20;66(6):2155-2176. doi: 10.1044/2023_JSLHR-22-00268. Epub 2023 May 19. J Speech Lang Hear Res. 2023. PMID: 37208163
-
Auditory Perception and Production of Speech Feature Contrasts by Pediatric Implant Users.Ear Hear. 2015 Nov-Dec;36(6):653-63. doi: 10.1097/AUD.0000000000000181. Ear Hear. 2015. PMID: 26035142
Cited by
-
Visualization of Speech Perception Analysis via Phoneme Alignment: A Pilot Study.Front Neurol. 2022 Jan 11;12:724800. doi: 10.3389/fneur.2021.724800. eCollection 2021. Front Neurol. 2022. PMID: 35087462 Free PMC article.
-
Evaluation of Verbal Working Memory and Phonemic Analysis Skills in Adolescents with Cochlear Implant.Int Arch Otorhinolaryngol. 2023 Oct 23;27(4):e662-e666. doi: 10.1055/s-0043-1761172. eCollection 2023 Oct. Int Arch Otorhinolaryngol. 2023. PMID: 37876696 Free PMC article.
-
Listening Effort Is Not the Same as Speech Intelligibility Score.Trends Hear. 2021 Jan-Dec;25:23312165211027688. doi: 10.1177/23312165211027688. Trends Hear. 2021. PMID: 34261392 Free PMC article.
-
Effortful Listening Despite Correct Responses: The Cost of Mental Repair in Sentence Recognition by Listeners With Cochlear Implants.J Speech Lang Hear Res. 2022 Oct 17;65(10):3966-3980. doi: 10.1044/2022_JSLHR-21-00631. Epub 2022 Sep 15. J Speech Lang Hear Res. 2022. PMID: 36112516 Free PMC article.
References
-
- Boersma P., Weenink D. (2018). Praat: Doing phonetics by computer [Computer program]. Version 6.0.37. Available at: http://www.praat.org (accessed March 14, 2018).
LinkOut - more resources
Full Text Sources