. 2019 Aug 14:10:1874.
doi: 10.3389/fpsyg.2019.01874. eCollection 2019.

Search Strategies in the Perceptual-Motor Workspace and the Acquisition of Coordination, Control, and Skill

Affiliations

Search Strategies in the Perceptual-Motor Workspace and the Acquisition of Coordination, Control, and Skill

Matheus M Pacheco et al. Front Psychol. .

Abstract

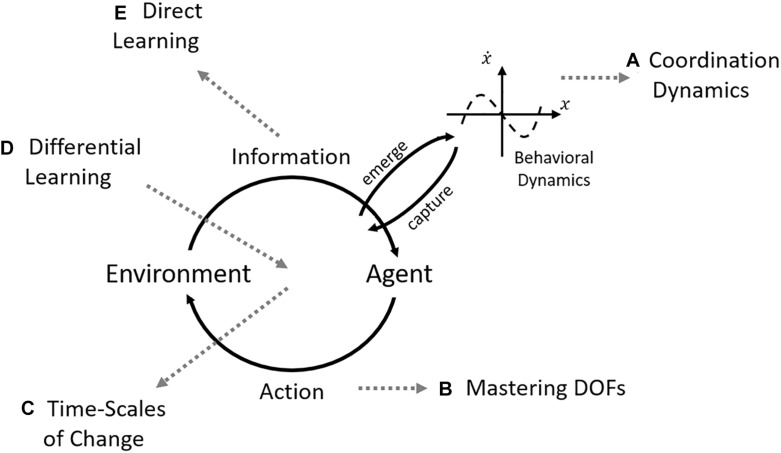
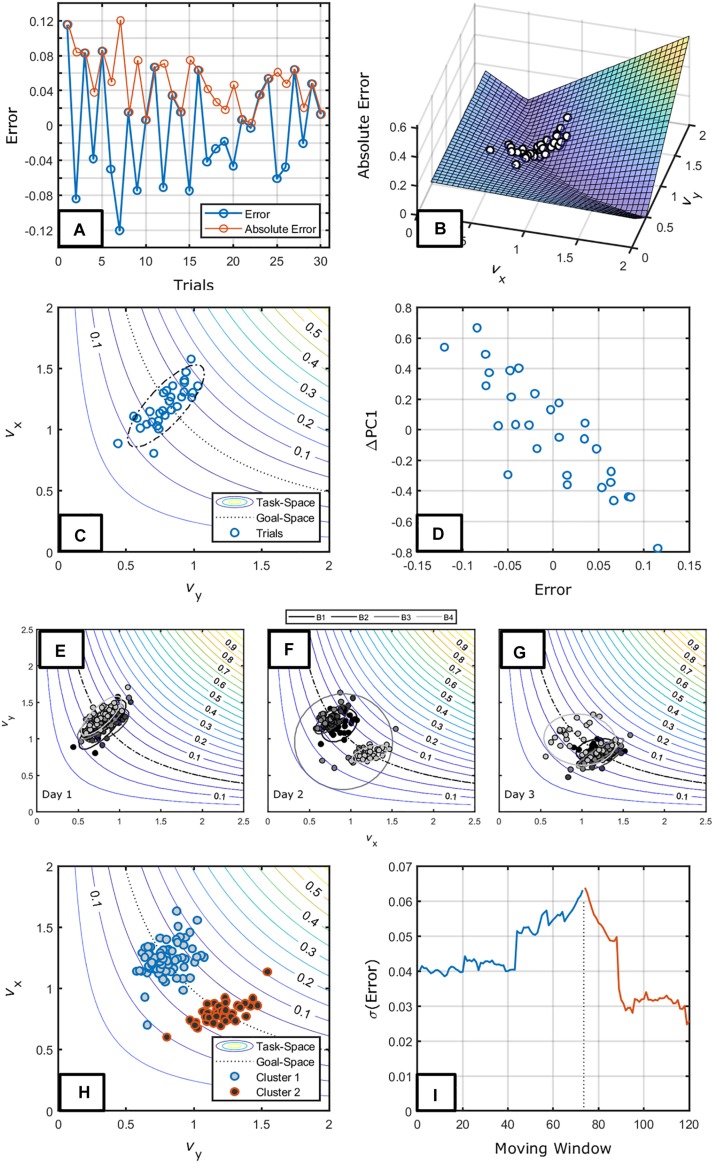
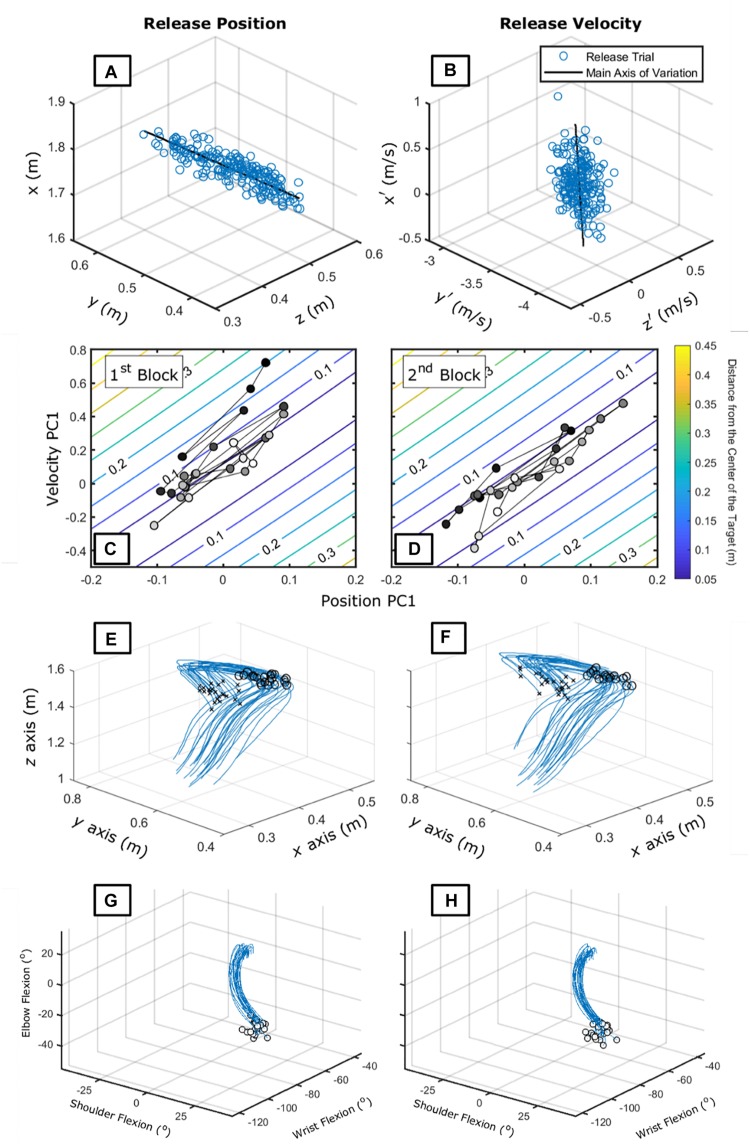
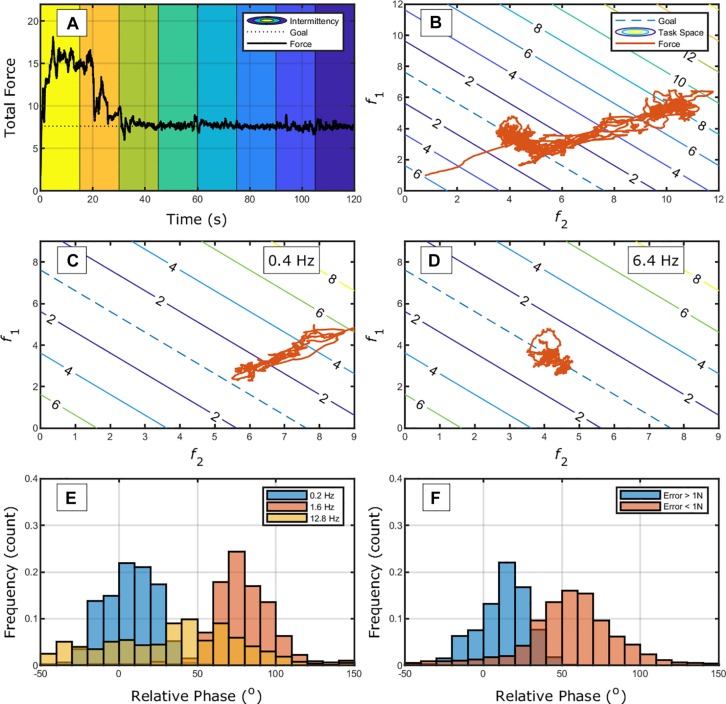
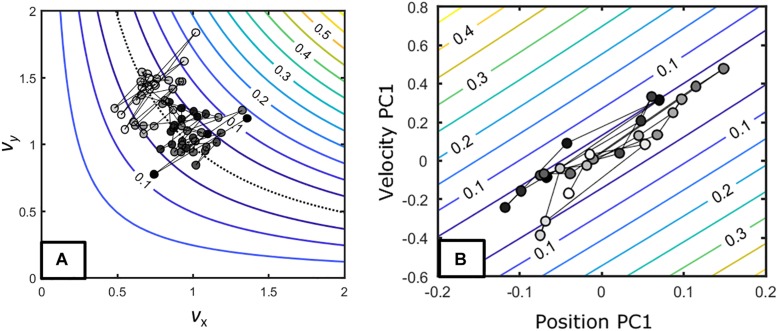
In this paper we re-visit and elaborate-on the theoretical framework of learning as searching within the perceptual-motor workspace for a solution to the task. The central focus is the nature of search strategies to locate and create stable equilibrium regions in the perceptual-motor workspace and how these strategies relate to the emergent movement forms in the acquisition of coordination, control, and skill. In the ecological theory of perception and action, the enhanced stability of performance occurs through the attunement of the perceptual systems to the task dynamics together with modifications of action as task and intrinsic dynamics cooperate and/or compete. Thus, through practice in this search process, individuals adapt to the pick-up of task relevant perceptual variables and change their movement form according to the stability of the performed action and its outcome in relation to the task demands. Contemporary experimental findings have revealed features of the search process given the interaction of individual intrinsic dynamics in the context of task requirements and principles that drive the change - e.g., exploitation of more tolerant task-space solutions and emergence of compensatory mechanisms. Finally, we outline how the search strategy framework relates to traditional learning-related phenomena: including the dynamical pathways of learning, learning curves, factors of learning, individuality, motor development, and sport and rehabilitation interventions.

Keywords: coordinative structures; dynamical systems; ecological psychology; exploration; individual-differences; intrinsic dynamics; motor learning.


Figures

FIGURE 1
FIGURE 1
Focused efforts under DST on skill acquisition over the years. The central scheme is composed of the interaction between agent and environment through perception and action that is captured and gives rise to the coordination dynamics (adapted from Warren, 2006). The gray dashed arrows point to the different “themes” that emerged in investigating each aspect of the central scheme. (A) Coordination dynamics focused on the change of the intrinsic dynamics in practice (e.g., Zanone and Kelso, 1994; Kostrubiec et al., 2012); (B) there was a round of testing the freezing/freeing degrees of freedom (DOFs) hypothesis of Bernstein (1967) (e.g., Vereijken et al., 1992; Mitra et al., 1998; Newell and Vaillancourt, 2001); (C) formal analyses on the performance curves observed in motor learning (Newell et al., 2001, 2009); (D) the differential learning approach focused on concepts of random variability, stochastic resonance, and others to provide an intervention paradigm (Schöllhorn et al., 2009); and (E) the direct learning theory (Jacobs and Michaels, 2007) developed direct hypothesis on how perceptual learning would occur. Note that although all these approaches emerged from DST, they need to be integrated into a single framework (e.g., how does mastering the DOFs interact with performance curves studied in the time-scales of change?).
FIGURE 2
FIGURE 2
Exemplary intrinsic tendencies. Panel (A) shows the Haken et al. (1985) potential function that describes the tendencies observed for a majority of individuals in performing oscillatory motion of two limbs. As observed in (A), the stable patterns that individuals can perform are the 0° (in-phase) or 180° (anti-phase). Panel (B) shows the distribution of covariation between two joints in the Krinskii and Shik (1964) paradigm utilized by Newell et al. (1991). There is a tendency to move in certain ways rather than using the whole possible space which is indicative of attractors within the space. This type of plot allows identification of tendencies in action when formal characterizations were not made but relevant variables are identified. Panel (C) is a schematic of different tendencies of action in terms of throwing patterns demonstrated in Pacheco and Newell (2018a). This description is qualitative given the difficulty to find relevant variables that characterize the different movement patterns (see Roberton and Halverson, 1984).
FIGURE 3
FIGURE 3
Graphical representation of a hypothetical perceptual-motor workspace. The potential function determines the stable states (valleys). The figure presents changes in the control parameter of the perceptual space (A,C,E,G) which results in changes in information attending from p1 to p2. The change in informational variable being attended alters the dynamics in the motor space (B,D,F,H) changing the stability of the action a1 and inducing changes to action a2. The perceptual space was characterized using Tuller et al. (1994) Eq. (1) V(x) = −kx−1/2x2−1/4x4 and the motor space was characterized using the Haken et al. (1985) Eq. (2) V(ϕ) = −acos⁡(ϕ)−bcos⁡(2ϕ). Both equations were coupled through variable x from Eq. (1), this alters Eq. (2) to V(ϕ) = −xcos⁡(ϕ)−(1 + x)cos⁡(2ϕ).
FIGURE 4
FIGURE 4
Schematic of task-spaces. Panels (A,B) show the outcome/performance and elemental variables (vx and vy)/performance relations for the virtual throwing task where initial position is constant, and the target is located at 0.2 m from the initial position. vx and vy represent the component of the release velocity vector considering the x- and y-axes. Panels (C,D) show the outcome/performance and elemental variables (f1 and f2)/performance for the bimanual isometric force task when the total force target is 5 N. f1 and f2 represent the forces exerted by the index finger of each hand. Panels (E,F) show the outcome/performance and elemental variables (θ and v)/performance relations for the virtual throwing task where initial position is constant, and the target is located at 0.2 m from the initial position considering different coordinates. θ and v represent the release angle and speed. For the equations defining each task-space, see the text.
FIGURE 5
FIGURE 5
(A) The performance score of an exemplary participant in Pacheco and Newell (2015). The red line and circles represent the absolute error while the blue line and circles represent the errors. (B) The task-space plotting the same trials. (C) A contour plot showing the same trials and an ellipsoid highlighting the tendency to vary along a single dimension in the plane. (D) The relation between change along the main axis of variation of data and error. The data seem to indicate a proportional relation between change and error. Panels (E–G) show the long-term changes in distribution of the data in the task-space over blocks of 30 trials for days 1 (E), 2 (F), and 3 (G). Panel (H) shows the identified two clusters of release velocities in the task-space for day 2. Panel (I) shows the moving window of standard deviation in performance before and after the change from cluster 1 to cluster 2. This shows the increased variation that might have induced changes in coordination pattern employed during the task.
FIGURE 6
FIGURE 6
Panels (A,B) show the release parameters [position – (A) and velocity – (B)] of 210 trials of an exemplary participant in his 5th day of practice from Pacheco and Newell (2018c). The black line shows the main axis of variation. Panels (C,D) show the task-space plotted in terms of the first principal component of both velocity and position data for the first (C) and second (D) block of 25 trials. Darker circles represent earlier trials while lighter circles represent later trials. Panels (E,F) show the hand trajectory data for the first (E) and second (F) block of 25 trials. The xs represent the beginning of the recording and the circles represent the release position. Panels (G,H) show the joint motion relation between shoulder, elbow, and wrist for the first (E) and second (G) block of 25 trials. The circles represent the release position. For shoulder, 0 degrees mean the neutral position; for elbow, 180 degrees mean full extension; for wrist, 0 degrees mean neutral position.
FIGURE 7
FIGURE 7
(A) Exemplary trial (first 120 s) of an individual performing the bimanual isometric force task with changing frequency of information (from left to right: 0.2, 0.4, 0.8, 1.6, 3.2, 6.4, 12.8, and 25.6 Hz, represented by different background colors) from Lafe et al. (2016). (B) The same trial now plotted in terms of the task-space. Panels (C,D) show the change in the elemental variables (f1 and f2) for different regimes of information intermittency; (C,D) for 0.8 and 1.6 Hz, respectively. Panels (E,F) show the relative-phase distributions for different information intermittency (E) and error magnitude in the task.
FIGURE 8
FIGURE 8
(A) Task-space and trials of an exemplary individual in Pacheco and Newell (2015). (B) Task-space and trials of an exemplary individual in Pacheco and Newell (2018c). These figures exemplify how the task constraints might influence how individuals achieve a UCM-like distribution (see the text).
FIGURE 9
FIGURE 9
Panels (A,C,E) show three task conditions from Pacheco and Newell (2018b). These differ in terms of the relation between error and distance to the target while the target distance itself was constant. Panels (B,D,F) show three exemplary data sets that cover the three types of relation between error and change: (B) discontinuous, (D) proportional, and (F) constant.

References

    1. Abbs J. H., Gracco V. L., Cole K. J. (1984). Control of multimovement coordination: sensorimotor mechanims in speech motor programming. J. Mot. Behav. 16 195–232. 10.1080/00222895.1984.10735318 - DOI - PubMed
    1. Abraham R. H., Shaw C. D. (1992). Dynamics: The Geometry of Behavior. Redwood, CA: Addison-Wesley.
    1. Adams J. A. (1971). A closed-loop theory of motor learning. J. Mot. Behav. 3 111–150. 10.1080/00222895.1971.10734898 - DOI - PubMed
    1. Adams J. A. (1987). Historical review and appraisal of research on the learning, retention, and transfer of human motor skills. Psychol. Bull. 101 41–74. 10.1037/0033-2909.101.1.41 - DOI
    1. Al-Abood S. A., Davids K., Bennett S. J. (2001). Specificity of task constraints and effects of visual demonstration and verbal instructions in directing learners’ search during skil acquisition. J. Mot. Behav. 33 295–305. 10.1080/00222890109601915 - DOI - PubMed

LinkOut - more resources