

TAC3 Gene Products Regulate Brain and Digestive System Gene Expression in the Spotted Sea Bass (Lateolabrax maculatus)
- PMID: 31474940
- PMCID: PMC6702303
- DOI: 10.3389/fendo.2019.00556
TAC3 Gene Products Regulate Brain and Digestive System Gene Expression in the Spotted Sea Bass (Lateolabrax maculatus)
Abstract
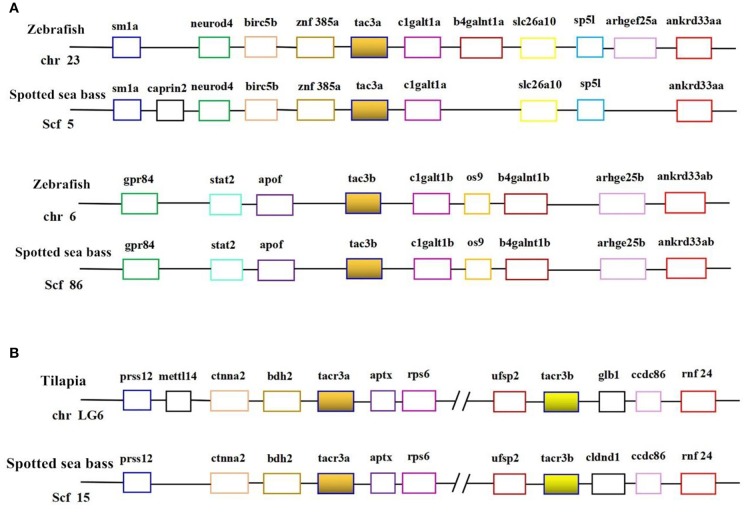
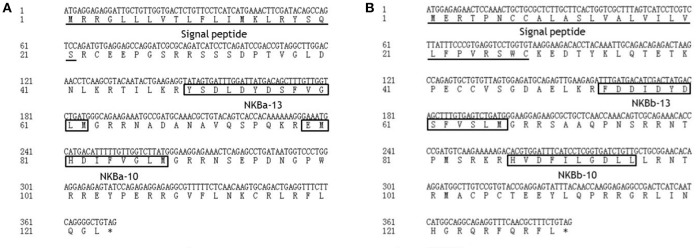
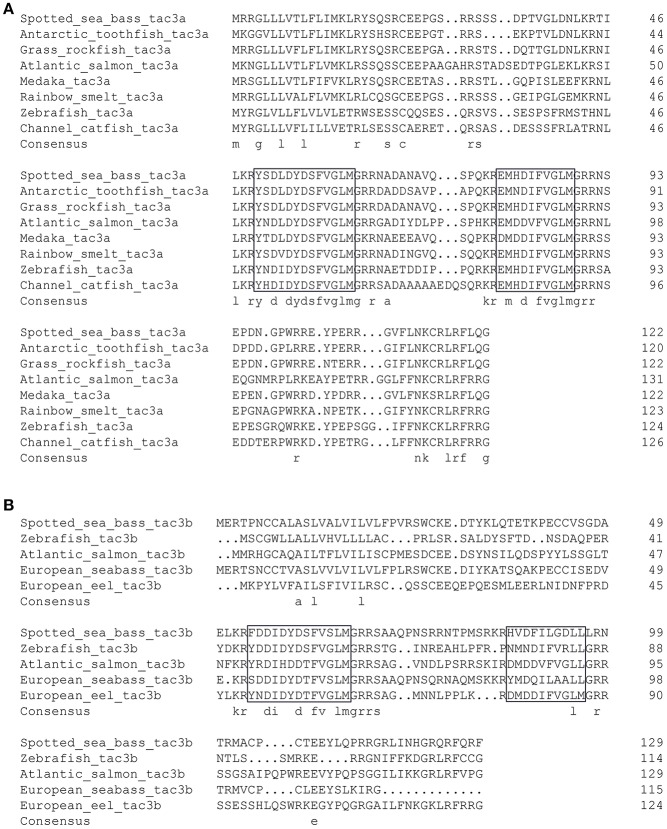
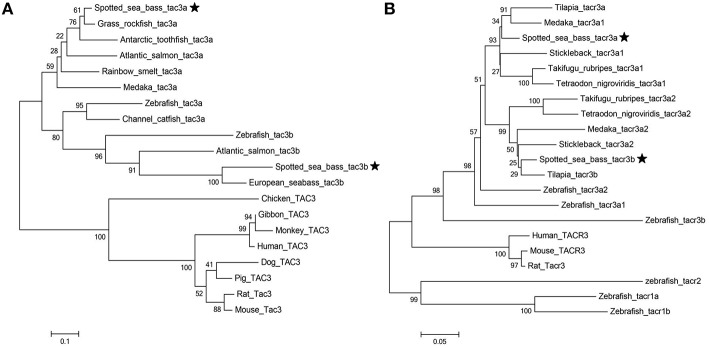
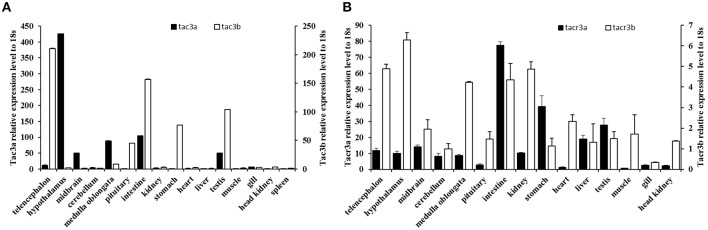
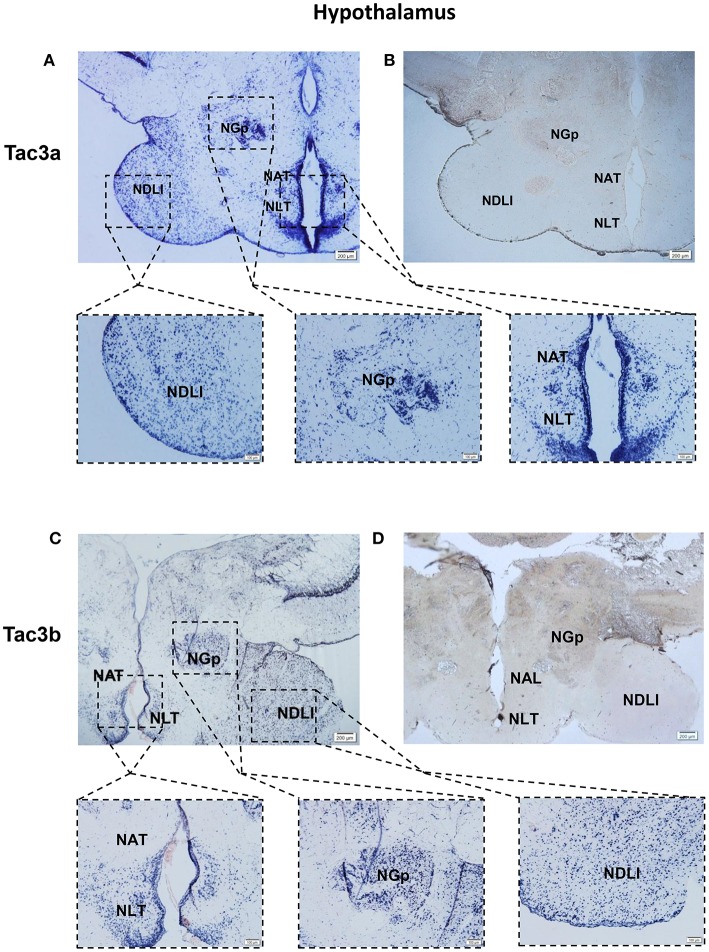
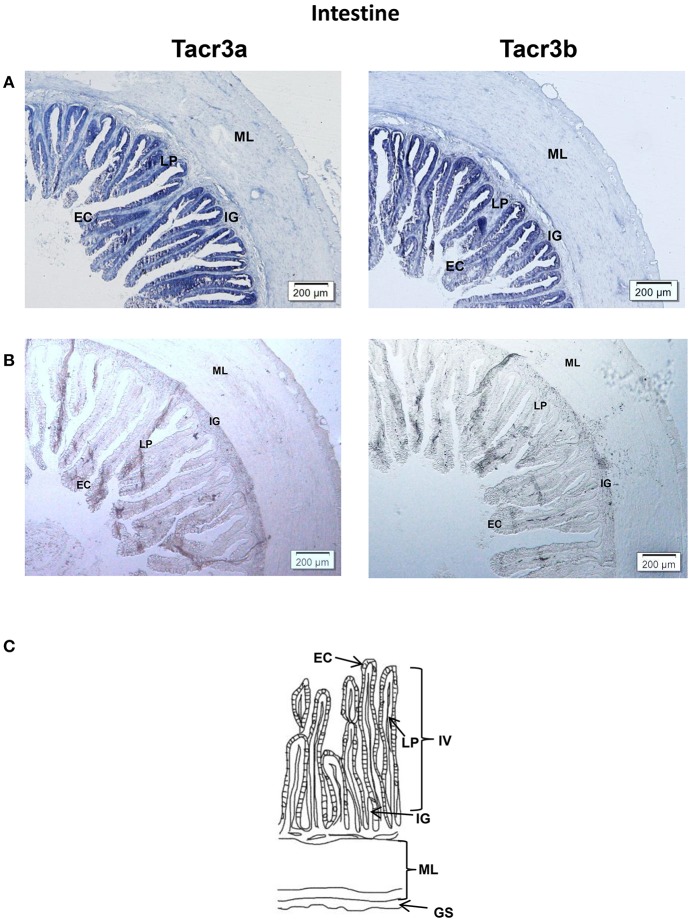
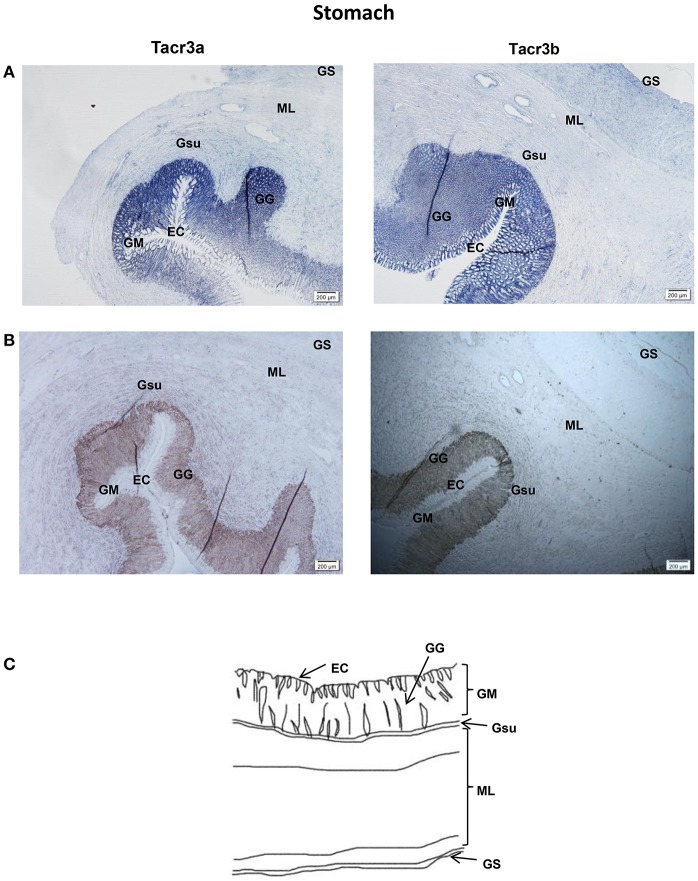
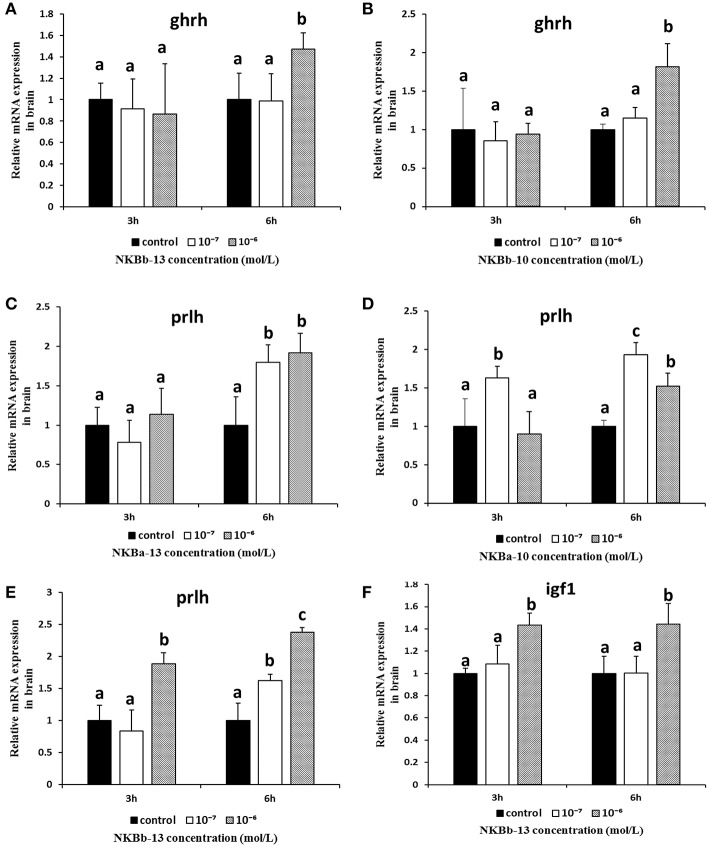
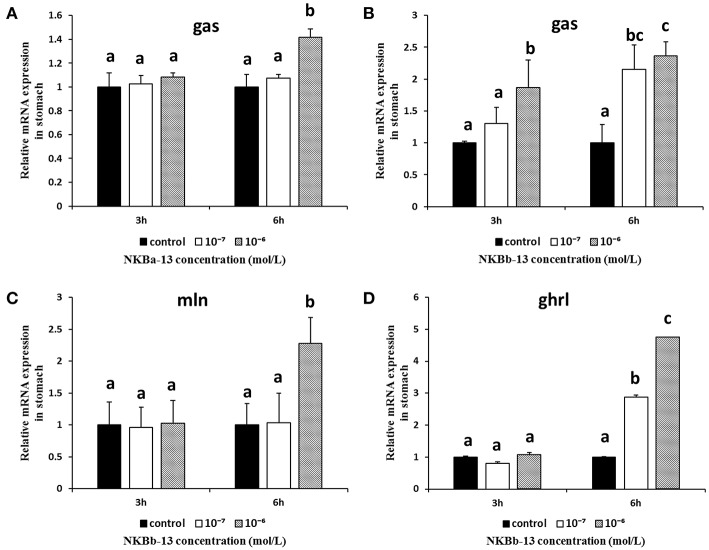
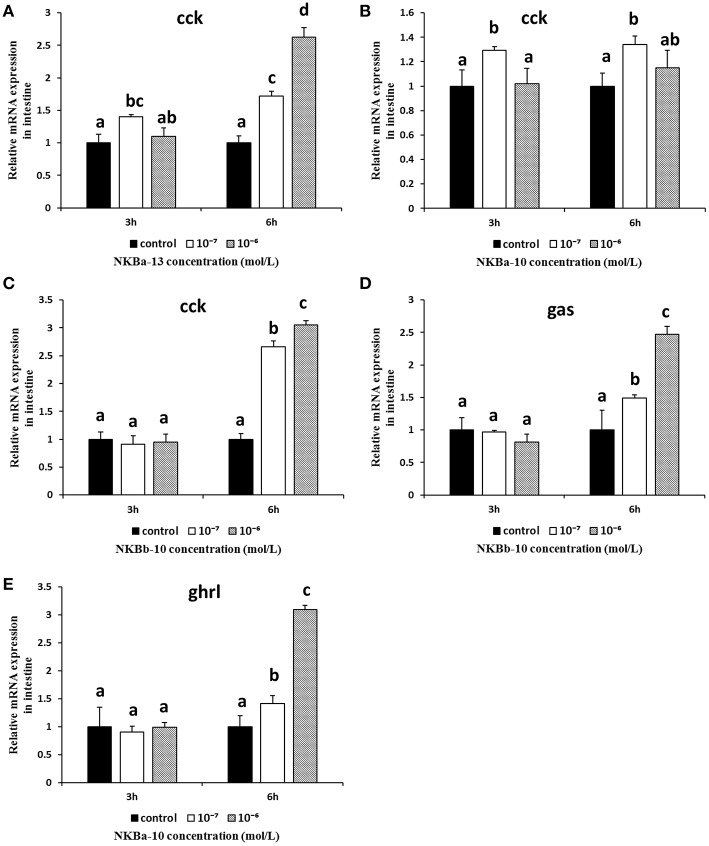
Neurokinin B (NKB) is a member of the tachykinin (tac) family that plays important roles in mammalian growth by modulating prolactin (PRL) synthesis and secretion and causing contraction of the stomach and intestine. However, its potential role in regulating growth of teleosts is less clear. We aimed to explore the role that NKB plays in regulating fish growth using the spotted sea bass (Lateolabrax maculatus) as a model. In the present study, two tac3 and two tacr3 genes were identified in the spotted sea bass. Sequence analysis showed that two tac3 transcripts, tac3a and tac3b, encode four NKBs: NKBa-13, NKBa-10, NKBb-13, and NKBb-10. Expression analysis in different tissues showed that both genes are highly expressed in the brain, stomach and intestine of the spotted sea bass. In situ hybridization indicated that the tac3a and tac3b mRNAs are both localized in several brain regions, such as the telencephalon and hypothalamus, and that tacr3a and tacr3b are localized in the intestinal villus and gastric gland. To investigate the potential role of NKBs in regulating growth, in vitro experiments were performed to detect the effect of NKBs on growth-related gene expression in the brain and brain-gut peptide (BGP)-related genes in the stomach and intestine. NKBb-13 was the most critical ligand in regulating the expression of growth-related genes in the brain and brain-gut peptide (BGP)-related genes in the stomach. The expression of cholecystokinin (cck) was enhanced by NKBa-13, NKBa-10, and NKBb-10 but not NKBb-13 in the intestine. In general, our results showed that NKBs participate in regulating the growth of spotted sea bass.
Keywords: TAC3/TACR3 system; growth; in situ hybridization; neurokinin B; spotted sea bass.
Figures


Similar articles
-
TAC3/TACR3 System Function in the Catadromous Migration Teleost, Anguilla japonica.Front Endocrinol (Lausanne). 2022 Jul 22;13:848808. doi: 10.3389/fendo.2022.848808. eCollection 2022. Front Endocrinol (Lausanne). 2022. PMID: 35937808 Free PMC article.
-
Goldfish neurokinin B: Cloning, tissue distribution, and potential role in regulating reproduction.Gen Comp Endocrinol. 2015 Sep 15;221:267-77. doi: 10.1016/j.ygcen.2014.10.017. Epub 2014 Nov 14. Gen Comp Endocrinol. 2015. PMID: 25448255
-
The evolution of tachykinin/tachykinin receptor (TAC/TACR) in vertebrates and molecular identification of the TAC3/TACR3 system in zebrafish (Danio rerio).Mol Cell Endocrinol. 2012 Sep 25;361(1-2):202-12. doi: 10.1016/j.mce.2012.04.007. Epub 2012 May 2. Mol Cell Endocrinol. 2012. PMID: 22580006
-
FOXO1A promotes neuropeptide FF transcription subsequently regulating the expression of feeding-related genes in spotted sea bass (Lateolabrax maculatus).Mol Cell Endocrinol. 2020 Nov 1;517:110871. doi: 10.1016/j.mce.2020.110871. Epub 2020 May 22. Mol Cell Endocrinol. 2020. PMID: 32450284 Review.
-
Neurokinin B and reproductive functions: "KNDy neuron" model in mammals and the emerging story in fish.Gen Comp Endocrinol. 2014 Nov 1;208:94-108. doi: 10.1016/j.ygcen.2014.08.009. Epub 2014 Aug 27. Gen Comp Endocrinol. 2014. PMID: 25172151 Review.
Cited by
-
The X-linked acrogigantism-associated gene gpr101 is a regulator of early embryonic development and growth in zebrafish.Mol Cell Endocrinol. 2021 Jan 15;520:111091. doi: 10.1016/j.mce.2020.111091. Epub 2020 Nov 26. Mol Cell Endocrinol. 2021. PMID: 33248229 Free PMC article.
-
Tachykinins, new players in the control of reproduction and food intake: A comparative review in mammals and teleosts.Front Endocrinol (Lausanne). 2022 Dec 16;13:1056939. doi: 10.3389/fendo.2022.1056939. eCollection 2022. Front Endocrinol (Lausanne). 2022. PMID: 36589829 Free PMC article. Review.
-
Tachykinins: Neuropeptides That Are Ancient, Diverse, Widespread and Functionally Pleiotropic.Front Neurosci. 2019 Nov 20;13:1262. doi: 10.3389/fnins.2019.01262. eCollection 2019. Front Neurosci. 2019. PMID: 31824255 Free PMC article. Review.
-
TAC3/TACR3 System Function in the Catadromous Migration Teleost, Anguilla japonica.Front Endocrinol (Lausanne). 2022 Jul 22;13:848808. doi: 10.3389/fendo.2022.848808. eCollection 2022. Front Endocrinol (Lausanne). 2022. PMID: 35937808 Free PMC article.
-
Arg-Vasotocin Directly Activates Isotocin Receptors and Induces COX2 Expression in Ovoviviparous Guppies.Front Endocrinol (Lausanne). 2021 Apr 23;12:617580. doi: 10.3389/fendo.2021.617580. eCollection 2021. Front Endocrinol (Lausanne). 2021. PMID: 33967951 Free PMC article.
References
LinkOut - more resources
Full Text Sources
Miscellaneous