

Different Gut Microbial Profiles in Sub-Saharan African and South Asian Women of Childbearing Age Are Primarily Associated With Dietary Intakes
- PMID: 31474951
- PMCID: PMC6702451
- DOI: 10.3389/fmicb.2019.01848
Different Gut Microbial Profiles in Sub-Saharan African and South Asian Women of Childbearing Age Are Primarily Associated With Dietary Intakes
Abstract
Background: To compare and characterize the gut microbiota in women of childbearing age from sub-Saharan Africa (the Democratic Republic of the Congo, DRC) and South Asia (India), in relation to dietary intakes.
Methods: Women of childbearing age were recruited from rural DRC and India as part of the Women First (WF) preconception maternal nutrition trial. Findings presented include fecal 16S rRNA gene-based profiling of women in the WF trial from samples obtained at the time of randomization, prior to initiation of nutrition intervention and to conception.
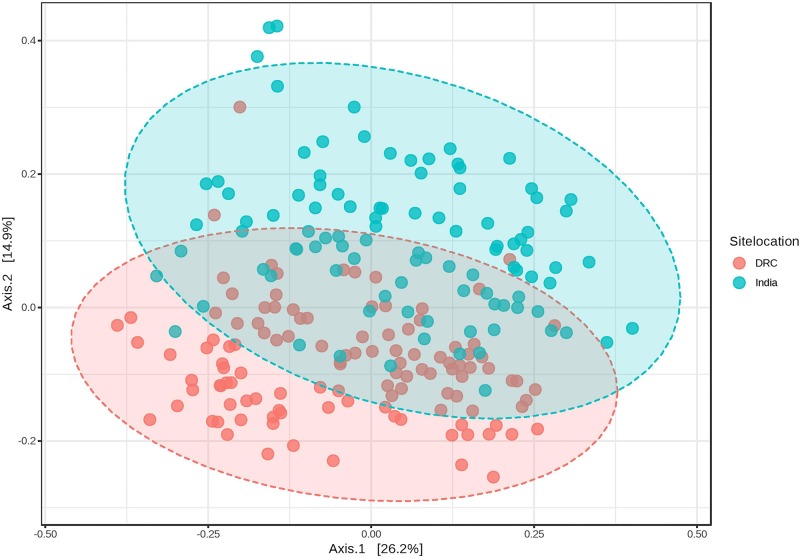
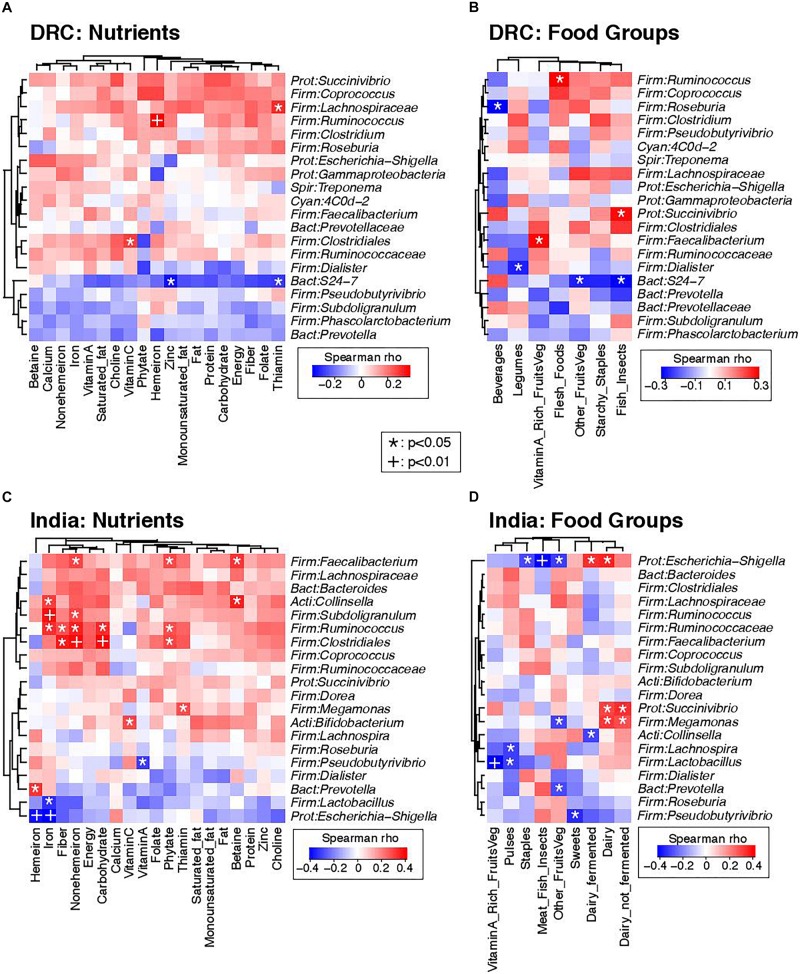
Results: Stool samples were collected from 217 women (DRC n = 117; India n = 100). Alpha diversity of the gut microbiota was higher in DRC than in India (Chao1: 91 ± 11 vs. 82 ± 12, P = 6.58E-07). The gut microbial community structure was not significantly affected by any demographical or environmental variables, such as maternal BMI, education, and water source. Prevotella, Succinivibrio, and Roseburia were at relatively high abundance without differences between sites. Bifidobacterium was higher in India (4.95 ± 1.0%) than DRC (0.3 ± 0.1%; P = 2.71E-27), as was Lactobacillus (DRC: 0.2 ± 0.0%; India: 1.2 ± 0.1%; P = 2.39E-13) and Faecalibacterium (DRC: 6.0 ± 1.7%; India: 8.4 ± 2.9%; P = 6.51E-7). Ruminococcus was higher in DRC (2.3 ± 0.7%) than in India (1.8 ± 0.4%; P = 3.24E-5) and was positively associated with consumption of flesh foods. Succinivibrio was positively associated with dairy intake in India and fish/insects in DRC. Faecalibacterium was positively associated with vitamin A-rich fruits and vegetables. Overall, these observations were consistent with India being primarily vegetarian with regular fermented dairy consumption and DRC regularly consuming animal-flesh foods.
Conclusion: Consumption of animal-flesh foods and fermented dairy foods were independently associated with the gut microbiota while demographic variables were not, suggesting that diet may have a stronger association with microbiota than demographic characteristics.
Keywords: Democratic Republic of the Congo; India; Women; diet; microbiota.
Figures


References
-
- De Filippo C., Cavalieri D., Di Paola M., Ramazzotti M., Poullet J. B., Massart S., et al. (2010). Impact of diet in shaping gut microbiota revealed by a comparative study in children from Europe and rural Africa. Proc. Natl. Acad. Sci. U.S.A. 107 14691–14696. 10.1073/pnas.1005963107 - DOI - PMC - PubMed
Grants and funding
LinkOut - more resources
Full Text Sources
Medical