. 2019 Aug 14:10:1909.
doi: 10.3389/fimmu.2019.01909. eCollection 2019.

Blimp-1 Contributes to the Development and Function of Regulatory B Cells

Affiliations

Blimp-1 Contributes to the Development and Function of Regulatory B Cells

Ying-Hsiu Wang et al. Front Immunol. .

Abstract

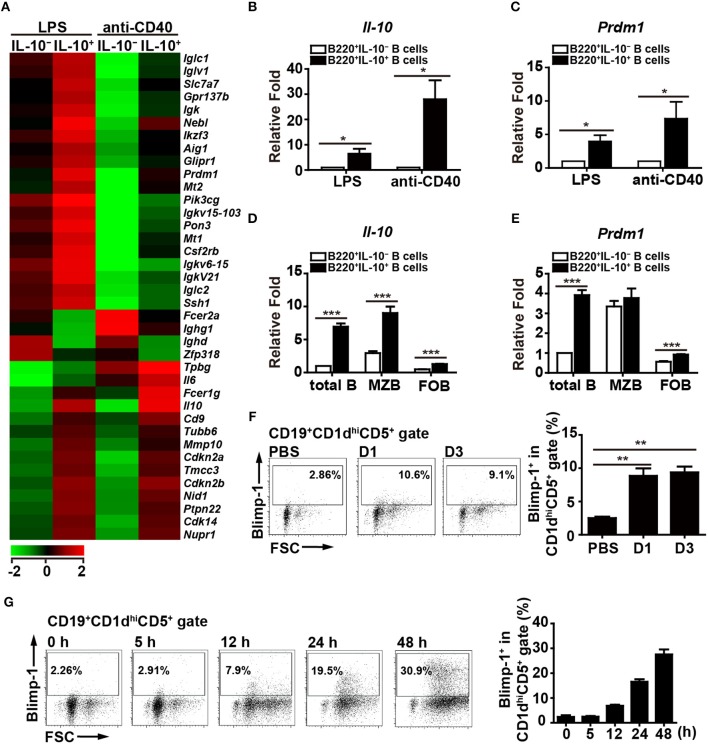
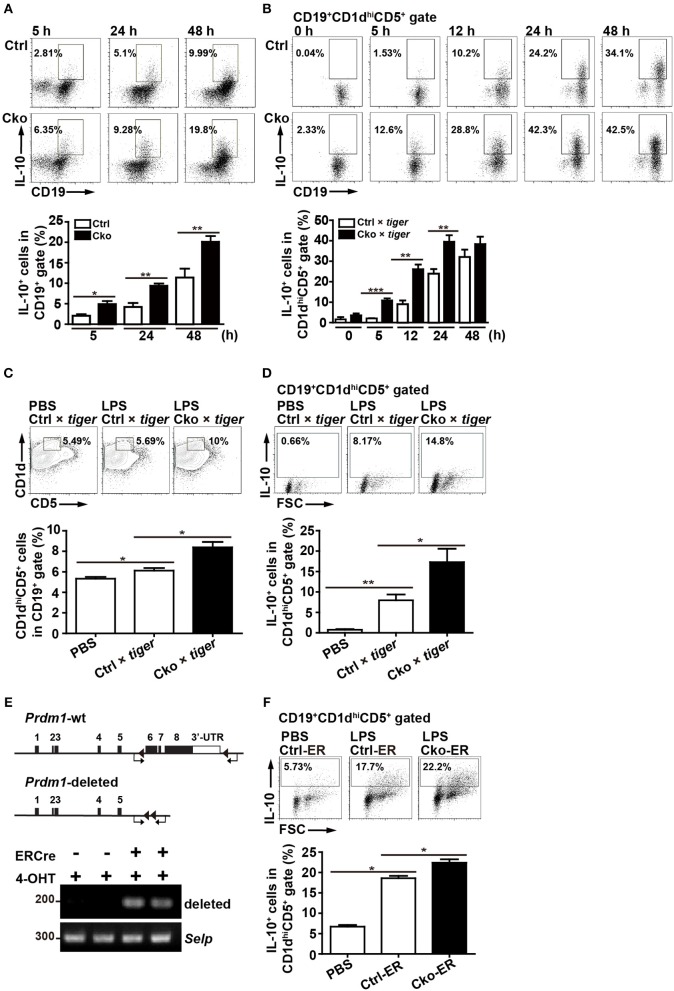
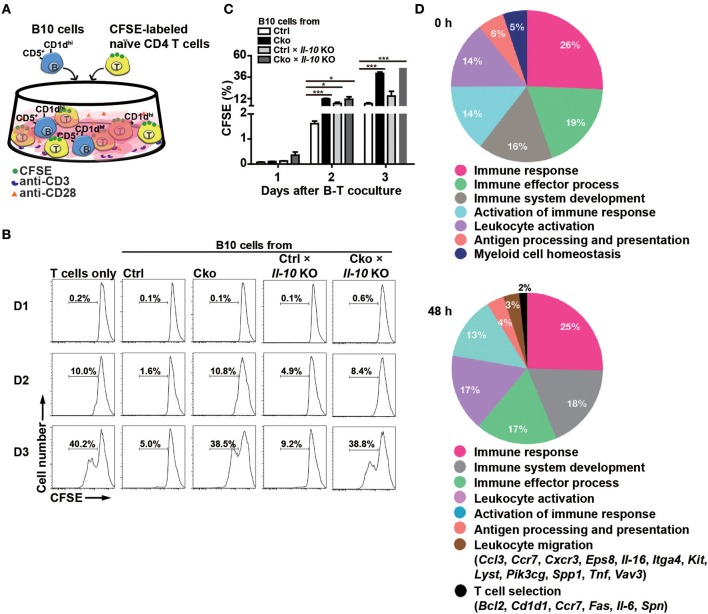
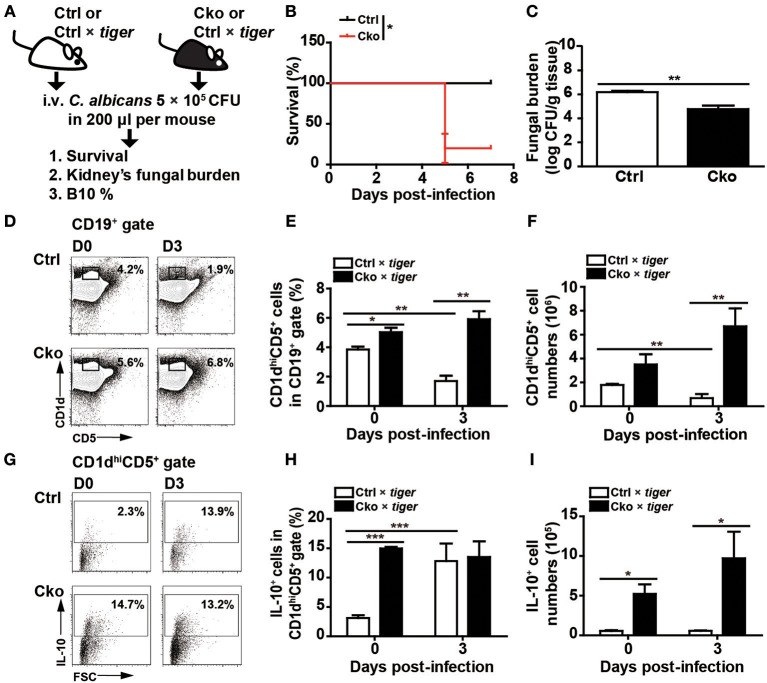
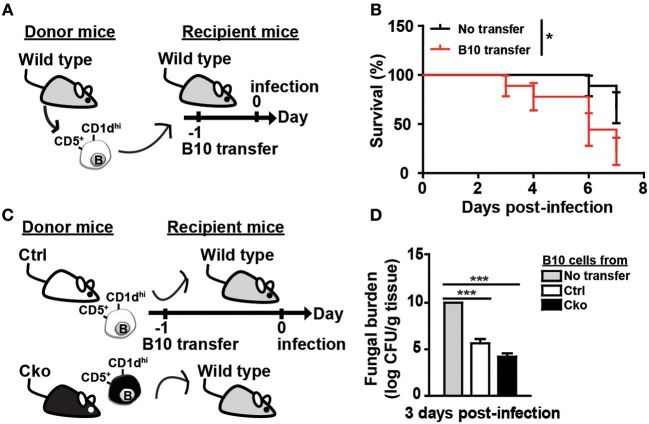
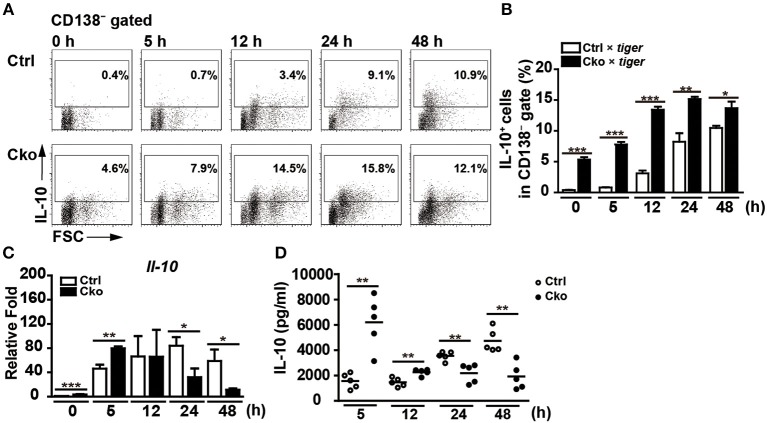
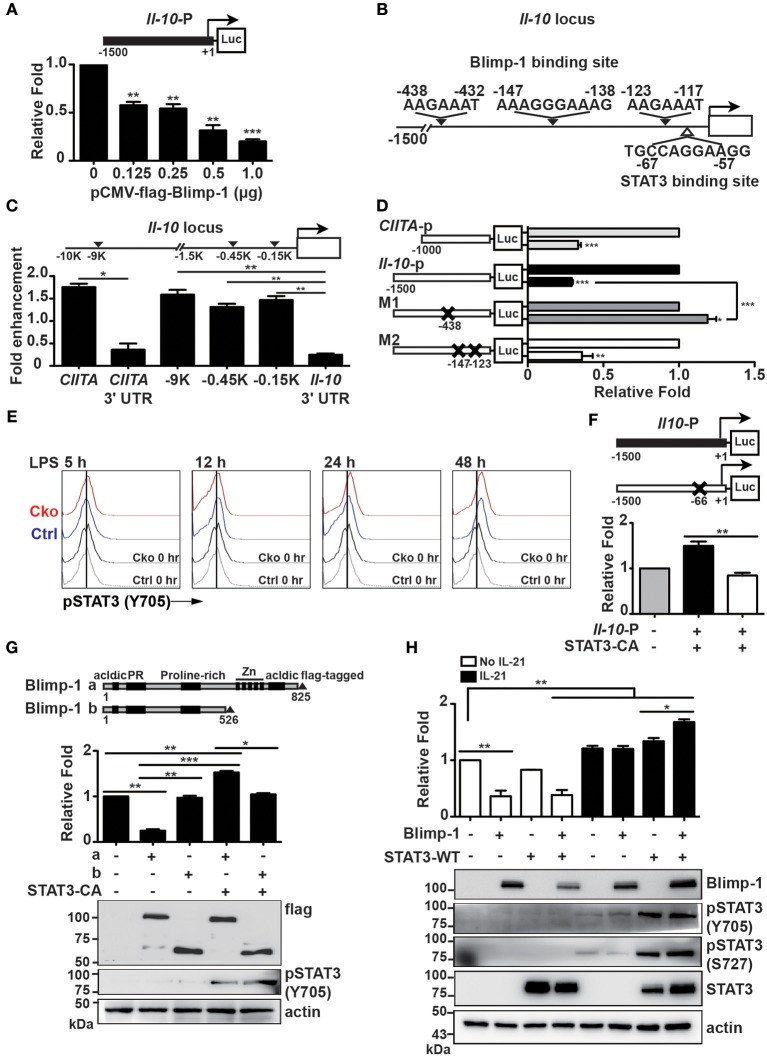
Regulatory B cells (Bregs) are a B cell subset that plays a suppressive role in immune responses. The CD19+CD1dhiCD5+ Bregs that can execute regulatory functions via secreting IL-10 are defined as B10 cells. Bregs suppress autoimmune and inflammatory diseases, whereas they exacerbate infectious diseases caused by bacteria, viruses, or parasites. Notably, the molecular mechanisms regulating the development and functions of Bregs are still largely unknown. Furthermore, the biological impact of Bregs in fungal infection has not yet been demonstrated. Here, we compared the gene expression profiles of IL-10-producing and -non-producing mouse splenic B cells stimulated with lipopolysaccharide (LPS) or anti-CD40 antibody. Blimp-1, a transcription factor known to be critical for plasma cell differentiation, was found to be enriched in the IL-10-producing B cells. The frequency of Blimp-1+ B10 cells was increased in LPS-treated mice and in isolated B10 cells that were stimulated with LPS. Surprisingly, B cell-specific Blimp-1 knockout (Cko) mice, generated by CD19 promoter driven Cre recombinase-dependent deletion of Prdm1 (gene encoding Blimp-1), showed higher frequencies of B10 cells both in the steady state and following injection with LPS, as compared with control littermates. However, B10 cells lacking Blimp-1 failed to efficiently suppress the proliferation of naïve CD4+ T cells primed with anti-CD3 and anti-CD28 antibodies. B10 cells can be stimulated for further differentiation into plasmablasts, and a subset of plasmablasts express IL-10. We found that B10 cells from Cko mice failed to generate both IL-10-non-producing and IL-10-producing plasmablasts. Mechanistically, we found that Blimp-1 can directly suppress Il-10, whereas, in the presence of activated STAT3, Blimp-1 works together with activated STAT3 to upregulate Il-10. Moreover, we also found that B10 cells improve the clearance of Candida albicans infection but worsen the infection mortality. Notably, a lack of Blimp-1 in B10 cells did not change these effects of adoptively transferred B10 cells on fungal infections. Together, our data show that Blimp-1 regulates the generation, differentiation, and IL-10 production of Bregs.

Keywords: B10 cells; Blimp-1; Candida albicans; IL-10; regulatory B cells.


Figures

Figure 1
Figure 1
Blimp-1 expression in Bregs. (A) IL-10+ B cells and IL-10 B cells were purified from C57BL/6 mouse splenocytes and then stimulated with LPS (10 μg/ml) or anti-CD40 antibody (2 μg/ml) for 48 h, after which their mRNA expression profiles were analyzed by microarray. The resulting clustering heat map diagram shows the fold changes in differentially expressed genes with changes of >1.8-fold after stimulation. Data are the mean values from two experiments. (B,C) RT-qPCR analysis of Il-10 (B) and Prdm1 (C) mRNA levels in IL-10+ B cells and IL-10 B cells isolated from mouse splenocytes. Data are the mean ± SEM (n = 3–5 mice per group). (D,E) RT-qPCR analysis of Il-10 (D) and Prdm1 (E) mRNA levels in IL-10+ cells and IL-10 cells isolated from total B, MZ B and FO B cells treated with LPS. Data are the mean ± SEM (n = 5 mice per group). Results are normalized to the IL-10 total B cells. (F,G) Blimp-1 expression by CD19+CD1dhiCD5+ B10 cells from Prdm1-EYFP reporter mice in vivo (F) and in vitro (G). (F) Prdm1-EYFP reporter mice were injected with LPS (1.25 μg/g of body weight) and sacrificed at the indicated days post-injection. Splenocytes were isolated at the indicated days and subjected to FACS analysis. Because the results from the PBS injection control group were unchanged at the indicated days, they were pooled in our statistical analysis. (G) Splenic CD19+ B cells were purified from Prdm1-EYFP reporter mice and cultured with LPS (10 μg/ml) for 5–48 h. The frequency of Blimp-1+ cells in the CD19+CD1dhiCD5+B10 gate is indicated. The results are from at least two independent experiments and were analyzed using an unpaired Student's t-test. Data are the mean ± SEM (n = 3–6 mice per group). *p < 0.05, **p < 0.01 and ***p < 0.001.
Figure 2
Figure 2
Splenic B10 population in Ctrl and Cko mice. (A) Splenic B cells were purified from Prdm1f/fCD19cre/+mice (Cko) or control littermates (Prdm1f/fCD19+/+, Ctrl) and then stimulated with LPS (10 μg/ml) for 5–48 h. PMA, ionomycin, and monensin (PIM) were added into culture for the final 5 h for intracellular staining of IL-10. The results represent the frequency of IL-10-producing cells in the CD19+ gate. Data are the mean ± SEM (n = 3–6 mice per group). (B) Il-10 reporter mice, tiger, were crossed with Cko and Ctrl mice. Splenic B cells were purified from the Cko × tiger or Ctrl × tiger mice and then stimulated with LPS (10 μg/ml) for 5–48 h before use in an analysis of the frequency of GFP+ B10 cells. (C,D) Cko × tiger or Ctrl × tiger mice were given LPS (1.25 μg/g of body weight). B10 cells (C) and IL-10+ (GFP+) B10 cells (D) in Cko × tiger or Ctrl × tiger mice were analyzed at the indicated days. A PBS-injected group was used as the control. Data are the mean ± SEM (n = 3 mice per group). (E) PCR analysis of indicated genomic DNA isolated from splenic B220+ B10 cells of Cko-ER and littermate control Ctrl-ER mice 14 days after injection with 4-OHT. Primers used for the detection of Prdm1 deletion were indicated by arrows. (F) Fourteen days after 4-OHT injection, Cko-ER and Ctrl-ER mice were injected with LPS (1.25 μg/g of body weight). IL-10+ B10 cells were then analyzed 3 days later by FACS analysis. Data are the mean ± SEM (n = 3 mice per group). A PBS-injected group was used as the control. Results are from at least two independent experiments and were analyzed using an unpaired Student's t-test. *p < 0.05, **p < 0.01 and ***p < 0.001.
Figure 3
Figure 3
B10 cells lacking Blimp-1 failed to suppress T-cell proliferation. (A) Experimental design for the co-culture of B10 cells with anti-CD3-and anti-CD28-stimulated naïve CD4+ T cells. CFSE-labeled CD4+ T cells in the presence of anti-CD3 and anti-CD28 antibody were co-cultured with B10 cells from mice of the indicated genotypes for 3 days and then analyzed for CFSE dilution by FACS. (B) FACS analysis showing the frequency of dividing CFSE-labeled CD4+ T cells. Data are representative from three independent biological replicates. (C) Statistical results from three experiments in (B) are shown. Data were analyzed using an unpaired Student's t-test and are the mean ± SEM (n = 3 mice per group). *p < 0.05 and ***p < 0.001. (D) GO analysis showed a significant enrichment for genes in “T cell selection” and “leukocyte migration” in the category of immune system process within the Biological Process ontology in anti-CD40 stimulated Cko B10 cells as compared with genes in anti-CD40 stimulated Ctrl B10 cells. The significant terms in the immune system process within the Biological Process ontology were all listed.
Figure 4
Figure 4
Blimp-1-deficient mice had increased mortality in systemic candidiasis. (A) Schematic design for the infection of Ctrl, Cko, Ctrl × tiger, and Cko × tiger mice with 5 × 10⁵ CFU of C. albicans by intravenous injection. (B) The survival rates of Ctrl and Cko mice were recorded (n = 5 mice per group). The differences in survival rates were analyzed by a log-rank (Mantel-Cox) test. (C) Three days after infection, the fungal burden in the kidneys of Ctrl and Cko mice was quantified, and the resulting data are shown as the log10 value (n = 4 mice per group). (D–F) The frequency (D,E) and numbers (F) of B10 cells in the Ctrl × tiger and Cko × tiger mice at day 3 post-infection. (G–I) The frequency (G,H) and numbers (I) of IL-10+ (GFP+) B10 cells in the Ctrl × tiger and Cko × tiger mice at day 3 post-infection. Splenocytes were stimulated with LPS for 5 h before cell surface staining (n = 3 mice per group in D–I). Results are from at least two independent experiments and were analyzed by using an unpaired Student's t-test. Data are the mean ± SEM. *p < 0.05, **p < 0.01, and ***p < 0.001.
Figure 5
Figure 5
B10 cells promoted the clearance of C. albicans. (A) Adoptive transfer of B10 cells into wildtype mice. Splenic B10 cells were purified from wildtype mice by cell sorting. Recipient mice were given either PBS or 1 × 10⁶ B10 cells at 1 day before C. albicans infection. (B) The survival rates of the mice in (A) were recorded (n > 8 mice per group). The differences in survival were analyzed by a log-rank (Mantel-Cox) test. (C) Purified splenic B10 cells from Ctrl or Cko mice were adoptively transferred into wildtype recipient mice as described in (A). (D) The fungal burden in the kidneys was quantified in day 3 post-infection (n = 3 mice per group). Results are from at least two independent experiments and were analyzed using an unpaired Student's t-test. Data are the mean ± SEM. *p < 0.05 and ***p < 0.001.
Figure 6
Figure 6
Blimp-1-deficient B10 cells stimulated in culture showed disturbed IL-10 production. (A,B) CD19+CD1dhiCD5+ B10 cells were sorted from Ctrl × tiger and Cko × tiger mice and then stimulated with LPS (10 μg/ml) for the indicated lengths of time. FACS analysis showing the frequency of IL-10+ (GFP+) cells in the CD138 gate (A). Statistical results from two independent biological repeats of the experiment described in (A) are shown (B). (C,D) The Il-10 mRNA levels in stimulated B10 cells (C) and IL-10 secretion by stimulated B10 cells (D) from the culture described in (A) were detected by RT-qPCR and ELISA, respectively (n = 3–8 mice per group). Data were analyzed using an unpaired Student's t-test and are the mean ± SEM. *p < 0.05, **p < 0.01, and ***p < 0.001.
Figure 7
Figure 7
Blimp-1 collaborated with STAT3 to upregulate Il-10 expression. (A) Relative fold differences of the Il-10 promoter-dependent luciferase reporter activities repressed by the indicated doses of Blimp-1 expression plasmid in Raji B cells at 48 h post-transfection. (B) Schematic representation of predicted Blimp-1- and STAT3-binding sites on the Il-10 promoter. (C) ChIP analysis of Blimp-1 binding to the Il-10 promoter in LPS-stimulated splenic B cells. The binding of Blimp-1 to −9 kb of TSS and CIITA promoter III was used as the positive control, while the CIITA 3'UTR and Il-10 3'UTR served as negative controls. (D) Il-10 promoter-dependent luciferase reporters carrying mutations in −438–432 bp of TSS (M1) or in −147 to −138 bp and −123 to −117 bp of TSS (M2) were used in co-transfection in luciferase reporter assays. The CIITA promoter III was used as the positive control. (E) STAT3 was phosphorylated at tyrosine 705 in splenic B10 cells purified from Ctrl or Cko mice and stimulated with LPS at the indicated timepoints. (F) Raji B cells were co-transfected with wildtype or STAT3-binding-site-mutated Il-10 promoter-dependent luciferase constructs along with an expression plasmid encoding a constitutively active form of STAT3 (STAT3-CA). (G) Plasmids encoding STAT3-CA and full-length (a) or a truncated form of Blimp-1 lacking the DNA binding domain (b) were used in the Il-10 promoter-dependent luciferase reporter assay. The expression of Blimp-1 and phosphorylated STAT3 (Y705) was confirmed by immunoblotting. (H) Luciferase reporter assays were conducted in Raji B cells co-transfected with the Il-10 promoter-dependent luciferase reporter and the indicated plasmids in the presence or absence of IL-21 (20 μg/ml) treatment for 48 h. The expression of Blimp-1 and pSTAT3 (Y705 and S727) was confirmed by immunoblotting. Results are from three independent experiments and were analyzed by using an unpaired Student's t-test. Data are the mean ± SEM. *p < 0.05, **p < 0.01, and ***p < 0.001.

Similar articles

Cited by

References

    1. Shen P, Roch T, Lampropoulou V, O'Connor RA, Stervbo U, Hilgenberg E, et al. . IL-35-producing B cells are critical regulators of immunity during autoimmune and infectious diseases. Nature. (2014) 507:366–370. 10.1038/nature12979 - DOI - PMC - PubMed
    1. Tedder TF. B10 cells: a functionally defined regulatory B cell subset. J Immunol. (2015) 194:1395–401. 10.4049/jimmunol.1401329 - DOI - PubMed
    1. Rosser EC, Mauri C. Regulatory B cells: origin, phenotype, and function. Immunity. (2015) 42:607–12. 10.1016/j.immuni.2015.04.005 - DOI - PubMed
    1. Evans JG, Chavez-Rueda KA, Eddaoudi A, Meyer-Bahlburg A, Rawlings DJ, Ehrenstein MR, et al. . Novel suppressive function of transitional 2 B cells in experimental arthritis. J Immunol. (2007) 178:7868–78. 10.4049/jimmunol.178.12.7868 - DOI - PubMed
    1. Yanaba K, Bouaziz JD, Haas KM, Poe JC, Fujimoto M, Tedder TF. A regulatory B cell subset with a unique CD1d(hi)CD5(+) phenotype controls T cell-dependent inflammatory responses. Immunity. (2008) 28:639–50. 10.1016/j.immuni.2008.03.017 - DOI - PubMed

Publication types

MeSH terms