. 2019 Aug 16:10:714.
doi: 10.3389/fgene.2019.00714. eCollection 2019.

The Length of the Expressed 3' UTR Is an Intermediate Molecular Phenotype Linking Genetic Variants to Complex Diseases

Affiliations

The Length of the Expressed 3' UTR Is an Intermediate Molecular Phenotype Linking Genetic Variants to Complex Diseases

Elisa Mariella et al. Front Genet. .

Abstract

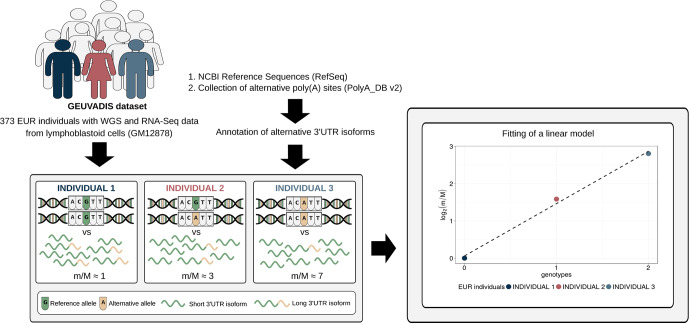
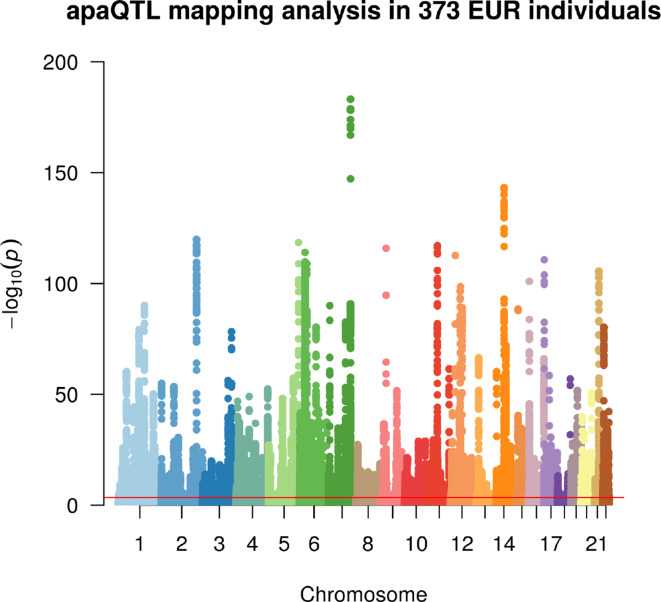
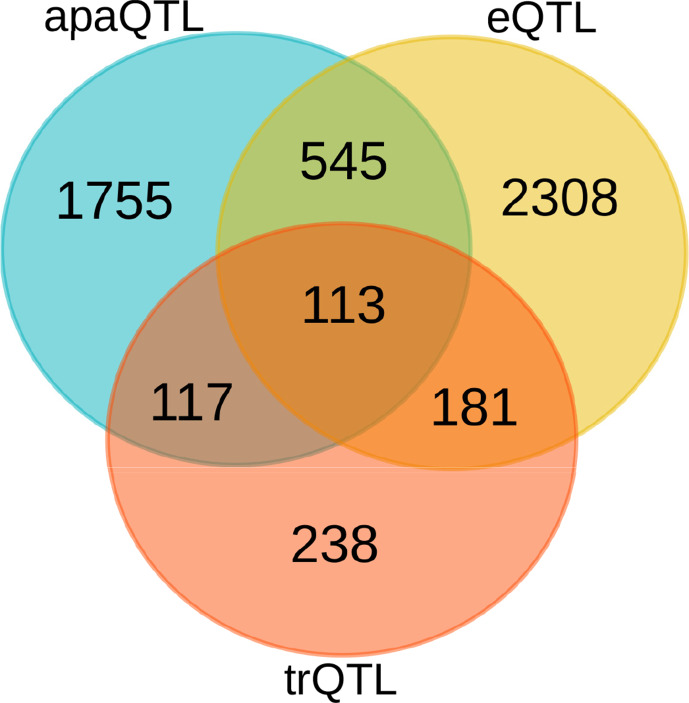
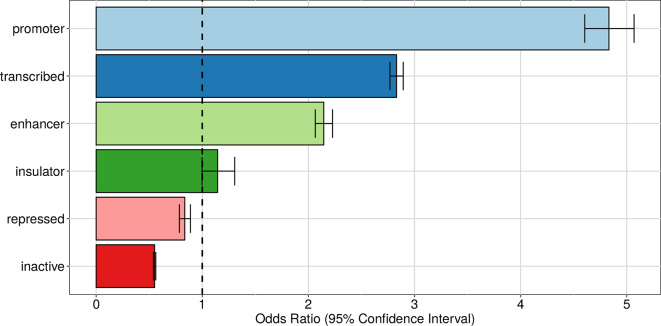
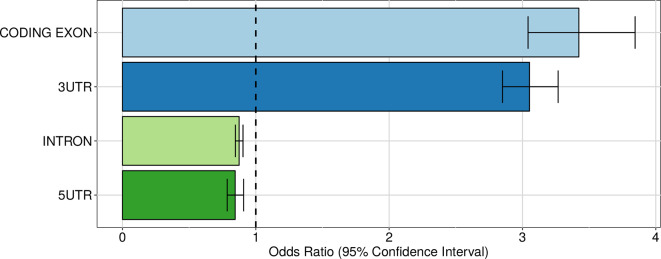
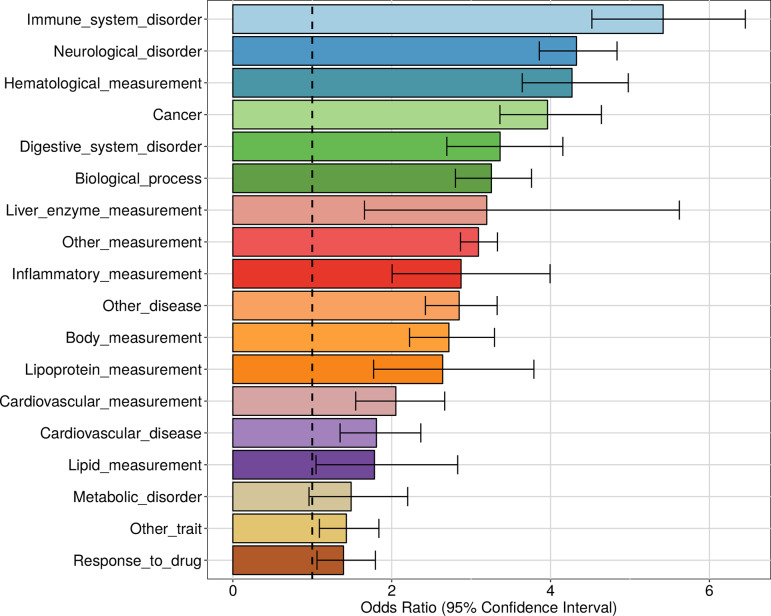
In the last decades, genome-wide association studies (GWAS) have uncovered tens of thousands of associations between common genetic variants and complex diseases. However, these statistical associations can rarely be interpreted functionally and mechanistically. As the majority of the disease-associated variants are located far from coding sequences, even the relevant gene is often unclear. A way to gain insight into the relevant mechanisms is to study the genetic determinants of intermediate molecular phenotypes, such as gene expression and transcript structure. We propose a computational strategy to discover genetic variants affecting the relative expression of alternative 3' untranslated region (UTR) isoforms, generated through alternative polyadenylation, a widespread posttranscriptional regulatory mechanism known to have relevant functional consequences. When applied to a large dataset in which whole genome and RNA sequencing data are available for 373 European individuals, 2,530 genes with alternative polyadenylation quantitative trait loci (apaQTL) were identified. We analyze and discuss possible mechanisms of action of these variants, and we show that they are significantly enriched in GWAS hits, in particular those concerning immune-related and neurological disorders. Our results point to an important role for genetically determined alternative polyadenylation in affecting predisposition to complex diseases, and suggest new ways to extract functional information from GWAS data.

Keywords: RNA sequencing (RNA-Seq); alternative polyadenylation; genome-wide association studies (GWAS); human genetic variants; quantitative trait loci (QTL); whole-genome sequencing (WGS).


Figures

Figure 1
Figure 1
Schematic representation of the method. Genotypic data paired with RNA-Seq data from a large cohort of individuals are required to perform alternative polyadenylation quantitative trait loci (apaQTL) mapping analysis. RNA-Seq data are exploited, together with an annotation of alternative 3′ untranslated region (UTR) isoforms, to compute for each gene the m/M value that is proportional to the ratio between the expression of its short and long 3′ UTR isoforms. Then, the association between the m/M values of a gene and each nearby genetic variant is evaluated by linear regression. Genotypes are defined in the standard way: 0 means homozygous for the reference allele, 1 means heterozygous, and 2 indicates the presence of two copies of the alternative allele.
Figure 2
Figure 2
Manhattan plot illustrating the results of the apaQTL mapping analysis. For each fitted model, the −log10 nominal P value is shown according to the position of the tested genetic variant. The red line indicates the threshold for genome-wide statistical significance, after multiple-testing correction (nominal P < 3.1 × 10⁻⁴, corresponding to corrected empirical P < 0.05).
Figure 3
Figure 3
Comparison of genes with different molecular QTLs. Overlap between genes with significant alternative polyadenylation QTL (apaQTL), expression QTL (eQTL), and transcript ratio QTL (trQTL).
Figure 4
Figure 4
Enrichment of apaQTLs within active genomic regions in the GM12878 cell line. For each broad state, that was defined starting from the ChromHMM annotation, the odds ratio (OR) obtained by logistic regression and its 95% CI are shown.
Figure 5
Figure 5
Enrichment of intragenic apaQTLs within coding and noncoding transcript regions. For each gene region, the OR obtained by logistic regression and its 95% CI are shown.
Figure 6
Figure 6
(A) Boxplot showing the variation of the log2-transformed m/M values obtained for IRF5 as a function of the genotype of the individuals for rs10954213. (B) LocusZoom plot (Pruim et al., 2010) illustrating the results obtained for IRF5 in the genomic region around rs10954213 (100 kb both upstream and downstream its genomic location). In the top panel, each tested genetic variant was reported as a function of both its genomic coordinate and its association level with IRF5 (log10-transformed nominal P value); the points color reflects the linkage disequilibrium (LD) level (R 2) between rs10954213 and each of the other genetic variants in the locus. The bottom panel shows the genes and their orientation in the locus. (C) Figure adapted from the UCSC Genome Browser screenshot. RNA-Seq tracks, reporting coverage per million mapped reads, are shown for three representative individuals: NA12778 (homozygous for the reference allele), HG00325 (heterozygous) and NA12872 (homozygous for the alternative allele). IRF5 RefSeq, IRF5 PRE/POST segments, poly(A) sites, and common SNPs are shown. The rs10954213 variant and the affected poly(A) site (Hs.521181.1.20) are highlighted.
Figure 7
Figure 7
(A) Boxplot showing the variation of the log2-transformed m/M values obtained for MTRR as a function of the genotype of the individuals for rs9332. (B) LocusZoom plot illustrating the results obtained for MTRR in the genomic region around rs9332 (100 kb both upstream and downstream its genomic location). (C) Figure adapted from the UCSC Genome Browser screenshot. RNA-Seq tracks, reporting coverage per million mapped reads, are shown for three representative individuals: HG00268 (homozygous for the reference allele), NA12340 (heterozygous), and NA11994 (homozygous for the alternative allele). MTRR RefSeq, MTRR PRE/POST segments, poly(A) sites, and common SNPs are shown. The rs9332 variant and the affected poly(A) site (Hs.481551.1.38) are highlighted.
Figure 8
Figure 8
Enrichment of genome-wide association studies (GWAS) hits among apaQTLs, for different categories of complex traits. For each category, the OR obtained by logistic regression and its 95% CI are shown.
Figure 9
Figure 9
(A) The effect of rs10954213 on the relative expression of the IRF5 alternative isoforms was investigated also in a small cohort of systemic lupus erythematosus (SLE) patients. The boxplot shows the variation of the log2-transformed m/M values obtained for IRF5 as a function of the genotype of the individuals. (B) Figure adapted from the UCSC Genome Browser screenshot. RNA-Seq tracks, reporting coverage per thousand mapped reads, are shown for three representative individuals: SRR2443195 (homozygous for the reference allele), SRR2443197 (heterozygous), and SRR2443242 (homozygous for the alternative allele). IRF5 RefSeq, IRF5 PRE/POST segments, poly(A) sites, and common SNPs are shown. The rs10954213 variant and the affected poly(A) site (Hs.521181.1.20) are highlighted.

References

    1. Agarwal V., Bell G. W., Nam J.-W., Bartel D. P. (2015). Predicting effective microRNA target sites in mammalian mRNAs. Elife 4, e05005. 10.7554/eLife.05005 - DOI - PMC - PubMed
    1. Aguet F., Brown A. A., Castel S. E., Davis J. R., He Y., Jo B., et al. (2017). Genetic effects on gene expression across human tissues. Nature 550, 204–213. 10.1038/nature24277 - DOI - PMC - PubMed
    1. Albert F. W., Kruglyak L. (2015). The role of regulatory variation in complex traits and disease. Nat. Rev. Genet. 16, 197–212. 10.1038/nrg3891 - DOI - PubMed
    1. An J. J., Gharami K., Liao G.-Y., Woo N. H., Lau A. G., Vanevski F., et al. (2008). Distinct role of long 3’ UTR BDNF mRNA in spine morphology and synaptic plasticity in hippocampal neurons. Cell 134, 175–187. 10.1016/j.cell.2008.05.045 - DOI - PMC - PubMed
    1. Ardlie K. G., Deluca D. S., Segre A. V., Sullivan T. J., Young T. R., Gelfand E. T., et al. (2015). The Genotype-Tissue Expression (GTEx) pilot analysis: multitissue gene regulation in humans. Science 348, 648–660. 10.1126/science.1262110 - DOI - PMC - PubMed