. 2019:3:PO.18.00400.
doi: 10.1200/PO.18.00400. Epub 2019 Jul 31.

Cancer-Specific Thresholds Adjust for Whole Exome Sequencing-based Tumor Mutational Burden Distribution

Affiliations

Cancer-Specific Thresholds Adjust for Whole Exome Sequencing-based Tumor Mutational Burden Distribution

Evan M Fernandez et al. JCO Precis Oncol. 2019.

Abstract

Purpose: To understand the clinical context of tumor mutational burden (TMB) when comparing a pan-cancer threshold and a cancer-specific threshold.

Materials and methods: Using whole exome sequencing (WES) data from primary tumors in The Cancer Genome Atlas (TCGA) (n=3,534) and advanced/metastatic tumors from Weill Cornell Medicine (WCM Advanced) (n=696), TMB status was determined using a pan-cancer and cancer-specific threshold. Survival curves, number of samples classified as TMB high, and predicted neoantigens were used to evaluate the differences between thresholds.

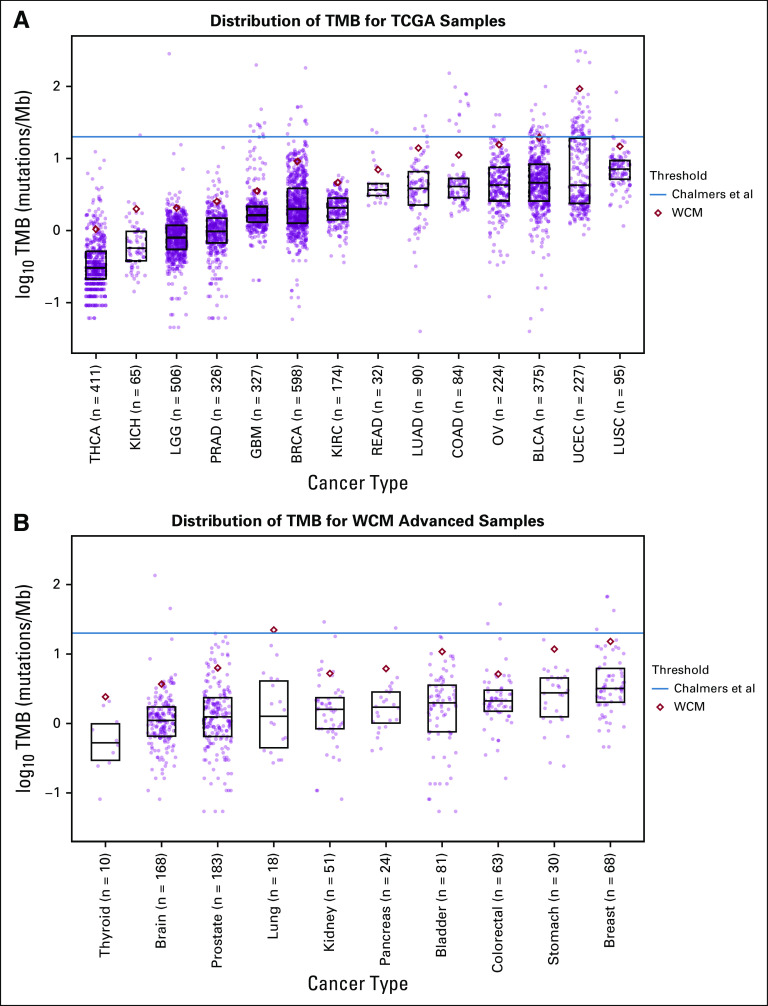
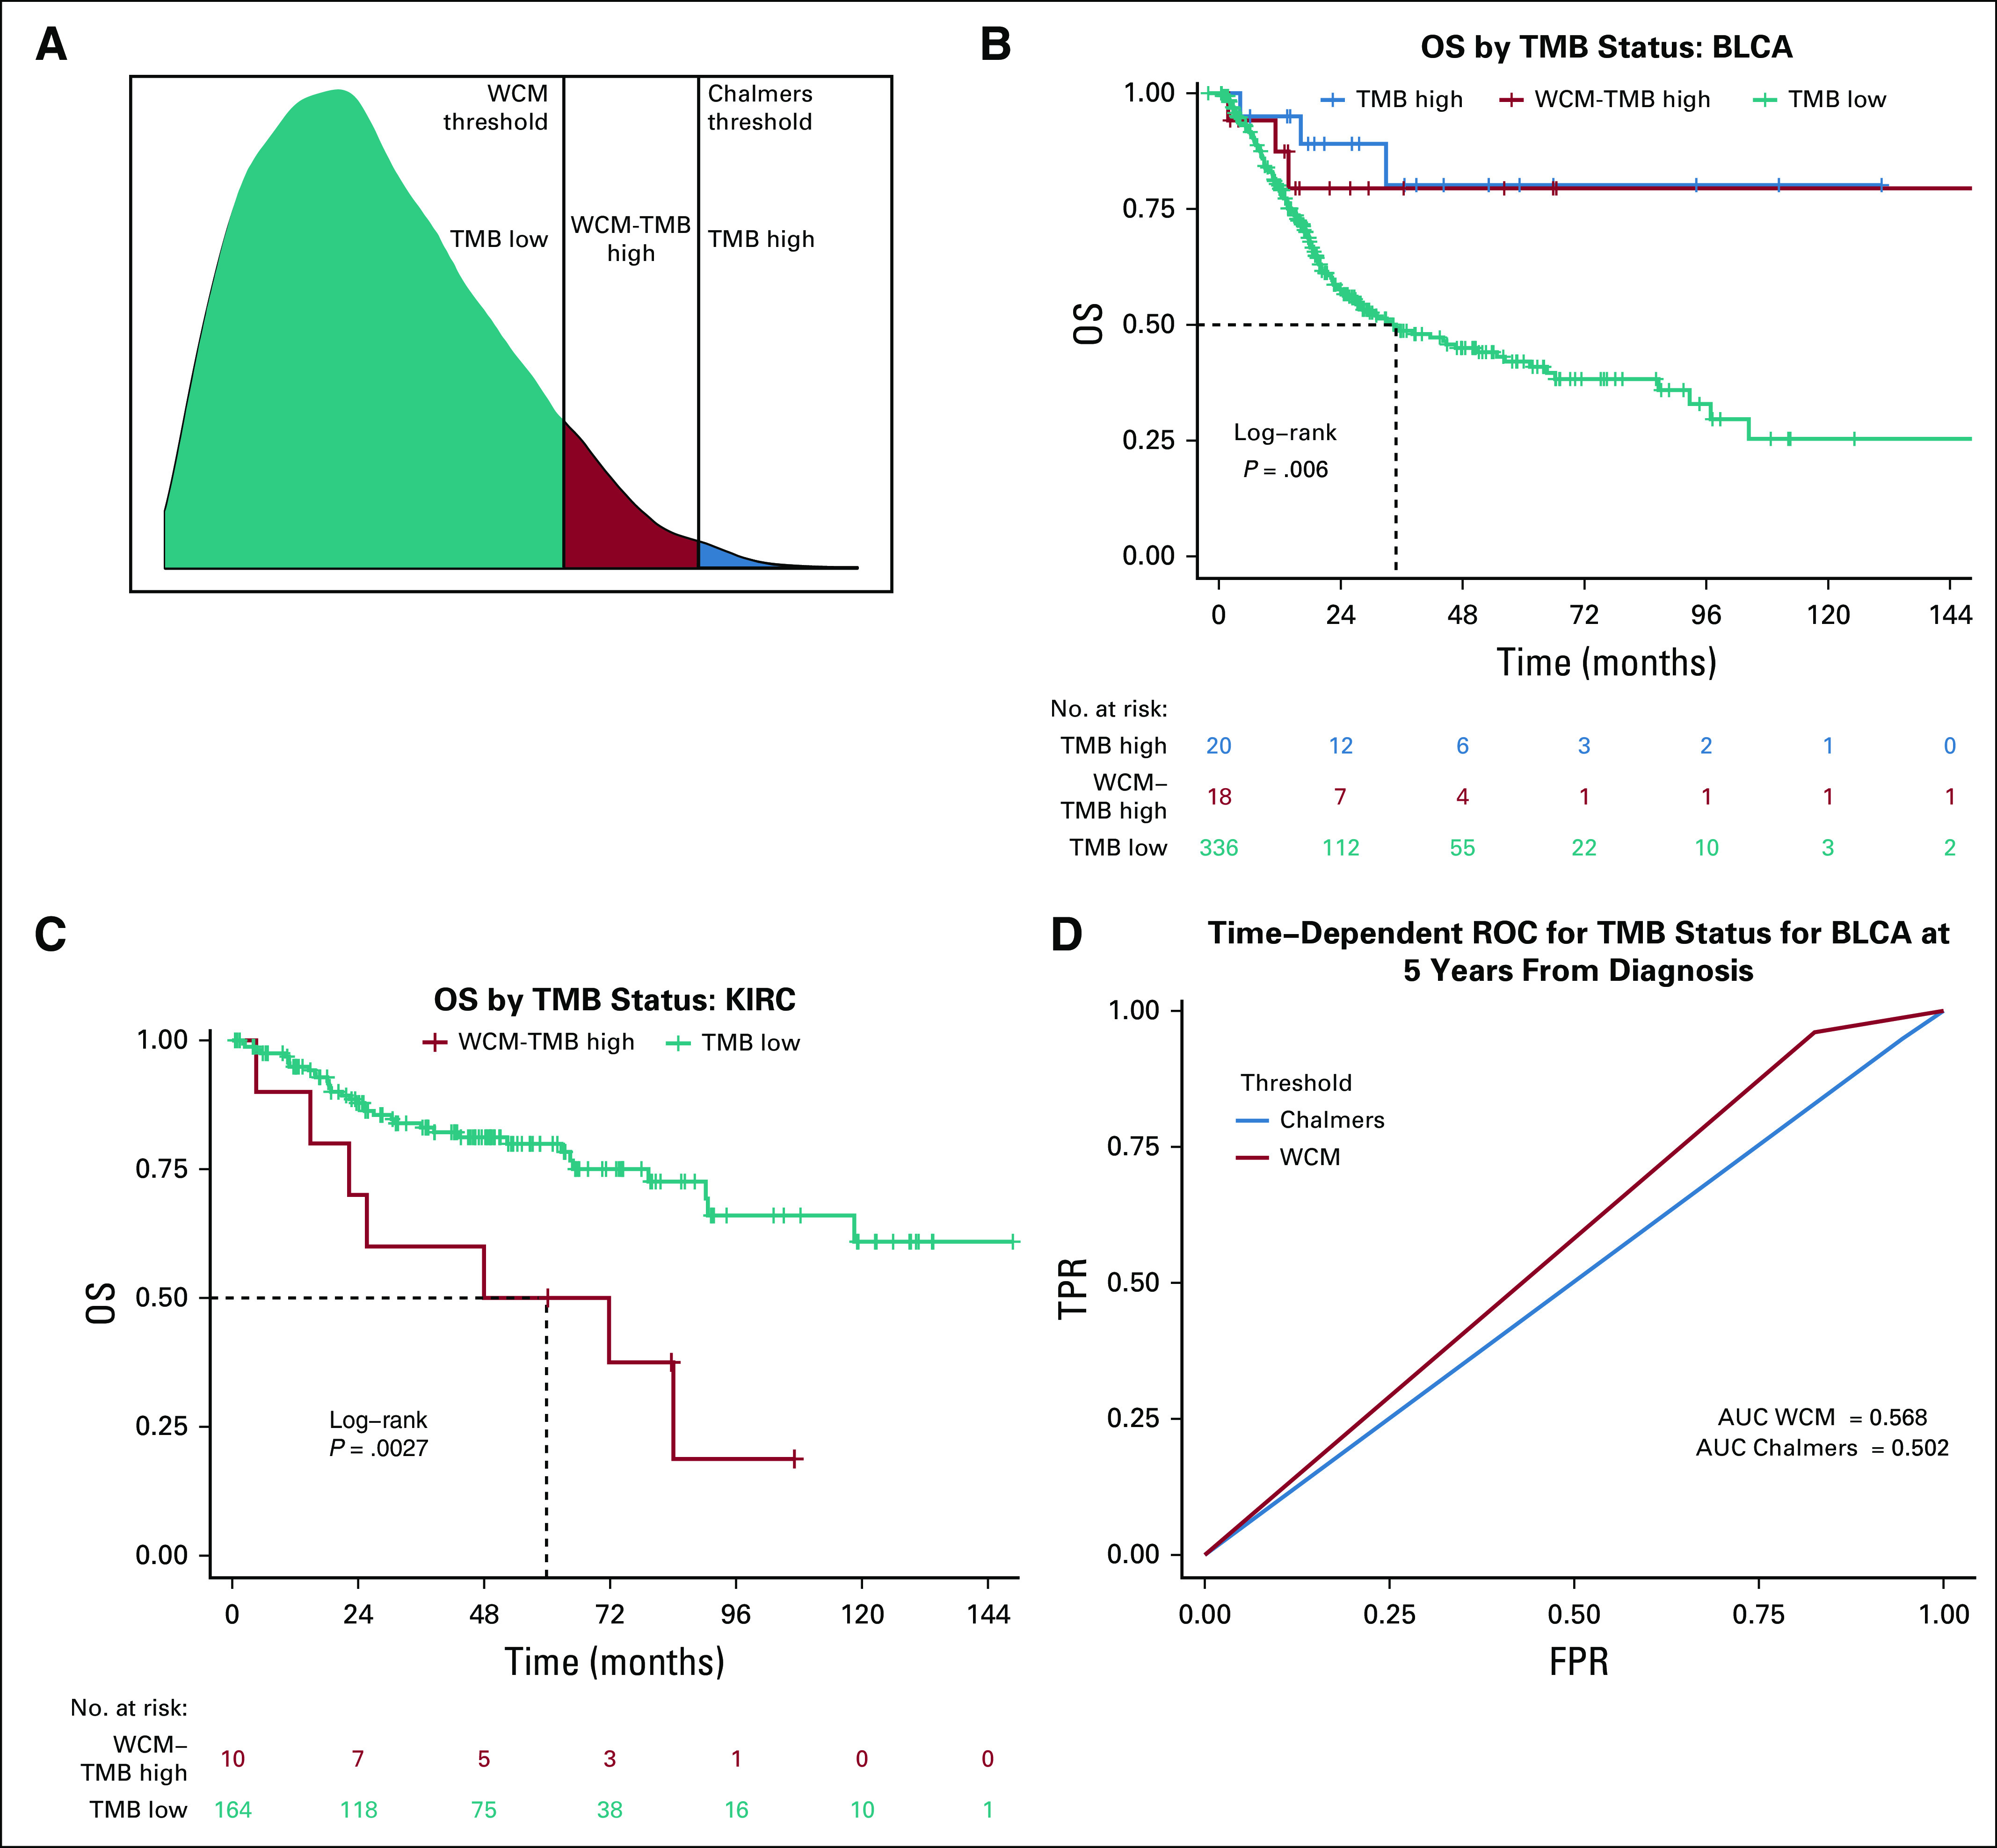
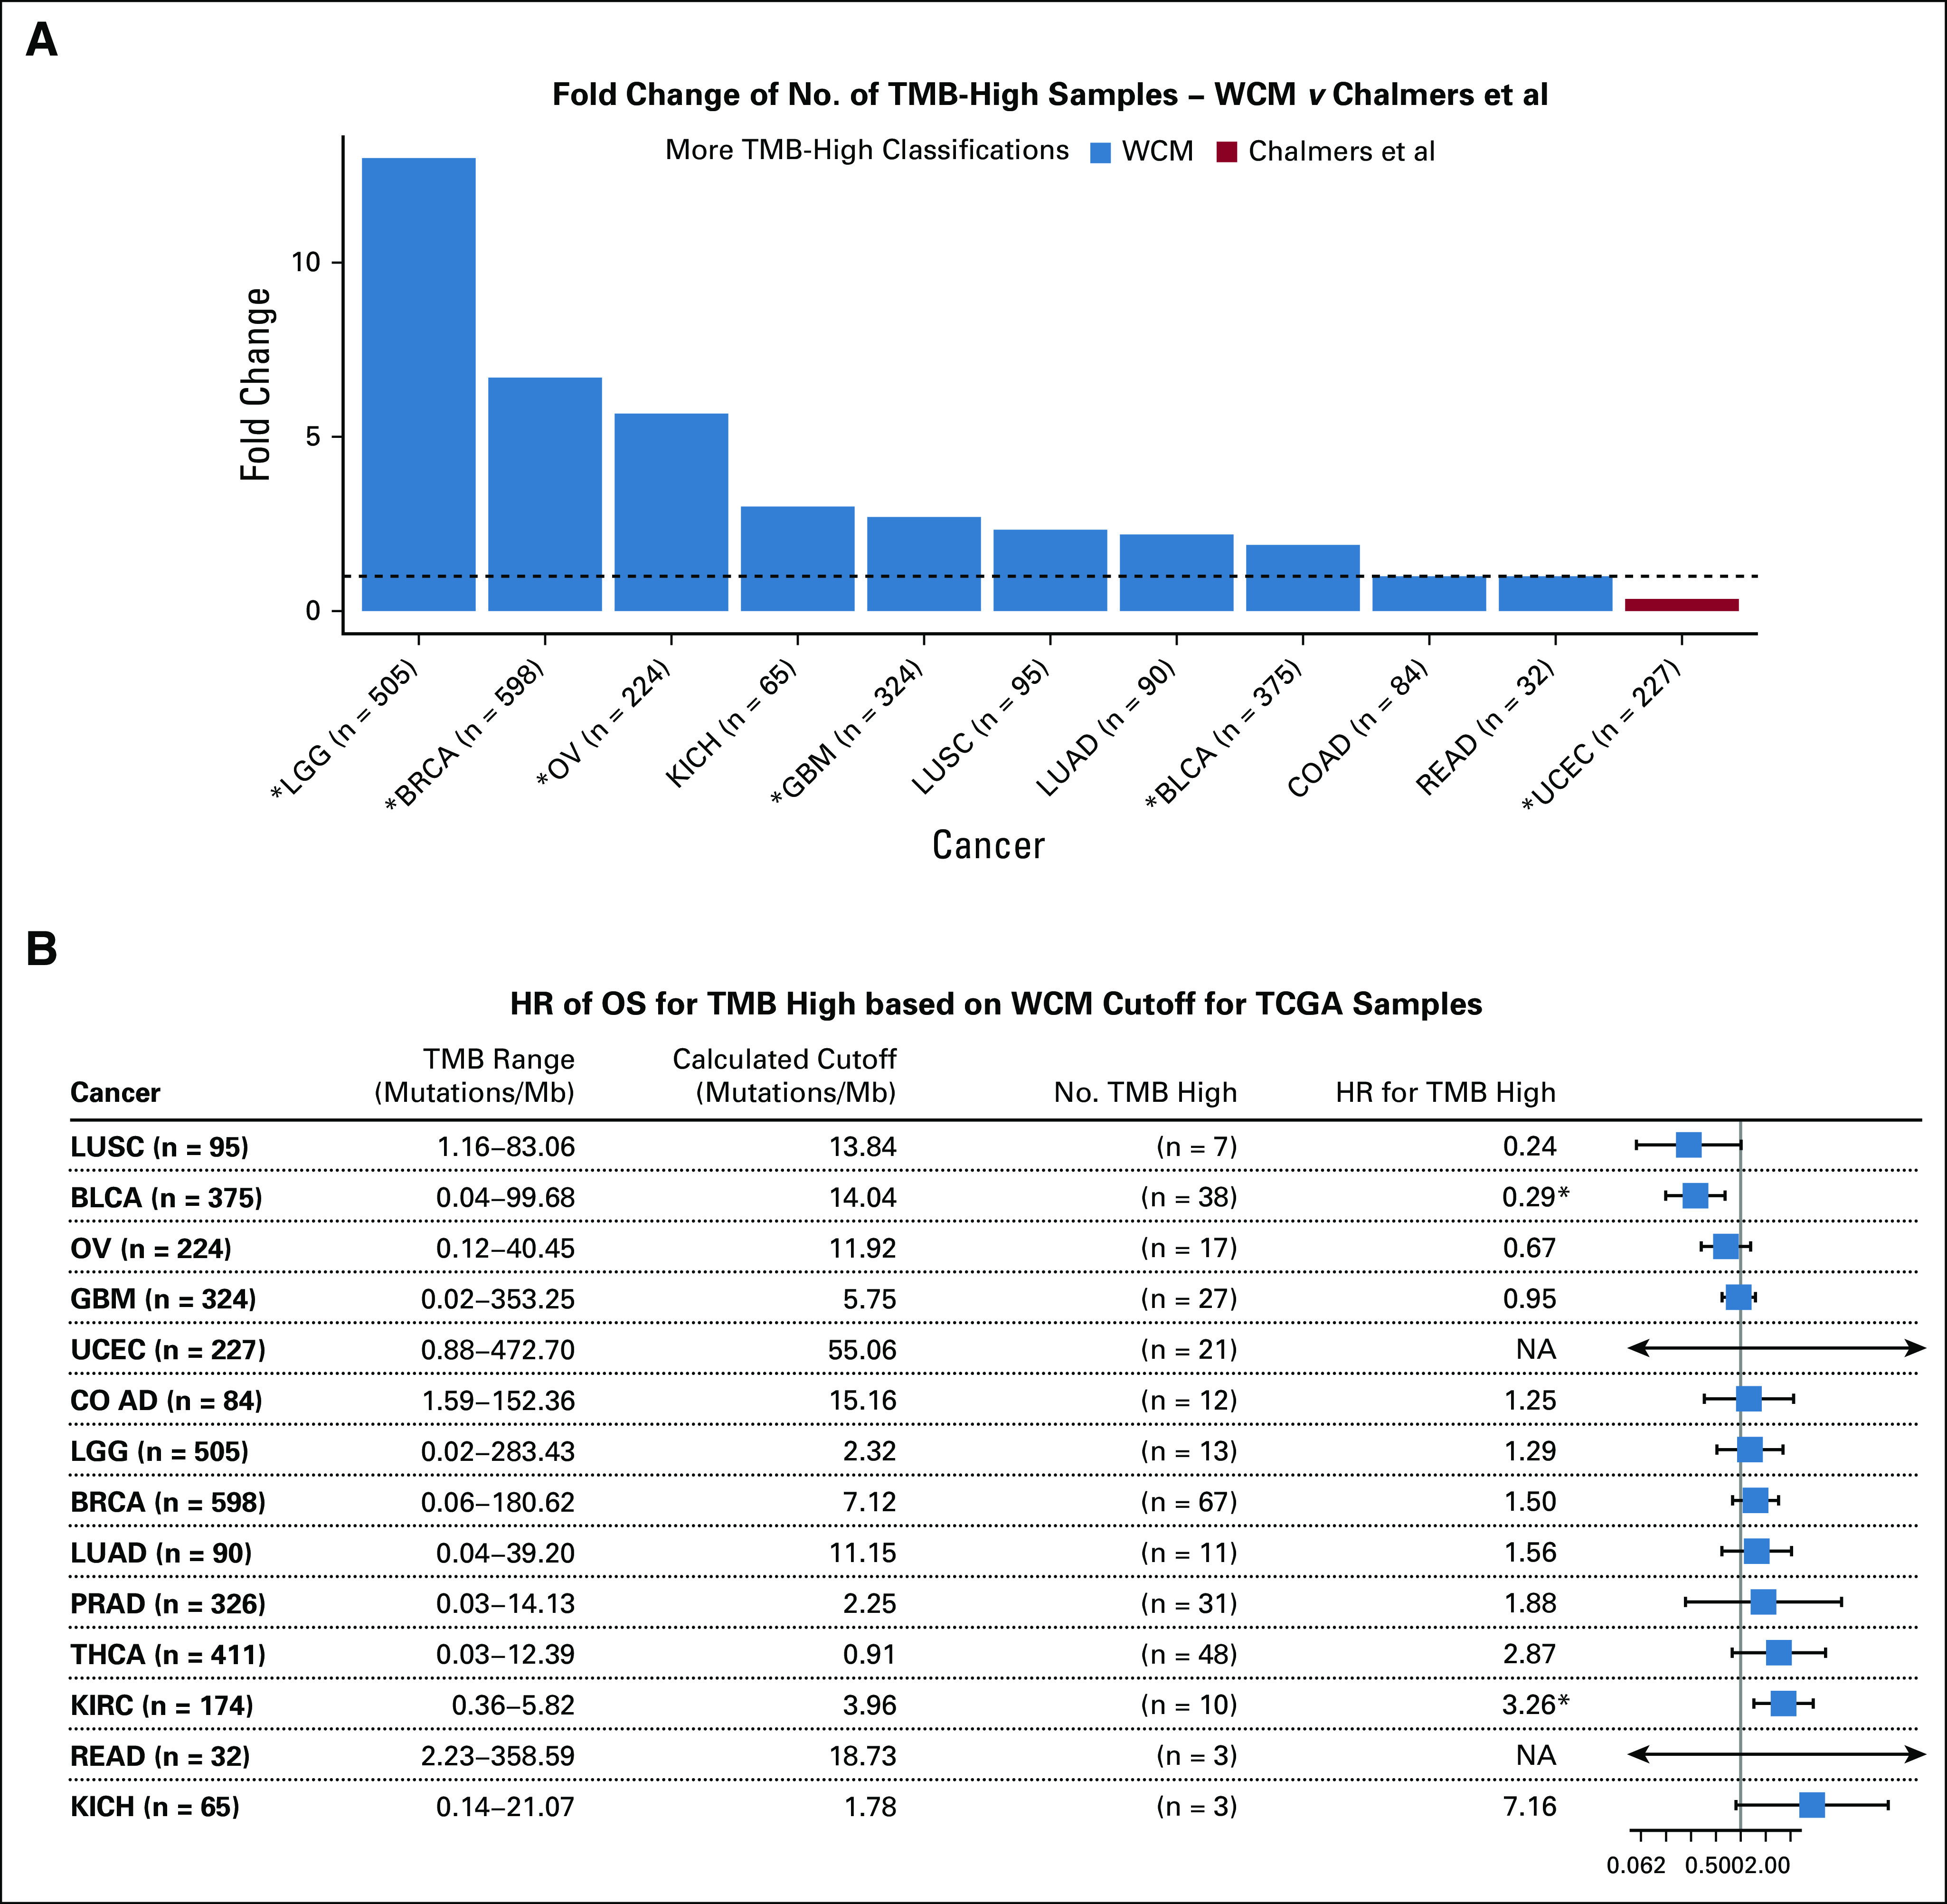
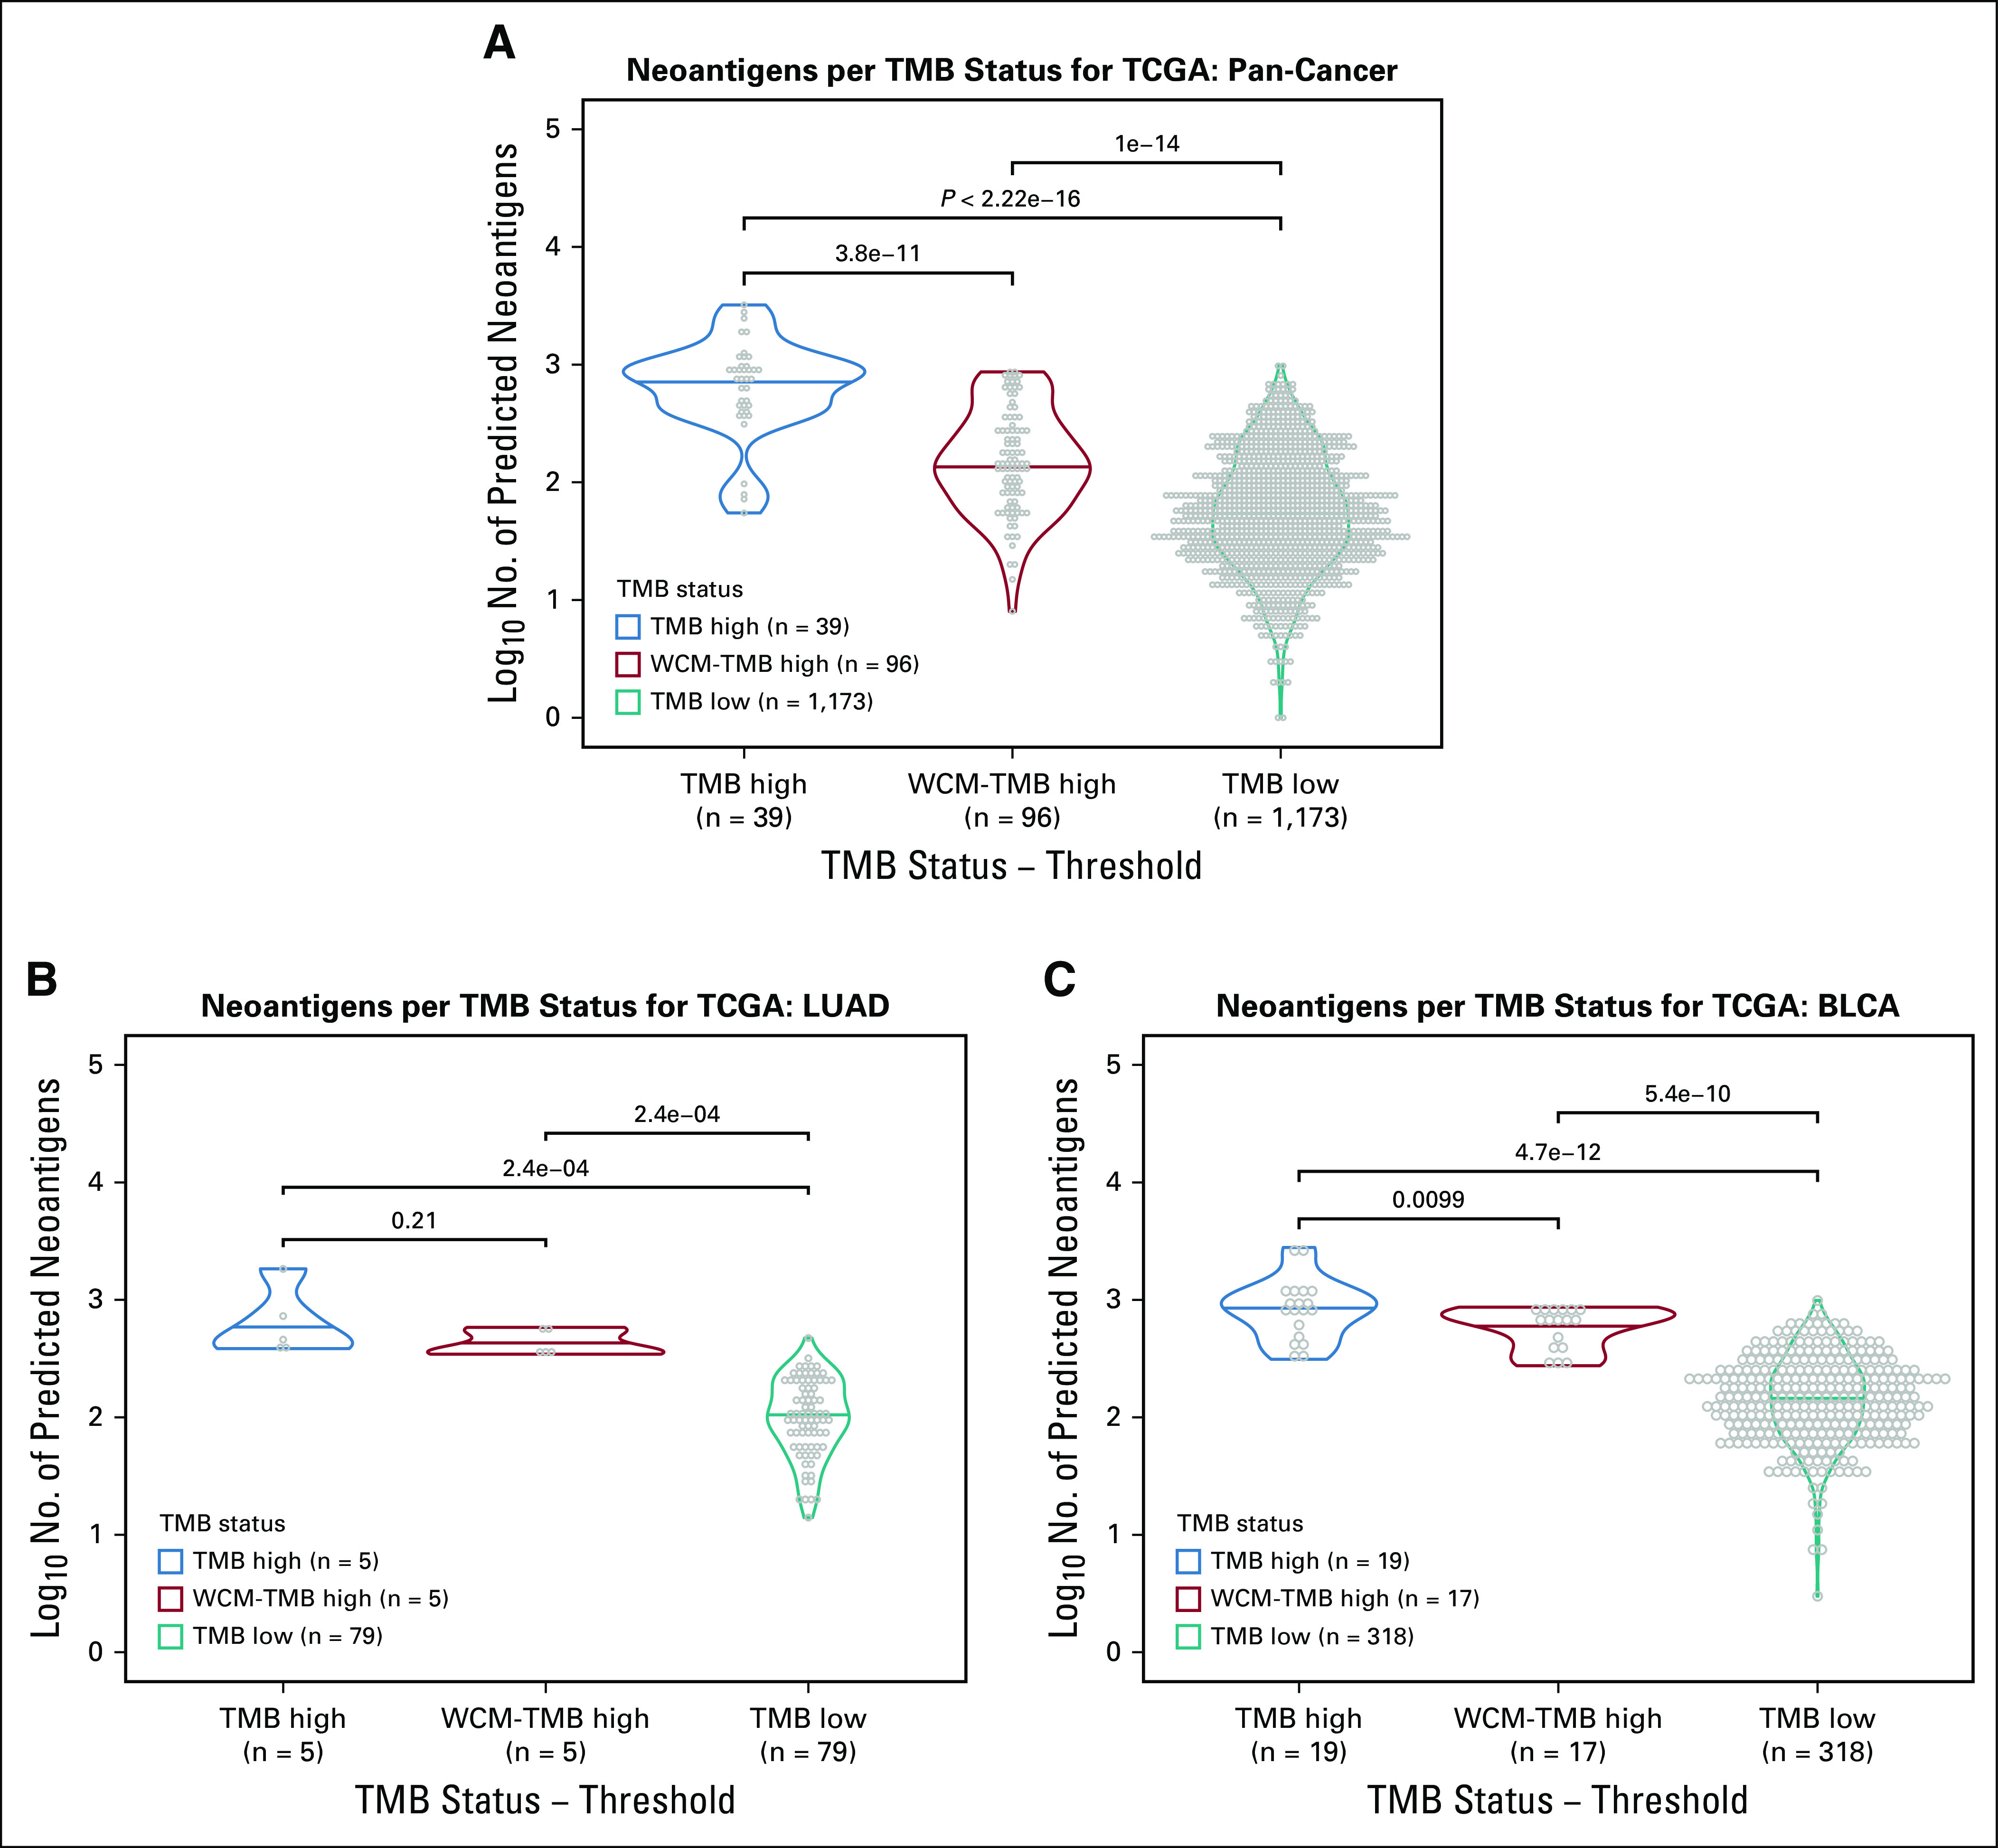
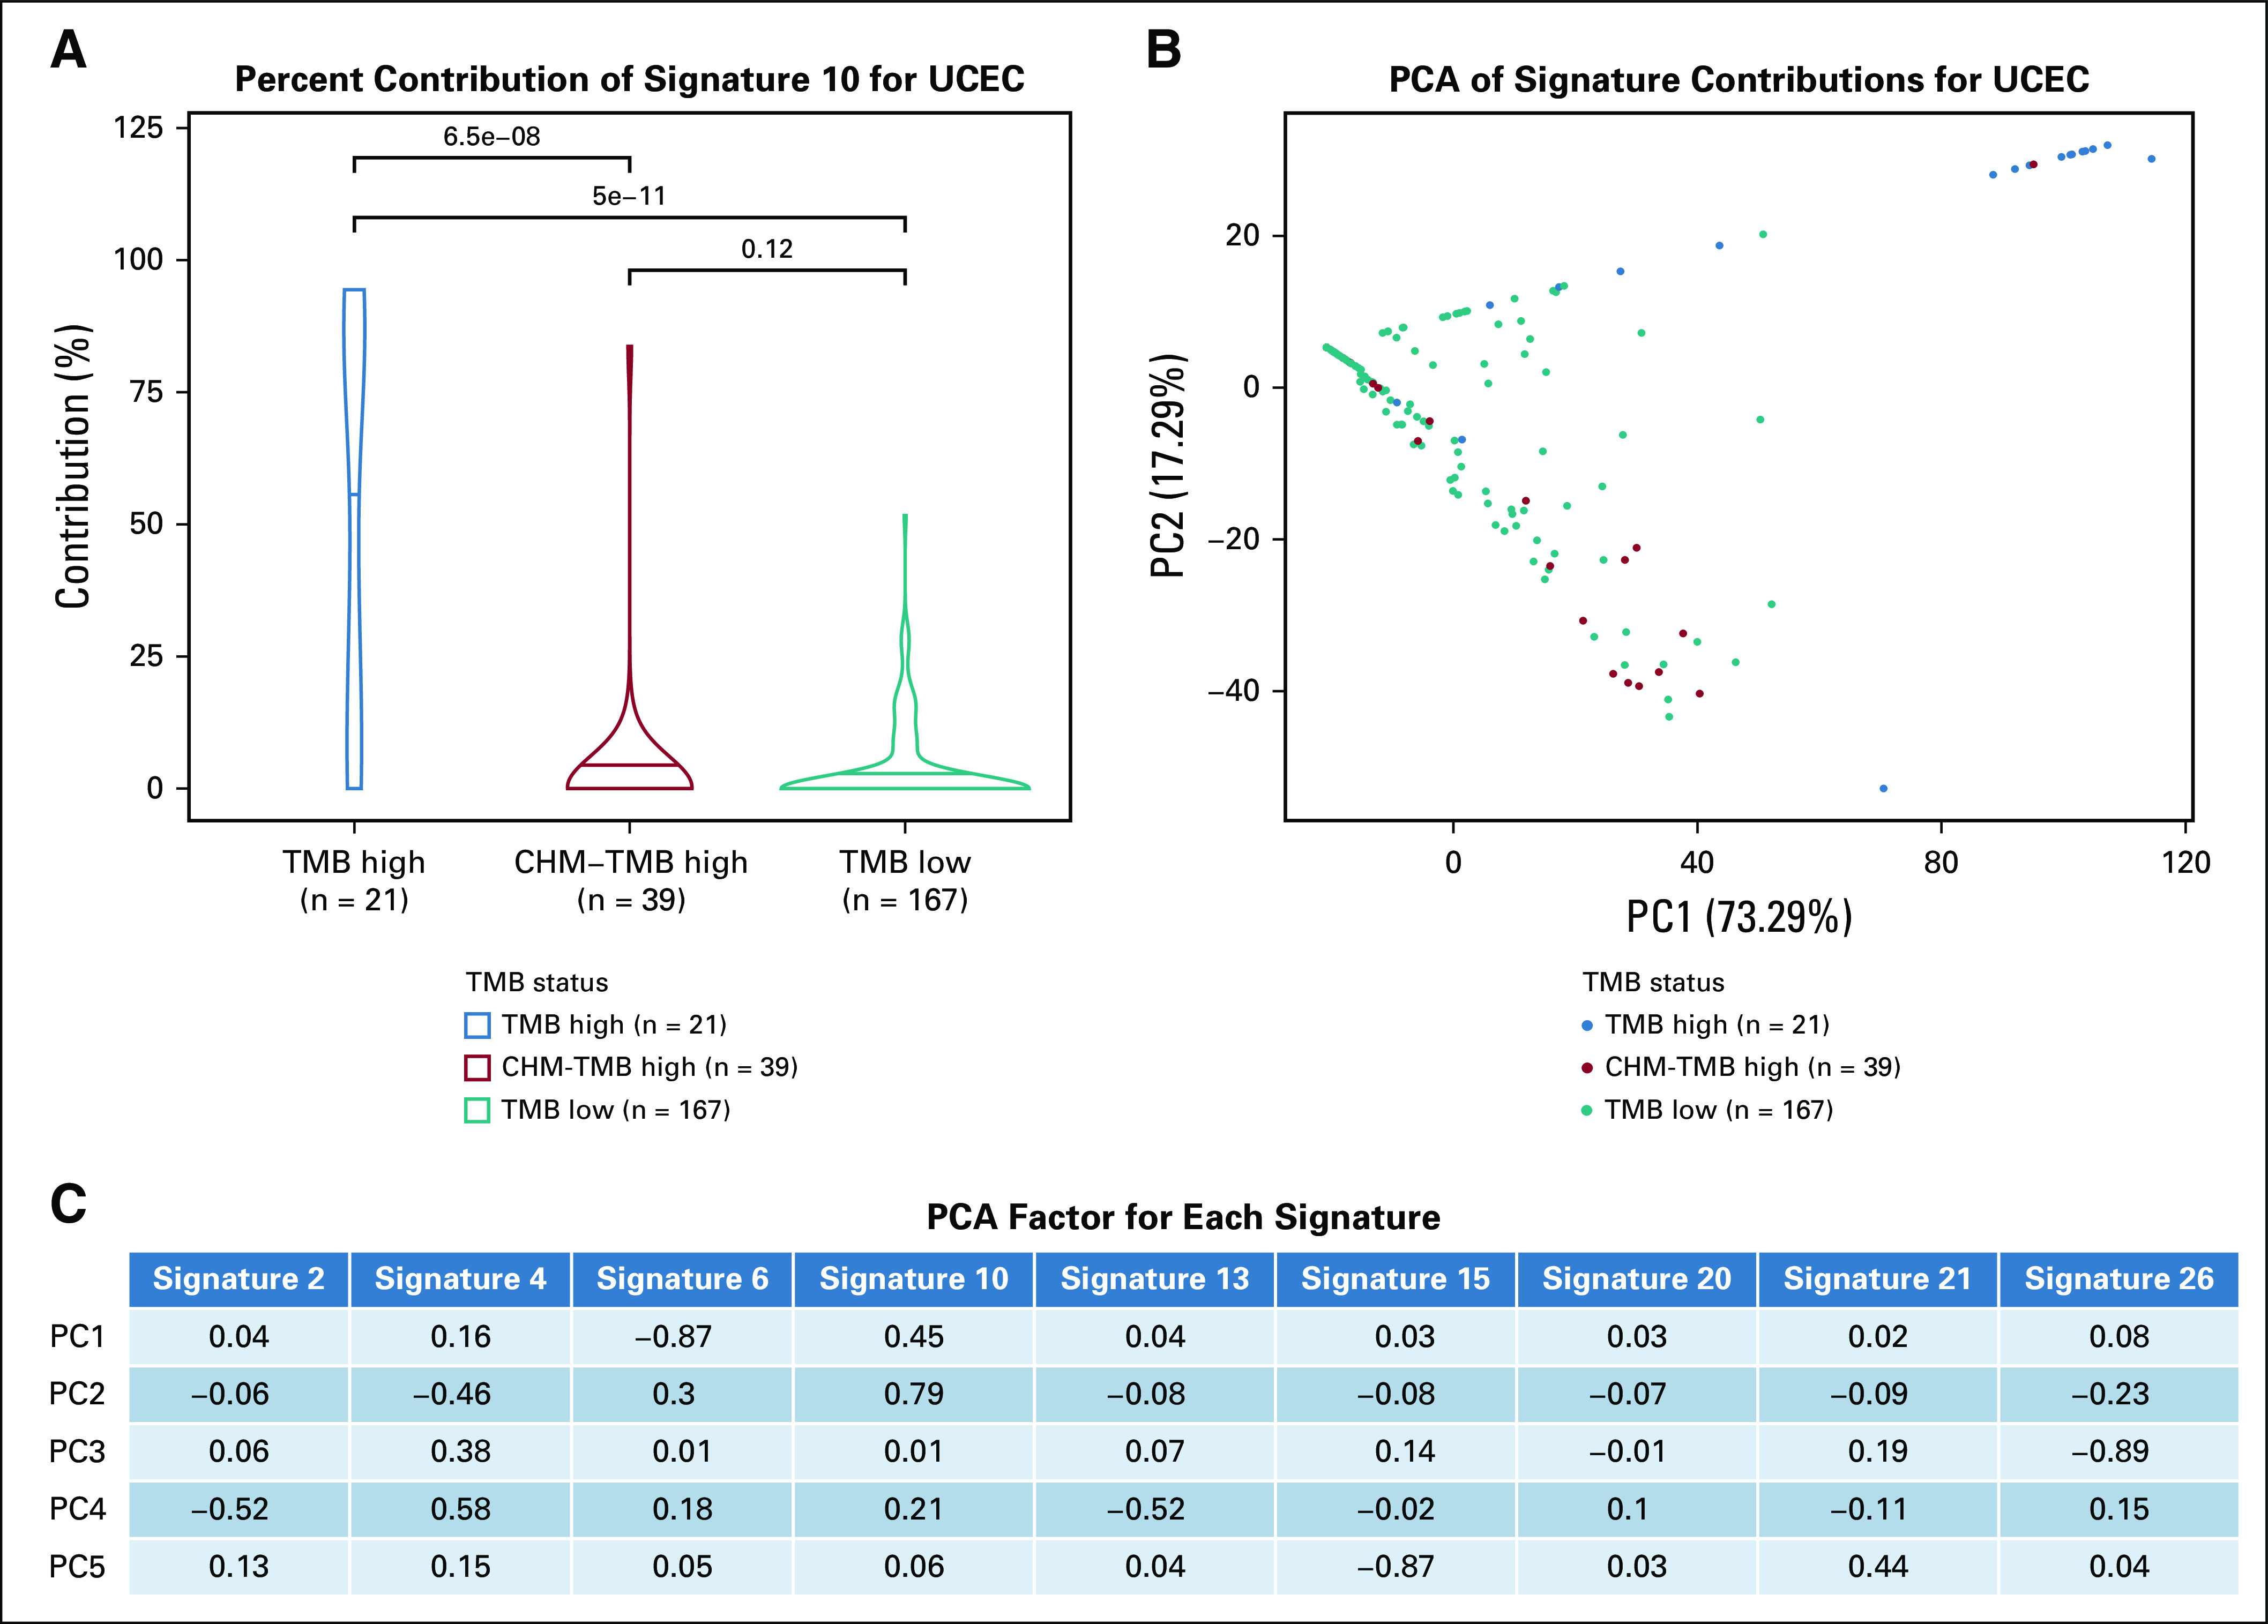
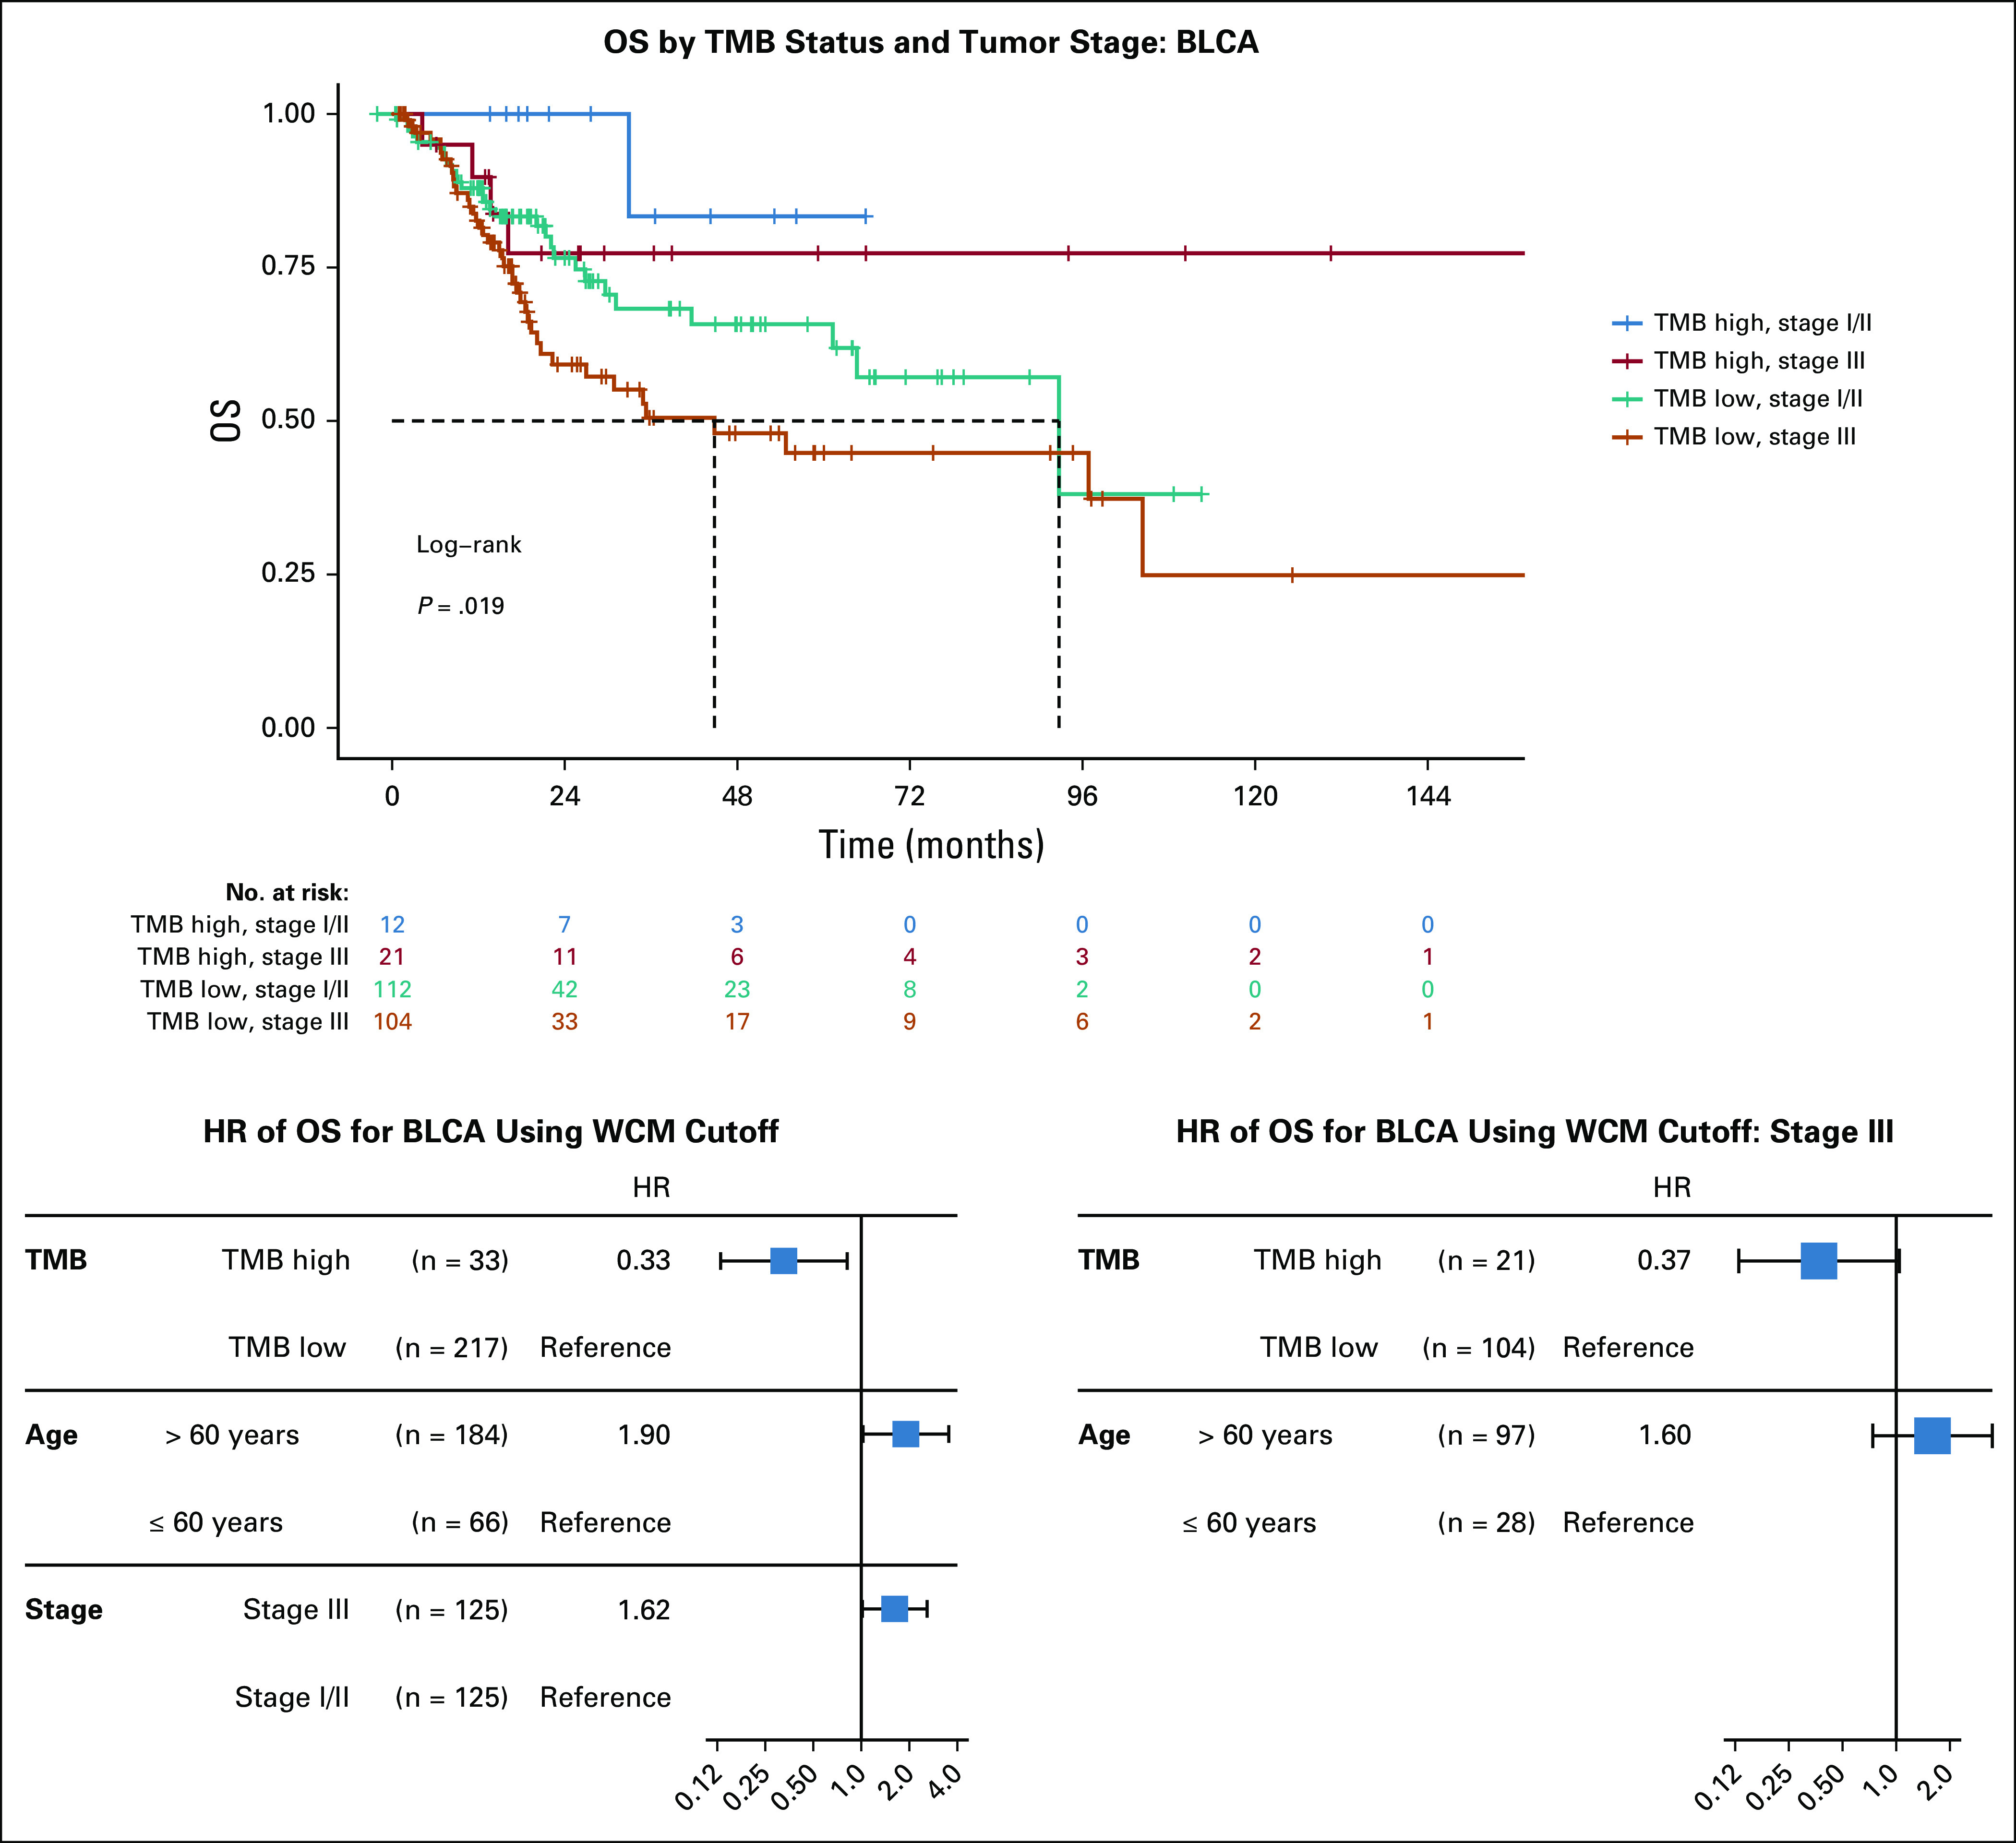
Results: The distribution of TMB varied dramatically between cancer types. A cancer-specific threshold was able to adjust for the different TMB distributions, while the pan-cancer threshold was often too stringent. The dynamic nature of the cancer-specific threshold resulted in more tumors being classified as TMB high compared to the static pan-cancer threshold. Additionally, no significant difference in survival outcomes was found with the cancer-specific threshold compared to the pan-cancer one. Further, the cancer-specific threshold maintains higher predicted neoantigen load for the TMB high samples compared to the TMB low samples, even when the threshold is lower than the pan-cancer threshold.

Conclusion: TMB is relative to the context of cancer type, metastatic state, and disease stage. Compared to a pan-cancer threshold, a cancer-specific threshold classifies more patients as TMB high while maintaining clinical outcomes that were not significantly different. Furthermore, the cancer-specific threshold identifies patients with a high number of predicted neoantigens. Due to the potential impact in cancer patient care, TMB status should be determined in a cancer-specific manner.


Conflict of interest statement

The following represents disclosure information provided by authors of this manuscript. All relationships are considered compensated. Relationships are self-held unless noted. I = Immediate Family Member, Inst = My Institution. Relationships may not relate to the subject matter of this manuscript. For more information about ASCO's conflict of interest policy, please refer to www.asco.org/rwc or ascopubs.org/po/author-center.

Evan M. Fernandez

Employment: Celgene

Travel, Accommodations, Expenses: Foundation Medicine

Himisha Beltran

Consulting or Advisory Role: Janssen Oncology, Genzyme, GlaxoSmithKline, AbbVie, Astellas Pharma, AstraZeneca

Research Funding: Janssen (Inst), AbbVie/Stemcentrx (Inst), Eli Lilly (Inst)

Travel, Accommodations, Expenses: Janssen Oncology

Bishoy M. Faltas

Honoraria: Digital Science Press publications

Research Funding: Eli Lilly

Juan Miguel Mosquera

Research Funding: Personal Genome Diagnostics

Travel, Accommodations, Expenses: Personal Genome Diagnostics

David M. Nanus

Consulting or Advisory Role: Roche/Genentech

Research Funding: Novartis (Inst), Boehringer Ingelheim (Inst), Zenith Epigenetics (Inst)

Brian D. Robinson

Patents, Royalties, Other Intellectual Property: Methods for diagnosing and treating prostate cancer

Mark A. Rubin

Honoraria: F. Hoffmann La Roche AG, Novartis, Astellas Pharma

Research Funding: Eli Lilly, Janssen, Millenium Pharmaceuticals, Sanofi

Patents, Royalties, Other Intellectual Property: US Patent (7,767,393 and 7,229,774), Expression Profile of Prostate Cancer, 2007; US Patent (7,332,290), Detection of AMACR Cancer Markers in Urine, 2008; US Patent (7,718,369), Recurrent Gene Fusions in Prostate Cancer, 2010; US Patent (7,803,552 and 7,666,595), Biomarkers for Predicting Prostate Cancer Progression, 2010; US Patent (7,981,609 B2), Methods for Identifying and Using SNP Panels, 2011; US Patent (8,106,037 B2), Identification and Treatment of Estrogen Responsive PCa, 2012; US Patent (9,090,899 B2), Methods of Diagnosing and Treating Prostate Cancer Characterized by NDRG1-ERG Fusion, 2015; US Patent (9,458,213 B2), Compositions and Methods for Diagnosing Prostate Cancer Based on Detection of SLC45A3-ELK4 Fusion Transcript, 2016; US Patent (9,568,483 B2), Molecular Subtyping, Prognosis and Treatment of Prostate Cancer, 2017; US Patent (9,678,077 B2), ERG/TFF3/HMWCK Triple Immunostain for Detection of Prostate Cancer, 2017; US Patent (61,408,341), Exploration of Novel Gene Fusion in Prostate Cancer by RNA-Seq

Travel, Accommodations, Expenses: F. Hoffmann La Roche AG, Novartis, Astellas Pharma

Olivier Elemento

Stock and Other Ownership Interests: Volastra, Owkin, One Three Biotech

Manish A. Shah

Consulting or Advisory Role: Astellas Pharma, Eli Lilly Japan

Research Funding: Gilead Sciences (Inst), Merck (Inst), Boston Biomedical (Inst), Oncolys BioPharma (Inst), Bristol-Myers Squibb (Inst)

Wei Song

Employment: Genentech (I)

Employment: Cytokinetics (I)

Honoraria: Foundation Medicine, Loxo

Consulting or Advisory Role: Foundation Medicine, Loxo

No other potential conflicts of interest were reported.

Figures

FIG 1.
FIG 1.
Tumor mutational burden (TMB) varies among cancer types. (A) Distribution of TMB for The Cancer Genome Atlas (TCGA) and (B) Weill Cornell Medicine (WCM) Advanced. Different TMB-high classification thresholds are shown. The Chalmers et al threshold (blue line) is applied pan-cancer, and the WCM threshold (red diamond) is applied per cancer. The bottom of the box represents the 25th percentile, and the top of the box represents the 75th percentile. Each point represents a patient. BLCA, bladder urothelial carcinoma; BRCA, breast invasive carcinoma; COAD, colon adenocarcinoma; GBM, glioblastoma multiforme; KICH, kidney chromophobe; KIRC, kidney renal clear cell carcinoma; LGG, brain lower grade glioma; LUAD, lung adenocarcinoma; LUSC, lung squamous cell carcinoma; OV, ovarian serous cystadenocarcinoma; PRAD, prostate adenocarcinoma; READ, rectum adenocarcinoma; THCA, thyroid carcinoma; UCEC, uterine corpus endometrial carcinoma.
FIG 2.
FIG 2.
Survival curves for bladder urothelial carcinoma (BLCA) and kidney renal clear cell carcinoma (KIRC) stratified by tumor mutational burden (TMB) status. (A) Visual breakdown of the three different TMB groups. Kaplan-Meier survival curves comparing the TMB classifications between the Weill Cornell Medicine (WCM) threshold and the Chalmers et al threshold for (B) BLCA and (C) KIRC. For BLCA, the difference between TMB high (blue) and TMB low (teal) is significant (log-rank P value = .007). However, the difference between the TMB-high and the WCM-TMB–high (red) curves is not significant (log-rank P value = .60), and the difference between WCM-TMB–high and the TMB-low curves is also not significant (log-rank P value = .072). For KIRC, the Chalmers et al threshold was too high to classify any samples as TMB high, resulting in only two groups: WCM-TMB high and TMB low. The WCM-TMB–high group has significantly worse prognosis than does the TMB-low group (log-rank P value = .0027). (D) Time-dependent receiver operating characteristic (ROC) curve comparing the true positive (TPR) and false positive (FPR) rates for BLCA using both the Chalmers et al threshold and the WCM threshold shows the area under the curve (AUC) for both cutoffs at 5 years from diagnosis. The AUC for WCM is 0.568, whereas the AUC for Chalmers is 0.502. OS, overall survival.
FIG 3.
FIG 3.
Overview of tumor mutational burden (TMB) classifications for The Cancer Genome Atlas (TCGA). (A) Hazard ratios (HRs) determined by Cox regression for TMB predicting survival for each TCGA cancer type are shown. Significance is determined by a 95% CI and is shown by the boxplot. (*) Significantly increased cancer on the basis of a χ2 test with Yates’ continuity correction (P value < .05). (B) Fold change in TMB-high classifications is shown. The dotted line is at a fold change of 1 (no change). Prostate adenocarcinoma (PRAD) and kidney renal clear cell carcinoma (KIRC) are excluded from the plot because the Chalmers et al threshold did not classify any samples as TMB high. Blue bars represent cancer types with a higher or equal number of TMB-high classifications for the Weill Cornell Medicine (WCM) threshold than the Chalmers et al threshold. Red bar represents a cancer type with a higher number of TMB-high classifications according to Chalmers et al compared with WCM. (†) Statistically significant HRs. BLCA, bladder urothelial carcinoma; BRCA, breast invasive carcinoma; COAD, colon adenocarcinoma; GBM, glioblastoma multiforme; KICH, kidney chromophobe; LGG, brain lower grade glioma; LUAD, lung adenocarcinoma; LUSC, lung squamous cell carcinoma; OS, overall survival; OV, ovarian serous cystadenocarcinoma; READ, rectum adenocarcinoma; THCA, thyroid carcinoma; UCEC, uterine corpus endometrial carcinoma.
FIG 4.
FIG 4.
No. of predicted neoantigens differs between tumor mutational burden (TMB) status. Distribution of predicted neoantigens for TMB high (blue), TMB high Weill Cornell Medicine (WCM; red), and TMB low (teal) for The Cancer Genome Atlas (TCGA) shown for (A) all cancers pooled together, (B) lung adenocarcinoma (LUAD), and (C) bladder urothelial carcinoma (BLCA). Values shown above bars are Wilcoxon P values.
FIG 5.
FIG 5.
Signature contributions for uterine corpus endometrial carcinoma (UCEC) show that samples cluster by signature 10. (A) Violin plots showing the distribution of the contribution of signature 10 (defective polymerase-ε) in tumor mutational burden (TMB) high, Chalmers (CHM)-TMB high, and TMB low. The mean contribution is significantly different between TMB high and TMB low (Wilcoxon P value = 5e-11), and between TMB high and CHM-TMB high (Wilcoxon P value = 6.5e-8). (B) PCA showing the signature contributions for uterine corpus endemetrial carcinoma (UCEC) with TMB-high samples in blue, WCM-TMB–high samples in red, and TMB-low samples in teal. Only signatures 2, 4, 6, 10, 13, 15, 20, 21, and 26 were considered, to focus on signatures with the most relevant interpretations. (C) The calculated PCA factor loadings are also shown for each signature in the first five principal components. Signature 6 (defective DNA mismatch repair) has the largest factors for principal component 1 (PC1), although it is negative. PCA, principal component analysis; PC2, principal component 2.
FIG 6.
FIG 6.
Effect of stage and age with tumor mutational burden (TMB) for bladder urothelial carcinoma (BLCA) in The Cancer Genome Atlas. Kaplan-Meier survival curves for BLCA stratified into both TMB status and disease stage. Cox regression results are also shown for significant predictors, as well as TMB status and age in stage III patients. HR, hazard ratio; OS, overall survival; WCM, Weill Cornell Medicine.

References

    1. Topalian SL, Weiner GJ, Pardoll DM. Cancer immunotherapy comes of age. J Clin Oncol. 2011;29:4828–4836. - PMC - PubMed
    1. Topalian SL, Hodi FS, Brahmer JR, et al. Safety, activity, and immune correlates of anti-PD-1 antibody in cancer. N Engl J Med. 2012;366:2443–2454. - PMC - PubMed
    1. Tray N, Weber JS, Adams S. Predictive biomarkers for checkpoint immunotherapy: Current status and challenges for clinical application. Cancer Immunol Res. 2018;6:1122–1128. - PubMed
    1. Chalmers ZR, Connelly CF, Fabrizio D, et al. Analysis of 100,000 human cancer genomes reveals the landscape of tumor mutational burden. Genome Med. 2017;9:34. - PMC - PubMed
    1. Zehir A, Benayed R, Shah RH, et al. Mutational landscape of metastatic cancer revealed from prospective clinical sequencing of 10,000 patients. Nat Med. 2017;23:703–713. - PMC - PubMed