

CENP-C unwraps the human CENP-A nucleosome through the H2A C-terminal tail
- PMID: 31475439
- PMCID: PMC6776904
- DOI: 10.15252/embr.201948913
CENP-C unwraps the human CENP-A nucleosome through the H2A C-terminal tail
Abstract
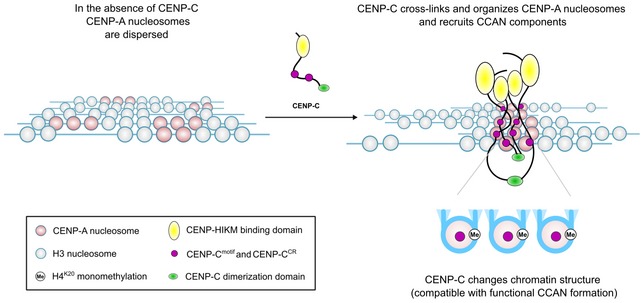
Centromeres are defined epigenetically by nucleosomes containing the histone H3 variant CENP-A, upon which the constitutive centromere-associated network of proteins (CCAN) is built. CENP-C is considered to be a central organizer of the CCAN. We provide new molecular insights into the structure of human CENP-A nucleosomes, in isolation and in complex with the CENP-C central region (CENP-CCR ), the main CENP-A binding module of human CENP-C. We establish that the short αN helix of CENP-A promotes DNA flexibility at the nucleosome ends, independently of the sequence it wraps. Furthermore, we show that, in vitro, two regions of human CENP-C (CENP-CCR and CENP-Cmotif ) both bind exclusively to the CENP-A nucleosome. We find CENP-CCR to bind with high affinity due to an extended hydrophobic area made up of CENP-AV532 and CENP-AV533 . Importantly, we identify two key conformational changes within the CENP-A nucleosome upon CENP-C binding. First, the loose DNA wrapping of CENP-A nucleosomes is further exacerbated, through destabilization of the H2A C-terminal tail. Second, CENP-CCR rigidifies the N-terminal tail of H4 in the conformation favoring H4K20 monomethylation, essential for a functional centromere.
Keywords: CENP-A; CENP-C; centromere; cryo-EM; nucleosome.
© 2019 The Authors. Published under the terms of the CC BY NC ND 4.0 license.
Conflict of interest statement
The authors declare that they have no conflict of interest.
Figures
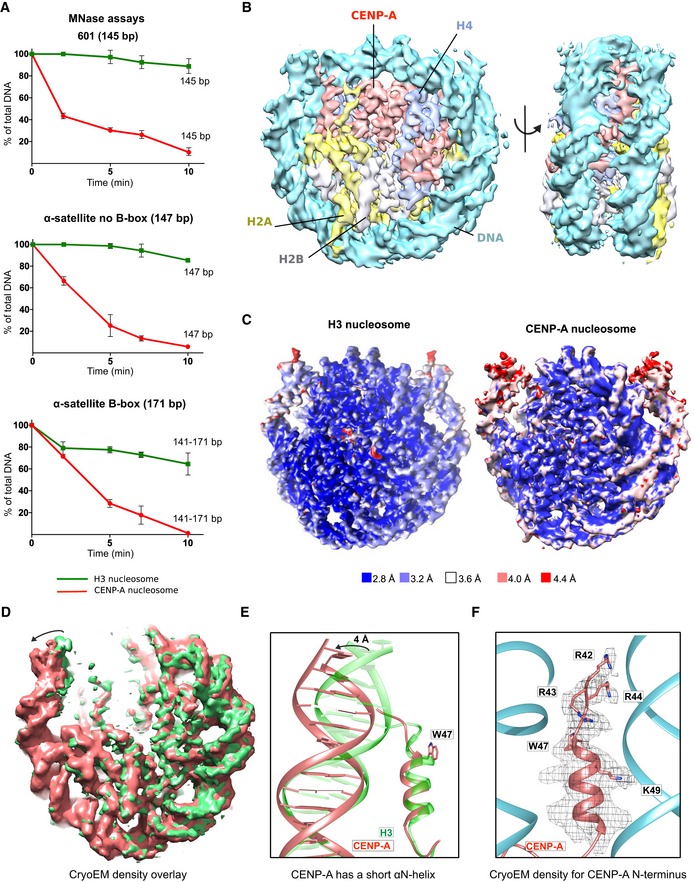
Graphs showing the relative abundance of undigested DNA as a function of time during digestion with micrococcal nuclease (MNase) for three types of DNA wrapped around the CENP‐A nucleosome (red) and the H3 nucleosome (green). For α‐satellite DNA with initial size of 171 bp, size ranges (141–171) corresponding to DNA lengths above NCP (nucleosome core particle) is presented. Data are presented as mean (SD) for each time point based on three independent experiments. Corresponding virtual gels from Bioanalyzer are in Fig EV1A.
Cryo‐EM density map of the human CENP‐A nucleosome, color‐coded for histones and DNA.
Cryo‐EM maps of the H3 nucleosome (PDB 6ESF) and the CENP‐A nucleosome, colored based on local resolution.
Overlay of cryo‐EM maps of the H3 nucleosome (green; PDB 6ESF) and the CENP‐A nucleosome (red). Note shorter and moved density for DNA on the CENP‐A nucleosome indicated by the arrow.
Overlay of the N‐terminal tail of CENP‐A (red) and H3 (green; PDB 6ESF), illustrating shorter αN helix of CENP‐A (obstructed by the presence of bulky CENP‐AW47) and terminal nucleosomal DNA moved by 4 Å.
The N‐terminal tail of CENP‐A (red) makes contacts with the DNA (cyan) at the entry/exit sites.
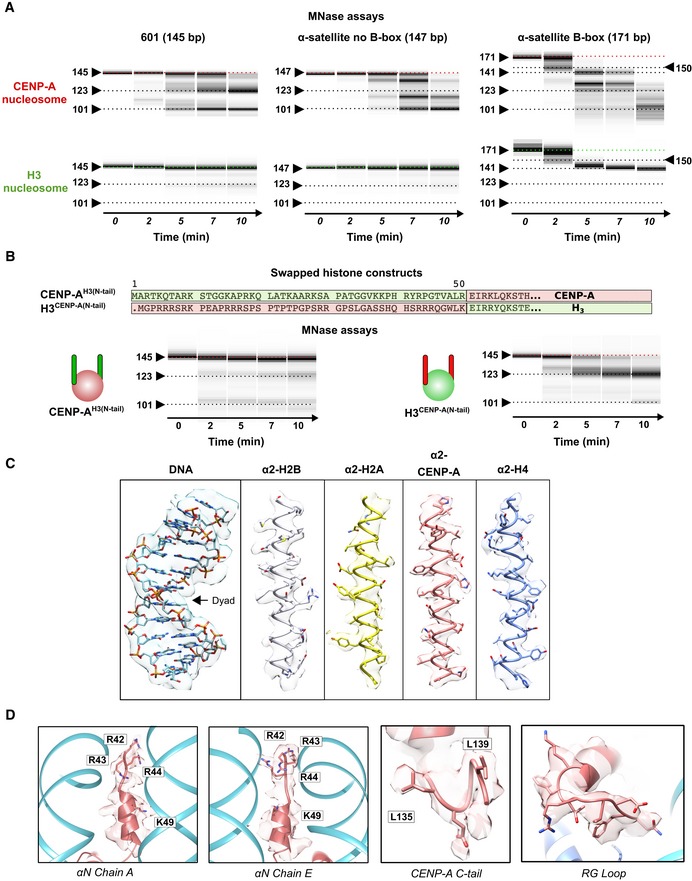
Virtual gels from Bioanalyzer showing DNA digestion for CENP‐A and H3 nucleosomes on three different DNA templates.
(Top) Sequence overlay of the N‐terminus of H3 and CENP‐A, indicating swapped sequences used in CENP‐AH3(N‐tail) and H3CENP‐A(N‐tail) constructs. (Bottom) Virtual gels of MNase digestion for CENP‐AH3(N‐tail) and H3CENP‐A(N‐tail) nucleosomes assembled on 601 DNA.
Representative cryo‐EM map of the CENP‐A nucleosome, illustrating quality of map and model fitting.
EM density of CENP‐A‐specific features on the nucleosome: αN helix (2 different sides), C‐terminal tail and RG‐loop.
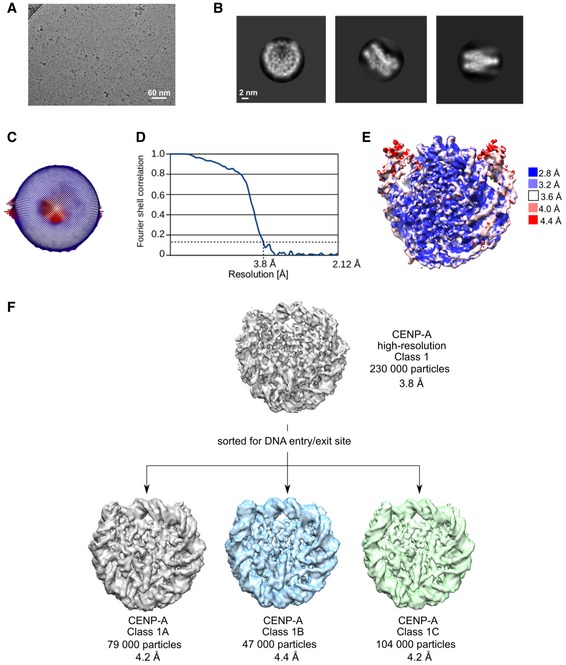
Representative cryo‐EM raw micrograph.
Subset of selected 2D class averages.
Euler angle distribution of particles used in the final 3D reconstruction.
Fourier shell correlation (FSC) curves of the final density map (CENP‐A high resolution).
Local resolution of the final 3D density map.
Particles used for the high‐resolution CENP‐A map were further classified for DNA entry/exit site in order to highlight differences at this part of the nucleosome. Gray map (Class 1A) has loosest DNA wrap, and green map (Class 1C) has tightest DNA wrap. The blue map represents particles that were in‐between two extreme conformations.
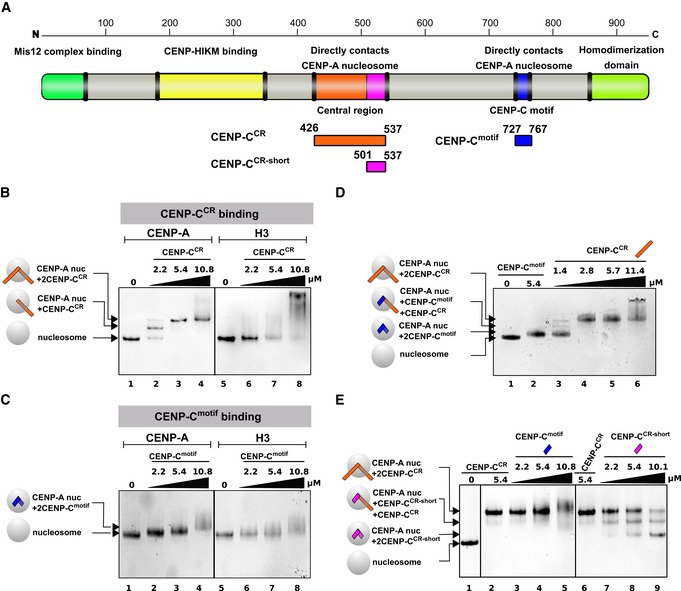
Schematic diagram of the full‐length CENP‐C protein, indicating parts involved in interactions with other proteins or homo‐dimerization. Constructs used in this study are depicted below the diagram.
Native PAGE gel stained with Coomassie blue showing complexes formed between CENP‐A or H3 nucleosome and CENP‐CCR. Lane 1: CENP‐A nucleosome, Lanes 2–4: Increasing amounts of CENP‐CCR are added to CENP‐A nucleosome. Generation of a sharp band with slower mobility indicates formation of a specific CENP‐A/CENP‐CCR complex. Lane 5: H3 nucleosome. Lanes 6–8: Increasing amounts of CENP‐CCR are added to H3 nucleosome. Smear on the gel indicates formation of non‐specific H3/CENP‐CCR complexes.
Same experiment as in (B) using CENP‐Cmotif. Lane 1: CENP‐A nucleosome. Lanes 2–4: Increasing amounts of CENP‐Cmotif are added to CENP‐A nucleosome. Upon binding CENP‐Cmotif, CENP‐A nucleosome migrates slower through the gel. Note only modest change in mobility due to small size of CENP‐Cmotif, comparing to CENP‐CCR in (B). Lane 5: H3 nucleosome. Lanes 6–8: Increasing amounts of CENP‐Cmotif are added to H3 nucleosome. Smear on the gel indicates formation of non‐specific H3/CENP‐Cmotif complexes.
Native gel showing CENP‐CCR competing out CENP‐Cmotif bound to CENP‐A nucleosome. Lane 1: CENP‐A nucleosome. Lane 2: CENP‐A/CENP‐Cmotif complex. Lane 3–6: Increasing amounts of CENP‐CCR are added to the pre‐formed CENP‐A/CENP‐Cmotif complex. Formation of slower migrating bands indicates that longer CENP‐CCR is replacing shorter CENP‐Cmotif bound to the CENP‐A nucleosome.
Native gel showing the inability of CENP‐Cmotif to compete out CENP‐CCR bound to CENP‐A nucleosome. Lane 1: CENP‐A nucleosome. Lanes 2 and 6: CENP‐CCR/CENP‐A nucleosome complex. Lanes 3–5: Increasing amounts of CENP‐Cmotif are added to the pre‐formed CENP‐A/CENP‐CCR complex. Formation of smear at high amounts of CENP‐Cmotif added indicates that CENP‐Cmotif, at high concentrations, non‐specifically binds CENP‐A/CENP‐CCR complex rather than replacing bound CENP‐CCR. Lanes 7–9: Increasing amounts of CENP‐CCR‐short are added to the pre‐formed CENP‐A/CENP‐CCR complex. Formation of bands with higher mobility indicates that smaller CENP‐CCR‐short is effectively replacing bigger CENP‐CCR bound to CENP‐A nucleosome.
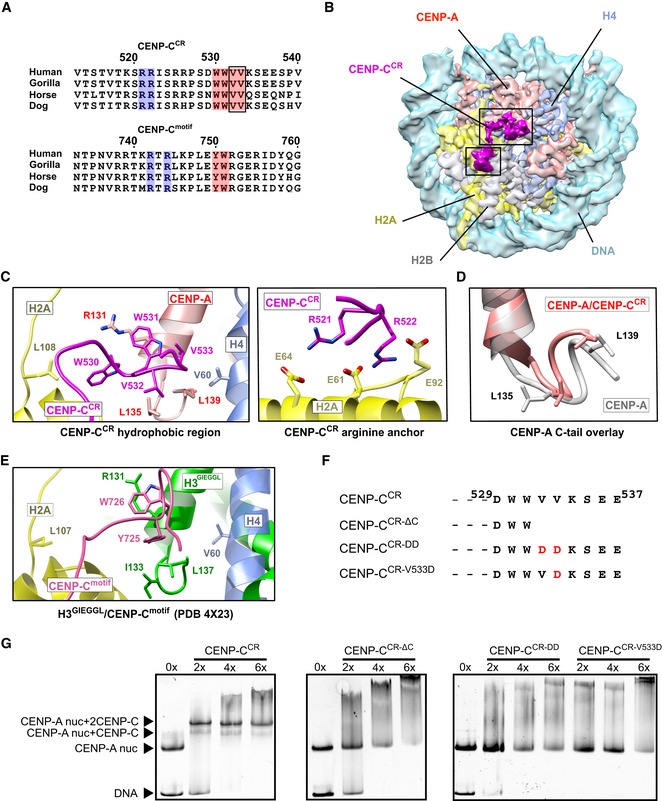
Sequence alignment of CENP‐CCR and CENP‐Cmotif regions from different mammals. Conserved residues involved in CENP‐A binding are highlighted in blue (electrostatic interactions) and pink (hydrophobic interactions). Residues identified in this study to contribute higher affinity of CENP‐CCR comparing to CENP‐Cmotif are boxed.
Cryo‐EM density map of the human CENP‐A nucleosome, color‐coded for histones, in complex with CENP‐CCR (magenta). CENP‐CCR binds CENP‐A nucleosome through hydrophobic region (big box) and arginine anchor (small box). Interacting residues in each of the regions are shown in (C).
Ribbon diagram showing interactions of the CENP‐CCR hydrophobic region (left) and CENP‐CCR arginine anchor (right) with the CENP‐A nucleosome.
Overlay of the CENP‐A C‐terminal tail before (gray) and after (red) binding of CENP‐CCR.
Interactions between H3‐GIEGGL and rat CENP‐Cmotif as observed in PDB 4X23 14.
Schematic diagram of mutated CENP‐CCR sequences used to test importance of CENP‐CV532 and CENP‐CV533 for generation of CENP‐A/CENP‐CCR complexes.
Native gels showing the impaired ability of mutated CENP‐CCR to form complexes with the CENP‐A nucleosome. The molar ratio of CENP‐CCR/CENP‐A nucleosomes is shown above each lane.
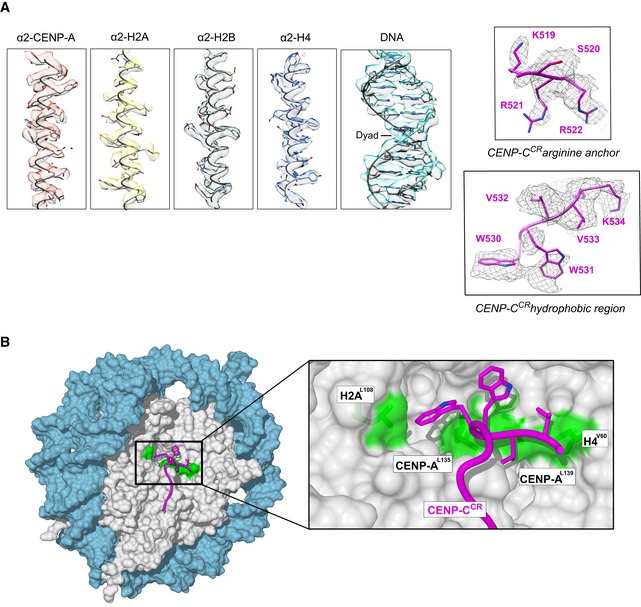
Representative cryo‐EM densities showing fitted model for DNA and each of the histones (left), arginine anchor, and hydrophobic regions of CENP‐CCR (right).
Surface representation of nucleosome (histone core—gray, DNA—blue), showing a hydrophobic groove (green) on the nucleosome formed by H2AL108, CENP‐AL135, CENP‐AL139, and H4V60. CENP‐CCR is shown as a purple coil with hydrophobic sidechains in stick representation.
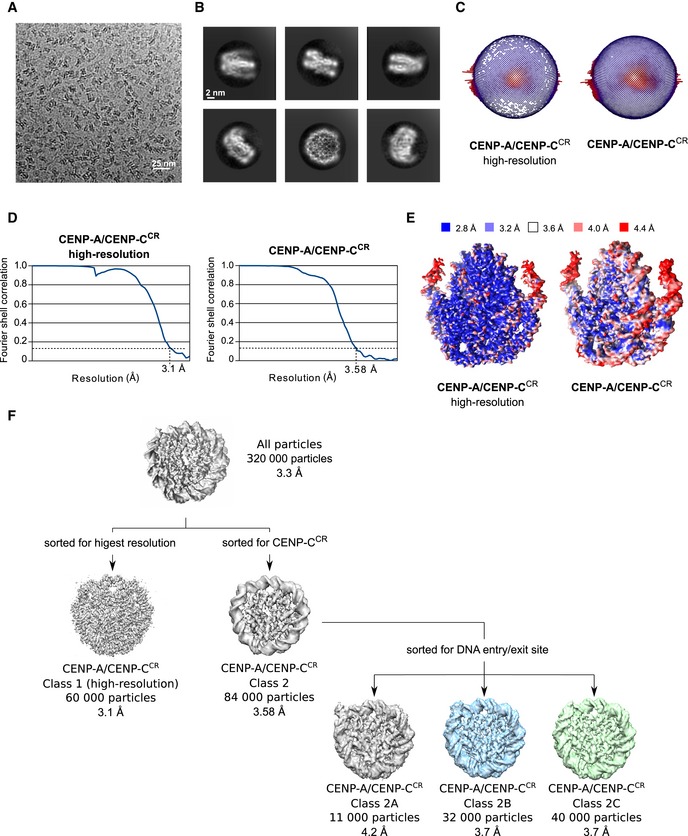
Representative cryo‐EM raw micrograph.
Subset of selected 2D class averages.
Euler angle distribution of particles used in the final 3D reconstruction for CENP‐A/CENP‐CCR high resolution and CENP‐A/CENP‐CCR complex enriched for CENP‐CCR.
Fourier shell correlation (FSC) curves of the final density map for CENP‐A/CENP‐CCR high resolution and CENP‐A/CENP‐CCR enriched for CENP‐CCR.
Local resolution of the final 3D density maps.
First, particles were sorted for high resolution, and this map was used for initial model building. A map enriched in CENP‐CCR was generated to increase map quality around CENP‐CCR. Particles used for the later map were further classified for DNA entry/exit site in order to highlight extend of DNA unwrapping. The gray map (Class 2A) has the loosest DNA wrap, and the green map (Class 2C) has tightest DNA wrap. The blue map presents particles that were in‐between two extreme conformations.
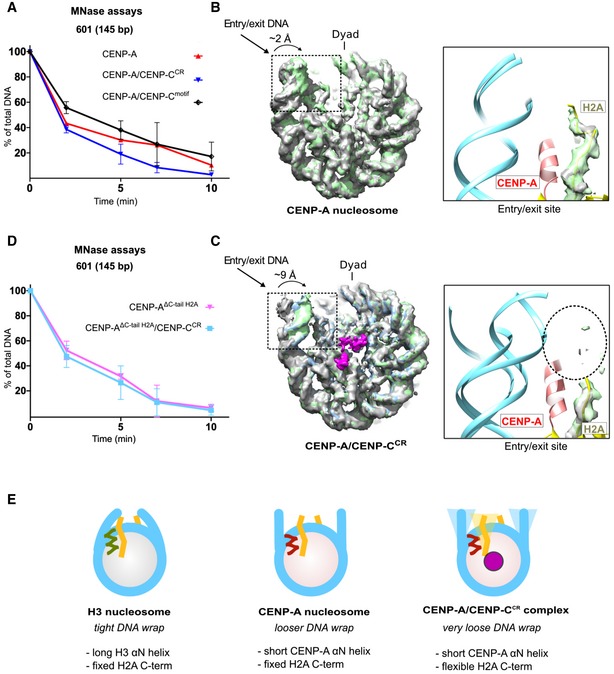
Graph showing the relative abundance of undigested DNA (145 bp) as a function of time during digestion with micrococcal nuclease (MNase) for the CENP‐A nucleosome (red), the CENP‐A/CENP‐CCR complex (blue), and the CENP‐A/CENP‐Cmotif complex (black).
Overlay of three cryo‐EM maps (gray, blue, and green) of the CENP‐A nucleosome obtained by sorting on the DNA entry/exit site (Fig EV2F). Distance between most open (gray) and most closed (green) map is 2 Å. The entry/exit site is boxed, and the corresponding model is shown on the right. Note that the density of the H2A C‐terminus is well defined.
Overlay of three cryo‐EM maps (gray, blue, and green) of the CENP‐A/CENP‐CCR complex obtained by sorting on the DNA entry/exit site (Fig EV4F). The distance between the most open (gray) and most closed (green) maps is 9 Å. Map assigned to CENP‐CCR is shown in magenta. The entry/exit site is boxed, and the corresponding model is shown on the right. Note the absence of a clearly defined density of the H2A C‐tail (indicated by the dotted circle).
Same type of data as in (A) for the CENP‐A nucleosome assembled with tailless H2A (H2A, 1–109) alone (pink) and in complex with CENP‐CCR (light blue).
Schematic representation of the interplay between the N‐terminus of H3 or CENP‐A and the C‐terminus of H2A in regulating flexibility of nucleosomal DNA wrap. DNA (cyan); longer H3 αN (green); shorter CENP‐A αN (red); H2A C‐terminus (yellow); CENP‐C (magenta).
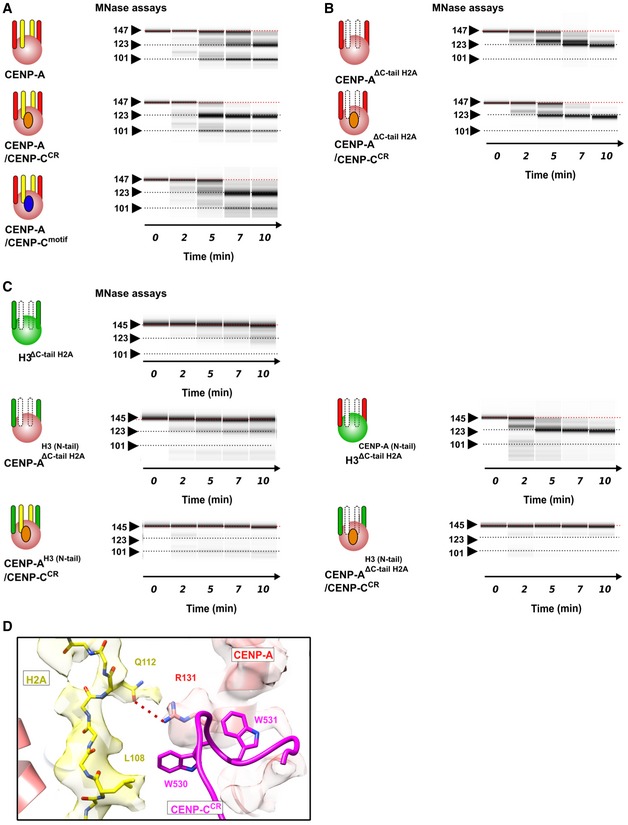
- A–C
Virtual gels for MNase digestion. CENP‐A nucleosomes are pink, and H3 nucleosomes are green balls. CENP‐A N‐terminal tail (aa 1–49) is red stick, H3 N‐terminal tail (aa 1–50) is green stick, H2A C‐terminal tail (aa 110–130) is yellow stick, CENP‐CCR is orange circle, and CENP‐Cmotif is blue circle. Deleted H2A C‐terminal tail is indicated as dotted white stick. (A) MNase digestion of the CENP‐A nucleosome alone and in complex with CENP‐CCR or CENP‐Cmotif (also in Fig 4A). (B) MNase digestion of the CENP‐A nucleosome assembled with H2A lacking 110–130 residues, alone (top) or in complex with CENP‐CCR (bottom), showing similar magnitude of digestion. (C) (Top) MNase digestion of the H3ΔC‐tail H2A, indicating that removal of H2A110–130 does not have an effect on the DNA digestion speed in the context of H3 nucleosome. (Middle) MNase digestion of CENP‐AH3(N‐tail), ΔC‐tail H2A and H3CENP‐A(N‐tail), ΔC‐tail H2A, indicating that removal of H2A110–130 does not have an effect on the DNA digestion speed in the context of CENP‐AH3(N‐tail) nucleosome, but digestion is slightly increased in the context of H3CENP‐A(N‐tail). (Bottom) MNase digestion of the CENP‐AH3(N‐tail) is unaffected with CENP‐CCR binding independently of the presence of H2A110–130.
- D
Interactions between H2A C‐terminal tail and CENP‐CCR.
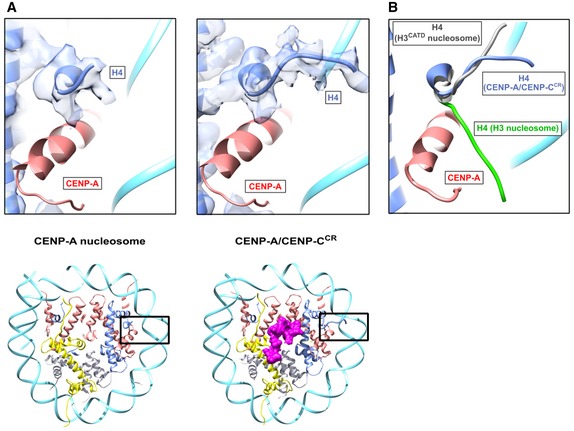
Structure of the H4 N‐terminal tail with corresponding cryo‐EM density in the CENP‐A nucleosome (left) and CENP‐A/CENP‐CCR complex (right). Position of the H4 N‐terminal tail within the nucleosome is boxed on ribbon diagram below. Histones and DNA are color‐coded as in Fig 1, and cryo‐EM density assigned to CENP‐C is shown in magenta.
Overlay of the H4 N‐tail from the CENP‐A/CENP‐CCR complex (blue) with the H4 N‐terminus from the H3 nucleosome (green; PDB 6ESF) and H3CATD nucleosome (gray; PDB 5Z23).
References
Publication types
MeSH terms
Substances
Associated data
- Actions
- Actions
- Actions
- Actions
- Actions
Grants and funding
LinkOut - more resources
Full Text Sources
