. 2019 Oct:113:103382.
doi: 10.1016/j.compbiomed.2019.103382. Epub 2019 Aug 6.

4D cardiac electromechanical activation imaging

Affiliations

4D cardiac electromechanical activation imaging

Julien Grondin et al. Comput Biol Med. 2019 Oct.

Abstract

Cardiac abnormalities, a major cause of morbidity and mortality, affect millions of people worldwide. Despite the urgent clinical need for early diagnosis, there is currently no noninvasive technique that can infer to the electrical function of the whole heart in 3D and thereby localize abnormalities at the point of care. Here we present a new method for noninvasive 4D mapping of the cardiac electromechanical activity in a single heartbeat for heart disease characterization such as arrhythmia and infarction. Our novel technique captures the 3D activation wave of the heart in vivo using high volume-rate (500 volumes per second) ultrasound with a 32 × 32 matrix array. Electromechanical activation maps are first presented in a normal and infarcted cardiac model in silico and in canine heart during pacing and re-entrant ventricular tachycardia in vivo. Noninvasive 4D electromechanical activation mapping in a healthy volunteer and a heart failure patient are also determined. The technique described herein allows for direct, simultaneous and noninvasive visualization of electromechanical activation in 3D, which provides complementary information on myocardial viability and/or abnormality to clinical imaging.

Keywords: 3D activation mapping; 3D ultrasound; Cardiac activation mapping; Cardiac arrhythmia; Electromechanical wave imaging; High frame rate ultrasound.


Figures

Fig. 1:
Fig. 1:
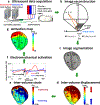
Flowchart of electromechanical wave imaging. Ultrasound data acquisition is performed with a 2D array connected to two Verasonics ultrasound scanners via a 2:1 multiplexer (a). High volume-rate imaging is performed with the transmission of a spherical wavefront and 3D image reconstruction is performed using a standard delay-and-sum method (b). The myocardium is manually segmented (c). Inter-volume axial displacements are estimated using 1-D normalized cross-correlation of the beamformed radiofrequency ultrasound signals (d). Positive displacements (red) indicate motion towards the transducer (at the apex) and negative displacements (blue) indicate motion away from the transducer. Inter-volume axial strains are estimated using a least-squares estimator (e). Positive strains (red) are associated with longitudinal lengthening and negative strains (blue) are associated with longitudinal shortening. Local onset of contraction is determined by the first positive to negative zero-crossing of the temporal axial strain curve after a reference time point, here the onset of the P wave (f). The electromechanical activation map is obtained by determining the onset of contraction in each region of the myocardium (g). LA: left atrium, RA: right atrium, RV: right ventricle, LV: left ventricle
Fig. 2:
Fig. 2:
Illustration of the segmentation in the elevational direction. The myocardium is first segmented from a 2D B-mode (delineation in white color). Then, for every depth, the center of the left side of the heart (ventricle or atria) is determined (red cross). Elevational segmentation is performed by assuming circular shape (blue circles) of the left ventricle (LV) and ellipsoidal shape (green ellipsoid) of the right ventricle (RV). LA: left atrium, RA: right atrium
Fig. 3:
Fig. 3:
Automatic detection of positive to negative zero-crossings (green dot) and electromechanical activation times (black dotted line) in a healthy canine heart. Examples of inter-volume axial strain curves and activation time detection at a given location in the atria (a,b) and the ventricles (c,d). The first significant positive to negative zero-crossing in the search window is defined as to the electromechanical activation time. Semi-automatically and manually detected activation times were well correlated (e).
Fig. 4:
Fig. 4:
Simulated electromechanical wave imaging. Snapshots of the axial strain obtained from benchmark mechanical finite-element simulation in the infarct-free baseline (a) and infarcted (f) hearts and estimated from high frame-rate 4D ultrasound simulation in the infarct-free (c) and infarcted (h) hearts, in the right (RV) and left (LV) ventricles at different time points are shown. The electrical activation times obtained from the electromechanical model in the infarct-free (b) and infarcted (g) hearts as well as the electromechanical activation times obtained from the ultrasound simulation in the infarct-free (d) and infarcted (i) hearts are shown. Good agreement was found between benchmark electrical activation times and estimated electromechanical activation times in both the infarct-free (e) and the infarcted (j) heart models. Infarcted regions (in black), located in the lateral LV and at the apex of the anterior LV were not activated.
Fig. 5:
Fig. 5:
In vivo electromechanical wave imaging during normal sinus rhythm in a canine using 2 ultrasound scanners and a multiplexer (a,b) and in another canine using 4 ultrasound scanners without multiplexer (c,d). Snapshots of the axial strain obtained from 4D high volume-rate ultrasound imaging at different time points (a,c) are shown. The ECG is also shown, with the corresponding time point indicated by a red dot. The electromechanical activation times of the heart are shown (b,d). In both cases, the earliest activation starts in the right atrium (RA), then propagates to the left atrium (LA), and finally to left (LV) and right (RV) ventricles via the interventricular septum. Examples of epicardial, transmural and endocardial regions are indicated with a black arrow (b) to assist with 3D visualization. : earliest site of activation
Fig. 6:
Fig. 6:
In vivo electromechanical wave imaging of a canine during apical pacing. Snapshots of the axial strain obtained from 4D high volume-rate ultrasound imaging at different time points (a-e) are shown. The ECG is also shown, with the corresponding time point indicated by a red dot. A picture of the heart, with the pacing electrode inside the red circle is shown (f). The electromechanical activation times of the heart is shown (g). The electrical activation map of the epicardium obtained from electro-anatomical mapping (h) is in good agreement with the EWI map (i). The earliest activation is in the apical region of the heart, near where the electrode is pacing from. RV : right ventricle, LV: left ventricle, : earliest site of activation
Fig. 7:
Fig. 7:
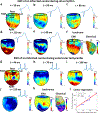
In vivo electromechanical wave imaging of an infarcted canine during sinus rhythm (SR) and during ventricular tachycardia (VT). Snapshots of the left ventricular (LV) axial strain obtained from 4D high volume-rate ultrasound imaging at different time points (a-e for SR and g-j for VT) are shown. The ECG is also shown, with the corresponding time point indicated by a red dot. The electrical and electromechanical activation times of the LV are in good agreement (f for SR and k-l for VT). For SR, early activation is observed at the basal level of the anterior-septal and mid-level of the anterior area. For VT, early activation was observed at the mid-level of the anterior region and late activation was observed in the anterior-septal area between apical and mid-level, adjacent to the early activated region. The arrows in gray color indicate the activation propagation and suggest the presence of a re-entry loop in that area. : earliest site of activation
Fig. 8:
Fig. 8:
In vivo electromechanical wave imaging of a human volunteer during normal sinus rhythm. Snapshots of the axial strain obtained from 4D high volume-rate ultrasound imaging at different time points (a-e) are shown. The ECG is also shown, with the corresponding time point indicated by a red dot. The electromechanical activation times of the heart is shown with two different time scale to better visualize atrial and ventricular activation separately (f). The isochrone is shown with two different dynamic range to separately highlight atrial and ventricular activations. The earliest site of activation is observed near the sinus node in the right atrium (RA). The electromechanical wave then propagates to the left atrium (LA) (b) and finally to both ventricles (c-e). The isochrone shows a typical cardiac activation map during normal sinus rhythm. RV: right ventricle, LV: left ventricle, : earliest site of activation
Fig. 9:
Fig. 9:
In vivo electromechanical wave imaging of a cardiac resynchronization therapy (CRT) patient during right ventricular (RV) and biventricular (BiV) pacing. Snapshots of the axial strain obtained from 4D high volume-rate ultrasound imaging at different time points (a-e for RV pacing and g-k for BiV pacing) are shown. The ECG is also shown, with the corresponding time point indicated by a red dot. During RV pacing, the RV apex was activated first (a), while during BiV pacing, two regions of early activation were detected: the RV apex and the antero-lateral wall of the left ventricle (LV) at the basal level (g). The electromechanical activation times of the ventricles (f for RV pacing and l for BiV pacing) are consistent with the patient’s pacing electrode locations (RV apex and coronary sinus). : earliest site of activation

Similar articles

Cited by

References

    1. Benjamin EJ et al. Heart Disease and Stroke Statistics-2018 Update: A Report From the American Heart Association. Circulation 137, e67–e492, doi:10.1161/cir.0000000000000558 (2018). - DOI - PubMed
    1. Rahman F, Kwan GF & Benjamin EJ Global epidemiology of atrial fibrillation. Nat Rev Cardiol 11, 639–654, doi:10.1038/nrcardio.2014.118 (2014). - DOI - PubMed
    1. Roth GA et al. Global, Regional, and National Burden of Cardiovascular Diseases for 10 Causes, 1990 to 2015. Journal of the American College of Cardiology 70, 1–25, doi:10.1016/j.jacc.2017.04.052 (2017). - DOI - PMC - PubMed
    1. Gladstone DJ et al. Atrial fibrillation in patients with cryptogenic stroke. N Engl J Med 370, 2467–2477, doi:10.1056/NEJMoa1311376 (2014). - DOI - PubMed
    1. Lin HJ et al. Stroke severity in atrial fibrillation. The Framingham Study. Stroke 27, 1760–1764 (1996). - PubMed

Publication types

MeSH terms