. 2019 Oct;74(4):854-863.
doi: 10.1161/HYPERTENSIONAHA.119.12927. Epub 2019 Sep 3.

Dietary Effects on Dahl Salt-Sensitive Hypertension, Renal Damage, and the T Lymphocyte Transcriptome

Affiliations

Dietary Effects on Dahl Salt-Sensitive Hypertension, Renal Damage, and the T Lymphocyte Transcriptome

Justine M Abais-Battad et al. Hypertension. 2019 Oct.

Abstract

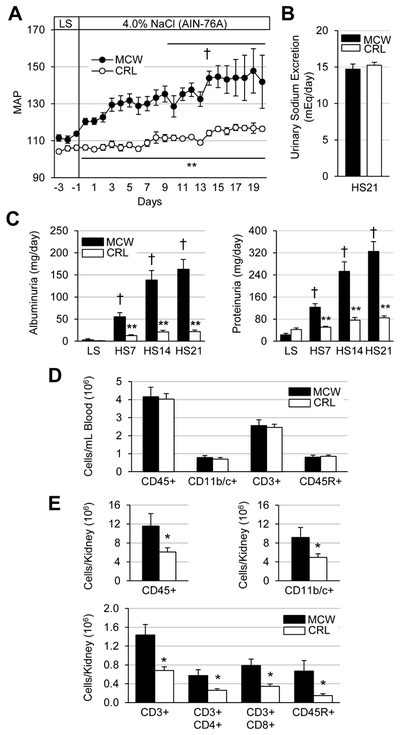
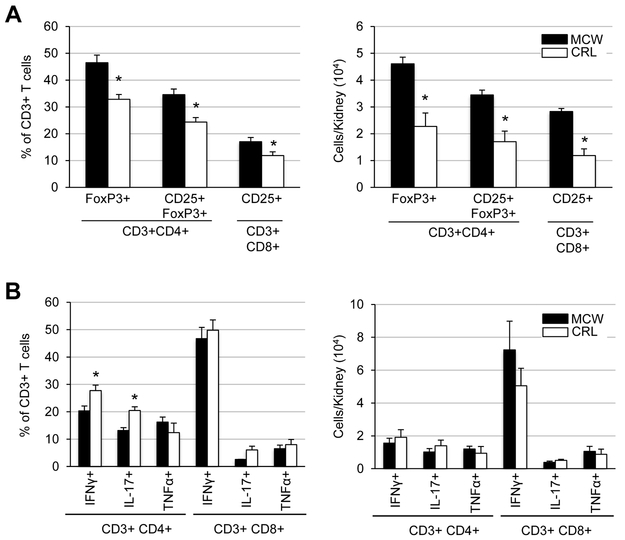
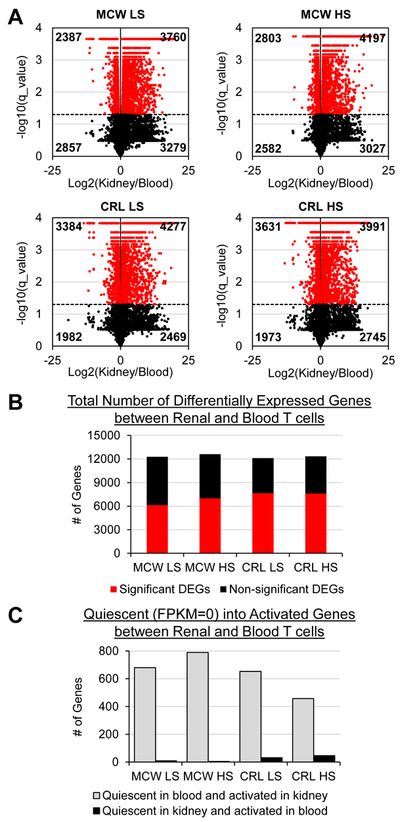
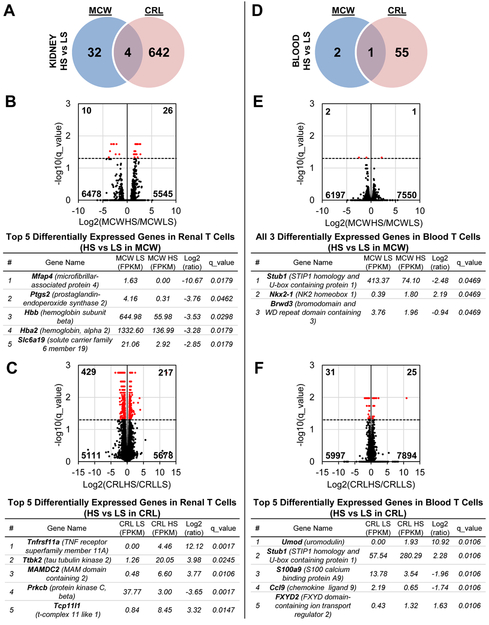
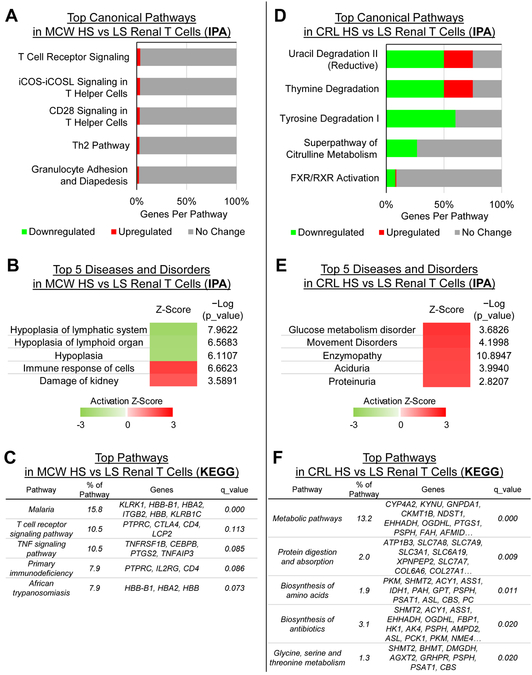
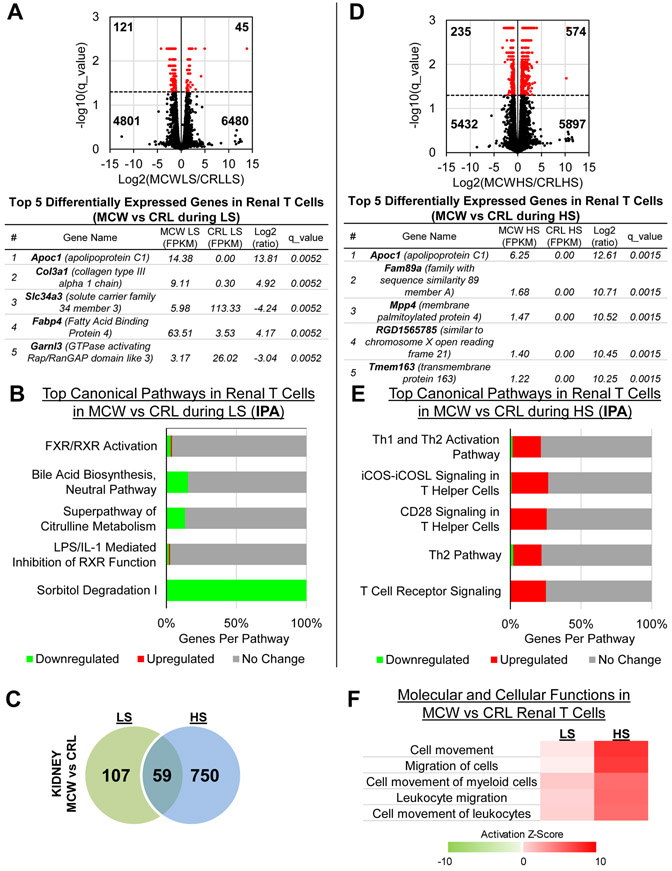
The Dahl salt-sensitive (SS) rat is an established model of SS hypertension and renal damage. In addition to salt, other dietary components were shown to be important determinants of hypertension in SS rats. With previous work eliminating the involvement of genetic differences, grain-fed SS rats from Charles River Laboratories (SS/CRL; 5L2F/5L79) were less susceptible to salt-induced hypertension and renal damage compared with purified diet-fed SS rats bred at the Medical College of Wisconsin (SS/MCW; 0.4% NaCl, AIN-76A). With the known role of immunity in hypertension, the present study characterized the immune cells infiltrating SS/MCW and SS/CRL kidneys via flow cytometry and RNA sequencing in T-cells isolated from the blood and kidneys of rats maintained on their respective parental diet or on 3 weeks of high salt (4.0% NaCl, AIN-76A). SS/CRL rats were protected from salt-induced hypertension (116.5±1.2 versus 141.9±14.4 mm Hg), albuminuria (21.7±3.5 versus 162.9±22.2 mg/d), and renal immune cell infiltration compared with SS/MCW. RNA-seq revealed >50% of all annotated genes in the entire transcriptome to be significantly differentially expressed in T-cells isolated from blood versus kidney, regardless of colony or chow. Pathway analysis of significantly differentially expressed genes between low and high salt conditions demonstrated changes related to inflammation in SS/MCW renal T-cells compared with metabolism-related pathways in SS/CRL renal T-cells. These functional and transcriptomic T-cell differences between SS/MCW and SS/CRL show that dietary components in addition to salt may influence immunity and the infiltration of immune cells into the kidney, ultimately impacting susceptibility to salt-induced hypertension and renal damage.

Keywords: albuminuria; diet; flow cytometry; hypertension; transcriptome.


Figures

Figure 1.
Figure 1.. Grain-fed SS/CRL rats demonstrate attenuated salt-induced hypertension, renal damage, and renal immune cell infiltration compared to casein-fed SS/MCW.
(A) Summarized daily mean arterial pressure (MAP, mmHg) during the baseline, low salt (LS) period through 21 days of high salt challenge (4.0% NaCl AIN-76A). (B) Equivalent urinary sodium excretion between SS/MCW and SS/CRL after 21 days of high salt (HS). (C) Indicative of protection from renal damage, albuminuria and proteinuria were significantly reduced in SS/CRL rats compared to SS/MCW. (D) Similar circulating immune cell profile between SS/MCW and SS/CRL rats. (E) Significantly fewer renal infiltrating immune cells in SS/CRL kidneys compared to SS/MCW. CD45: leukocytes, CD11b/c+: monocyte/macrophages, CD3+: T-cells, CD4+: helper T-cells, CD8+: cytotoxic T-cells, CD45R+: B-cells. n=5-7, †p<0.05 vs LS Day 0, *p<0.05 and **p<0.001 vs SS/MCW.
Figure 2.
Figure 2.. SS/MCW rats have more T regulatory cells and activated cytotoxic T-cells than SS/CRL, but no overt differences in PMA-ionomycin-stimulated cytokine production.
(A) After 3 weeks of high salt, there was a smaller percentage and fewer number of T-regulatory cells (CD3+CD4+CD25+FoxP3+) and activated cytotoxic T-cells (CD3+CD8+CD25+) in the protected SS/CRL rats. (B) In vitro stimulation of isolated T-cells with PMA-ionomycin and intracellular cytokine staining revealed similar capacities of SS/MCW and SS/CRL helper (CD4+) and cytotoxic (CD8+) T-cells to produce pro-inflammatory cytokines IFNγ, IL-17, and TNFα. n=4-6, *p<0.05 vs SS/MCW.
Figure 3.
Figure 3.. On average, >50% of all annotated genes in the transcriptome are significantly differentially expressed in blood versus renal T-cells.
(A) Volcano plots demonstrating significantly up- and downregulated genes (red) when comparing blood versus kidney T-cells in MCW LS, MCW HS, CRL LS, and CRL HS treatment groups. (B) Summarized counts of significant (red) and non-significant (black) differentially expressed genes (DEGs) out of all 14,804 annotated genes. (C) Of the significant DEGs, a large proportion of genes could be considered ‘quiescent’ in the blood (FPKM=0) but activated in the kidney (significantly differentially expressed). n=4 pools/group, 3 rats/pool.
Figure 4.
Figure 4.. More DEGs responsive to high salt in T-cells from kidney than in blood, as well as in SS/CRL rats than SS/MCW.
(A) Venn diagram of all significant DEGs in kidney T-cells of SS/MCW and SS/CRL rats when comparing LS to HS in each group. Volcano plots demonstrating significantly up- and downregulated genes (red), and the top 5 DEGs for each group are listed in Panels (B) and (C). (D) Venn diagram of all significant DEGS in blood T-cells of SS/MCW and SS/CRL rats when comparing LS to HS in each group. Volcano plots and the top DEGs for each group are listed in Panels (E) and (F). n=4 pools/group, 3 rats/pool.
Figure 5.
Figure 5.. Functional analysis of DEGS by IPA or KEGG reveal enrichment of inflammatory pathways in SS/MCW renal T-cells compared to metabolism-related pathways in SS/CRL renal T-cells.
According to IPA, the canonical pathways (A) and ‘diseases and disorders’ (B) enriched in SS/MCW kidney T-cells were specifically related to inflammatory, T-cell signaling and kidney damage. KEGG pathways analysis confirmed this with enrichment in T-cell receptor and TNF signaling pathways (C). This highly contrasts the pathways enriched in SS/CRL renal T-cells, which were related primarily to metabolic processes, including nucleic acid, amino acid, and protein synthesis and metabolism (D-F). n=4 pools/group, 3 rats/pool.
Figure 6.
Figure 6.. Comparison of casein-fed SS/MCW and grain-fed SS/CRL renal T-cells during LS or HS.
(A) Volcano plot demonstrating significantly up- and downregulated genes (red) when comparing SS/MCW to SS/CRL renal T-cells during LS, and the top 5 DEGs. (B) Functional analysis by IPA of these DEGs showed downregulation of metabolism-related pathways in SS/MCW compared to SS/CRL. (C) Venn diagram of all significant DEGs in kidney T-cells during LS and HS when comparing SS/MCW to SS/CRL rats in each group. (D) Volcano plot demonstrating significantly up- and downregulated genes (red) when comparing SS/MCW to SS/CRL renal T-cells during HS, and the top 5 DEGs. (E) Functional analysis by IPA of these DEGs showed upregulation of inflammatory, T-cell signaling pathways in SS/MCW compared to SS/CRL during HS. (F) Heatmap indicating the activation of migratory and homing mechanisms in the SS/MCW T-cells compared to SS/CRL, which was exacerbated upon HS challenge. n=4 pools/group, 3 rats/pool.

Similar articles

Cited by

References

    1. Benjamin EJ, Virani SS, Callaway CW, Chamberlain AM, Chang AR, Cheng S, Chiuve SE, Cushman M, Delling FN, Deo R, de Ferranti SD, Ferguson JF, Fornage M, Gillespie C, Isasi CR, Jimenez MC, Jordan LC, Judd SE, Lackland D, Lichtman JH, Lisabeth L, Liu S, Longenecker CT, Lutsey PL, Mackey JS, Matchar DB, Matsushita K, Mussolino ME, Nasir K, O'Flaherty M, Palaniappan LP, Pandey A, Pandey DK, Reeves MJ, Ritchey MD, Rodriguez CJ, Roth GA, Rosamond WD, Sampson UKA, Satou GM, Shah SH, Spartano NL, Tirschwell DL, Tsao CW, Voeks JH, Willey JZ, Wilkins JT, Wu JH, Alger HM, Wong SS, Muntner P, American Heart Association Council on E, Prevention Statistics C, Stroke Statistics S. Heart disease and stroke statistics-2018 update: A report from the american heart association. Circulation. 2018;137:e67–e492 - PubMed
    1. Weinberger MH. Salt sensitivity of blood pressure in humans. Hypertension. 1996;27:481–490 - PubMed
    1. Lackland DT, Egan BM. Dietary salt restriction and blood pressure in clinical trials. Curr Hypertens Rep. 2007;9:314–319 - PubMed
    1. Svetkey LP, McKeown SP, Wilson AF. Heritability of salt sensitivity in black americans. Hypertension. 1996;28:854–858 - PubMed
    1. Weinberger MH, Miller JZ, Luft FC, Grim CE, Fineberg NS. Definitions and characteristics of sodium sensitivity and blood pressure resistance. Hypertension. 1986;8:II127–134 - PubMed

Publication types

Substances