

The autophagic protein LC3 translocates to the nucleus and localizes in the nucleolus associated to NUFIP1 in response to cyclic mechanical stress
- PMID: 31476975
- PMCID: PMC7469449
- DOI: 10.1080/15548627.2019.1662584
The autophagic protein LC3 translocates to the nucleus and localizes in the nucleolus associated to NUFIP1 in response to cyclic mechanical stress
Abstract
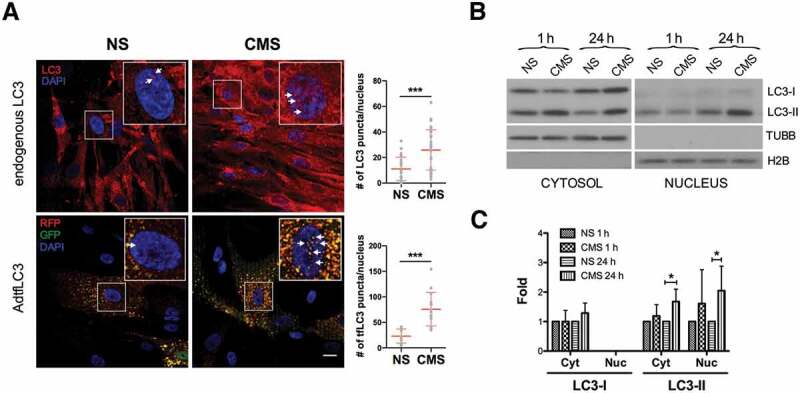
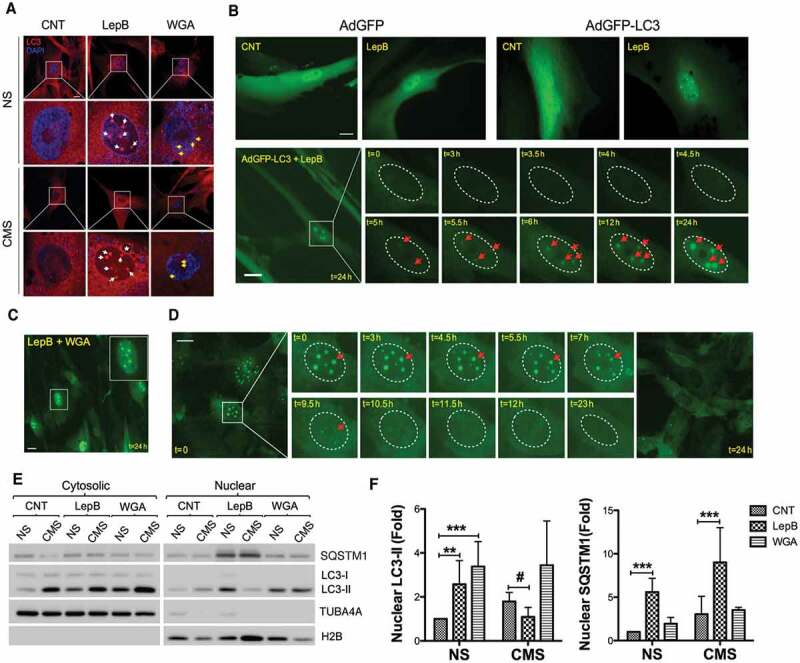
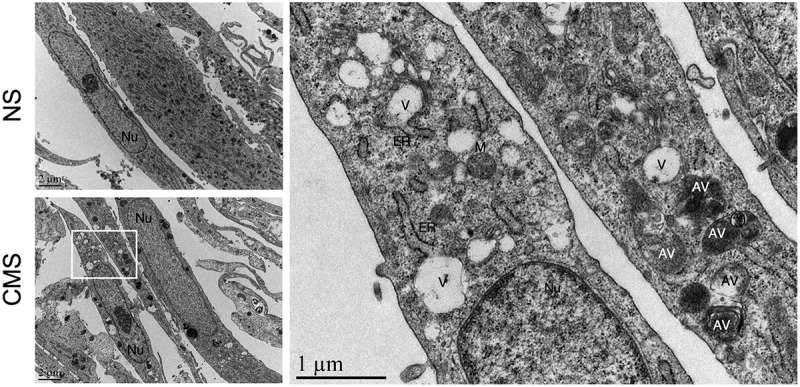
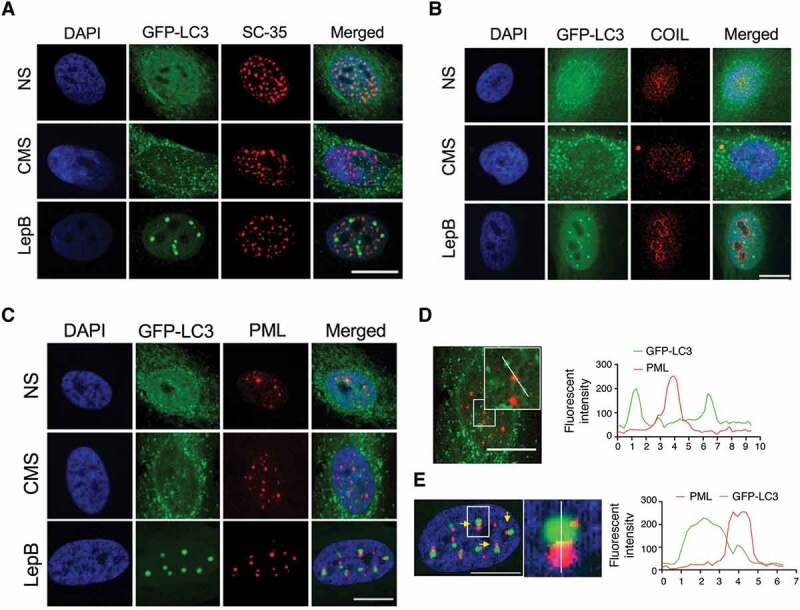
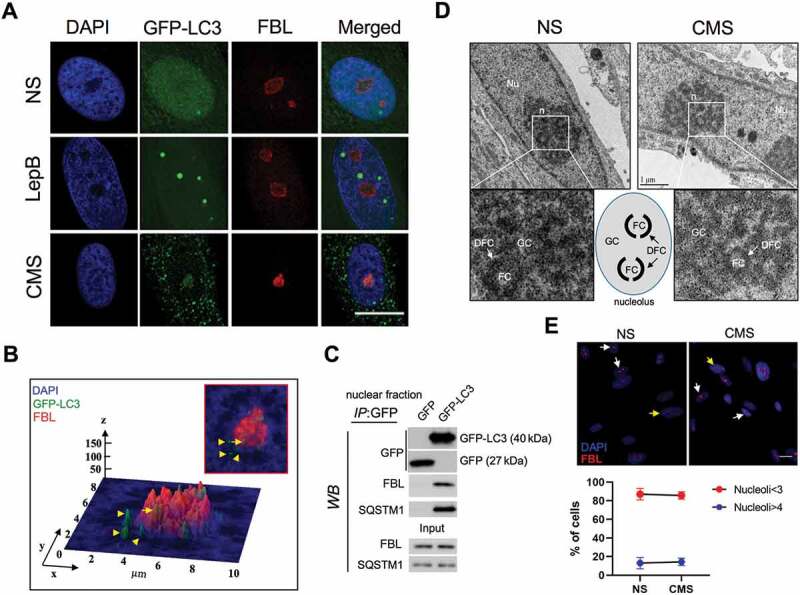
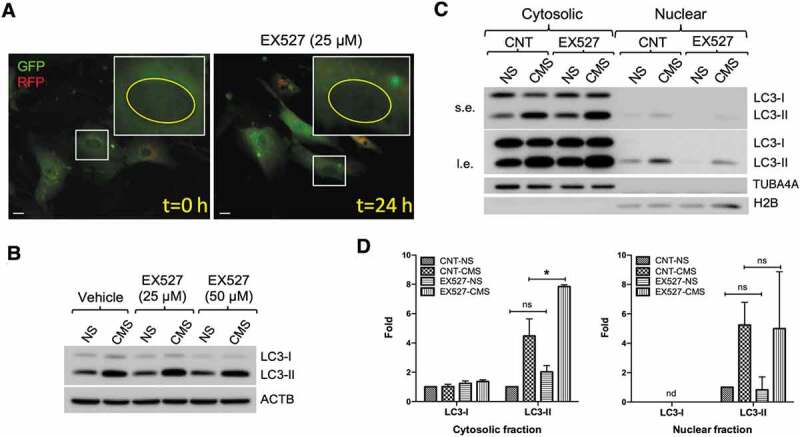
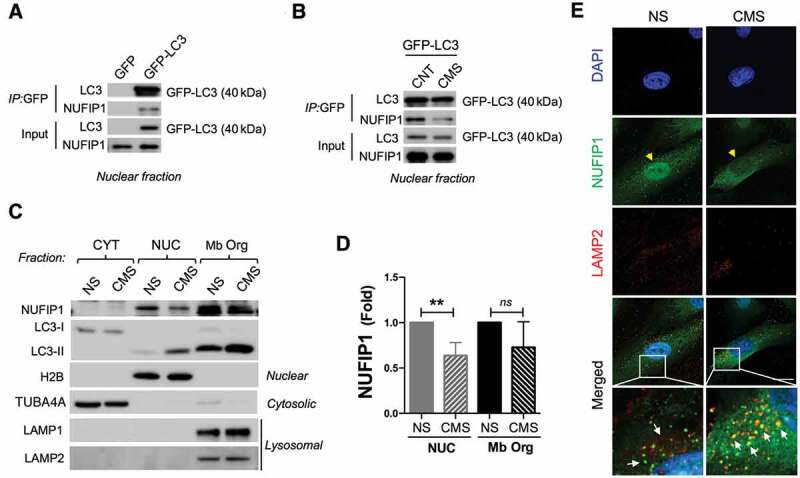
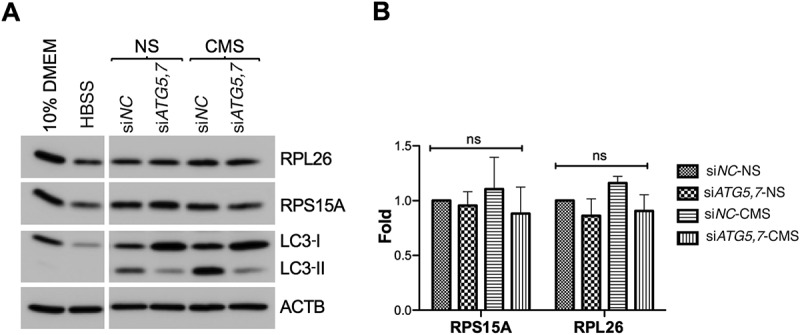
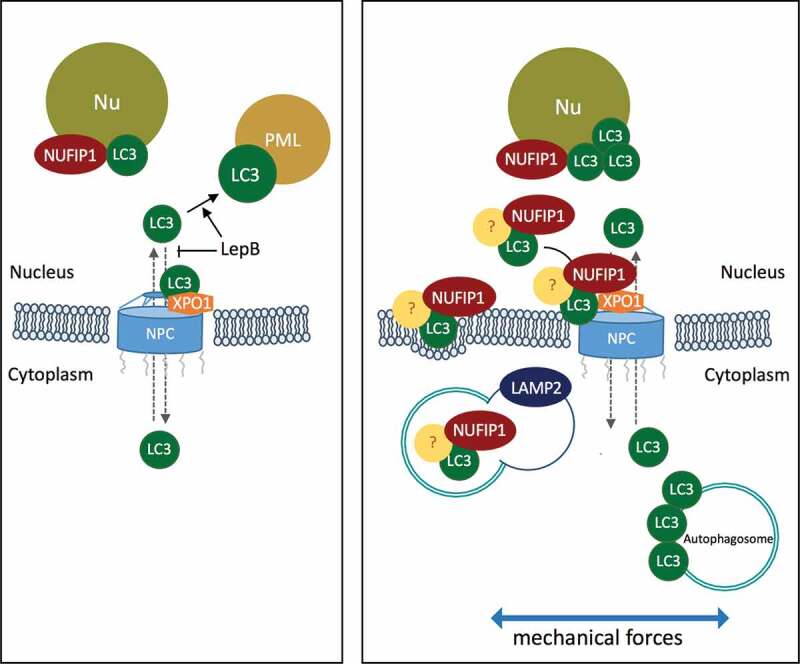
The trabecular meshwork (TM) is a key regulatory tissue of intraocular pressure (IOP) in the anterior chamber of eye. Dysfunction of the TM causes resistance to outflow of aqueous humor, which in turn leads to elevated IOP, a main risk factor of glaucomatous neurodegeneration. Due to variations in IOP, TM cells are continuously exposed to mechanical deformations. We previously reported activation of macroautophagy/autophagy, as one of the physiological responses elicited in TM cells following mechanical strain application. By using biochemical fractionation analysis and imaging techniques, we demonstrate here for the first time the nuclear accumulation of the autophagic marker MAP1LC3/LC3 (microtubule associated protein1 light chain 3)-II, endogenous and exogenously added (AdGFP-LC3, AdtfLC3), in response to cyclic mechanical stress (CMS). Wheat germ agglutinin (WGA) and leptomycin B treatment suggest LC3 to enter the nucleus by passive diffusion, but to exit in an XPO1/CRM1 (exportin 1)-dependent manner in human TM (hTM) cells. While blockage of nuclear export leads to accumulation of LC3 with promyelocytic leukemia (PML) bodies, nuclear LC3 localizes in the nucleolus in cells under CMS. Moreover, nuclear LC3 co-immunoprecipitated with NUFIP1, a ribosome receptor for starvation-induced ribophagy. More interestingly, we further demonstrate that NUFIP1 translocates from the nucleus to LAMP2 (lysosomal associated membrane protein 2)-positive organelles in the stretched cells without triggering ribophagy, suggesting a more general role of NUFIP1 as a selective autophagy receptor for another yet-to-be-identified target in CMS and a surveillance role of nuclear LC3 against stretch-induced damage.
Abbreviation: AdGFP: adenovirus encoding GFP; ATG: autophagy-related; BSA: bovine serum albumin; CMS: cyclic mechanical stretch; Co-IP: coimmunoprecipitation; DAPI: 4',6-diamidino-2-phenylindole; DFCs: dense fibrillar components; EM: electron microscopy; FCs: fibrillar centers; GCs: granular components; GFP: green fluorescent protein; hTM: human trabecular meshwork; HBSS: Hanks balanced salt solution; IOP: intraocular pressure; LAMP1/2: lysosomal associated membrane protein 1/2; LepB: leptomycin B; MTOR: mechanistic target of rapamacyin kinase; NES: nuclear export signals; MAP1LC3/LC3: microtubule associated protein 1 light chain 3; NLS: nuclear localization signal; NPCs: nuclear pore complexes; NUFIP1: nuclear FMR1 interacting protein 1; NS: non-stretched; PBS: phosphate-buffered saline; PE: phosphatidylethanolamine; pfu: plaque-forming units; PML: promyelocytic leukemia; RFP: red fluorescent protein; RPS15A: ribosomal protein S15a; RPL26: ribosomal protein L26; rRNA: ribosomal RNA; SIRT1: sirtuin 1; SQSTM1/p62: sequestosome 1; tfLC3: mRFP-GFP tandem fluorescent-tagged LC3; TM: trabecular meshwork; WB: western blot; WDR36: WD repeat domain 36; WGA: wheat germ agglutinin; XPO1/CRM1: exportin 1.
Keywords: Glaucoma; LC3; NUFIP1; PML bodies; autophagy; mechanical stress; nuclear LC3; nucleolus; stretching; trabecular meshwork.
Conflict of interest statement
No potential conflict of interest was reported by the authors.
Figures
Similar articles
-
MTOR-independent induction of autophagy in trabecular meshwork cells subjected to biaxial stretch.Biochim Biophys Acta. 2014 Jun;1843(6):1054-62. doi: 10.1016/j.bbamcr.2014.02.010. Epub 2014 Feb 26. Biochim Biophys Acta. 2014. PMID: 24583119 Free PMC article.
-
Phosphorylation of EIF2S1 (eukaryotic translation initiation factor 2 subunit alpha) is indispensable for nuclear translocation of TFEB and TFE3 during ER stress.Autophagy. 2023 Jul;19(7):2111-2142. doi: 10.1080/15548627.2023.2173900. Epub 2023 Feb 9. Autophagy. 2023. PMID: 36719671 Free PMC article.
-
TP53INP2 contributes to autophagosome formation by promoting LC3-ATG7 interaction.Autophagy. 2019 Aug;15(8):1309-1321. doi: 10.1080/15548627.2019.1580510. Epub 2019 Feb 20. Autophagy. 2019. PMID: 30767704 Free PMC article.
-
Autophagy and mechanotransduction in outflow pathway cells.Exp Eye Res. 2017 May;158:146-153. doi: 10.1016/j.exer.2016.06.021. Epub 2016 Jun 29. Exp Eye Res. 2017. PMID: 27373974 Free PMC article. Review.
-
Pressure-induced expression changes in segmental flow regions of the human trabecular meshwork.Exp Eye Res. 2017 May;158:67-72. doi: 10.1016/j.exer.2016.06.009. Epub 2016 Jun 19. Exp Eye Res. 2017. PMID: 27334250 Free PMC article. Review.
Cited by
-
Brucella effectors NyxA and NyxB target SENP3 to modulate the subcellular localisation of nucleolar proteins.Nat Commun. 2023 Jan 6;14(1):102. doi: 10.1038/s41467-022-35763-8. Nat Commun. 2023. PMID: 36609656 Free PMC article.
-
Tat-NTS peptide protects neurons against cerebral ischemia-reperfusion injury via ANXA1 SUMOylation in microglia.Theranostics. 2023 Oct 16;13(15):5561-5583. doi: 10.7150/thno.85390. eCollection 2023. Theranostics. 2023. PMID: 37908731 Free PMC article.
-
VCP maintains nuclear size by regulating the DNA damage-associated MDC1-p53-autophagy axis in Drosophila.Nat Commun. 2021 Jul 12;12(1):4258. doi: 10.1038/s41467-021-24556-0. Nat Commun. 2021. PMID: 34253734 Free PMC article.
-
Dexamethasone Downregulates Autophagy through Accelerated Turn-Over of the Ulk-1 Complex in a Trabecular Meshwork Cells Strain: Insights on Steroid-Induced Glaucoma Pathogenesis.Int J Mol Sci. 2021 May 31;22(11):5891. doi: 10.3390/ijms22115891. Int J Mol Sci. 2021. PMID: 34072647 Free PMC article.
-
The Emerging Role of Astrocytic Autophagy in Central Nervous System Disorders.Neurochem Res. 2022 Dec;47(12):3697-3708. doi: 10.1007/s11064-022-03714-w. Epub 2022 Aug 12. Neurochem Res. 2022. PMID: 35960484
References
-
- Matsuo T, Uchida H, Matsuo N. Bovine and porcine trabecular cells produce prostaglandin F2 alpha in response to cyclic mechanical stretching. Jpn J Ophthalmol. 1996;40(3):289–296. - PubMed
-
- Mitton KP, Tumminia SJ, Arora J, et al. Transient loss of alphaB-crystallin: an early cellular response to mechanical stretch. Biochem Biophys Res Commun. 1997;235(1):69–73. - PubMed
-
- Okada Y, Matsuo T, Ohtsuki H. Bovine trabecular cells produce TIMP-1 and MMP-2 in response to mechanical stretching. Jpn J Ophthalmol. 1998;42(2):90–94. - PubMed
Publication types
MeSH terms
Substances
Grants and funding
LinkOut - more resources
Full Text Sources
Other Literature Sources
Research Materials
Miscellaneous