. 2019 Sep 2;10(1):44.
doi: 10.1186/s13293-019-0258-2.

An inherent T cell deficit in healthy males to C. neoformans infection may begin to explain the sex susceptibility in incidence of cryptococcosis

Affiliations

An inherent T cell deficit in healthy males to C. neoformans infection may begin to explain the sex susceptibility in incidence of cryptococcosis

Tiffany E Guess et al. Biol Sex Differ. .

Abstract

Background: Cryptococcus neoformans, the causative agent of cryptococcosis, causes ~ 181,000 deaths annually, with males having a higher incidence of disease than females (7M:3F). The reason for this sex bias remains unclear. We hypothesized that this disparity was due to biological differences between the male and female immune response.

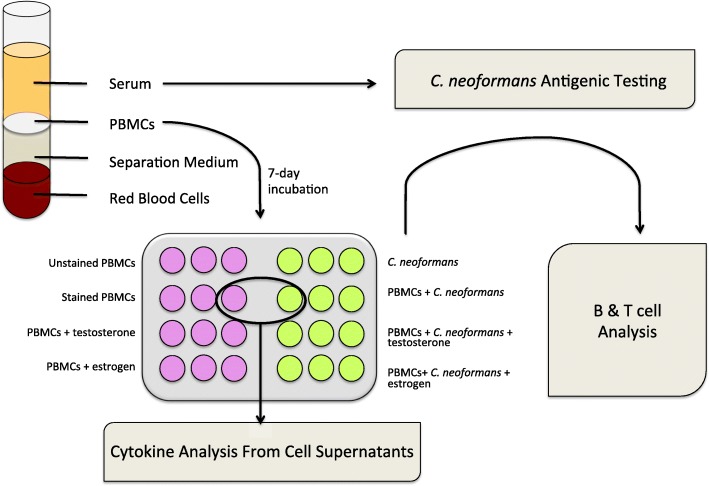
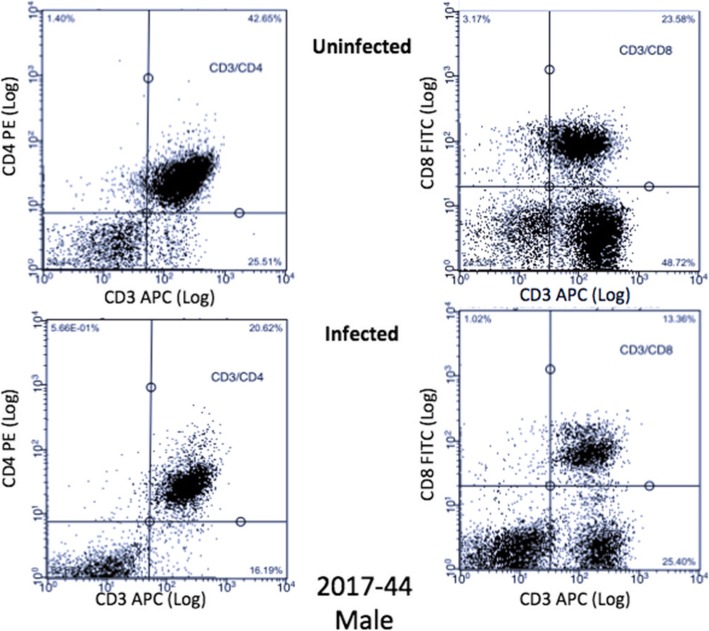
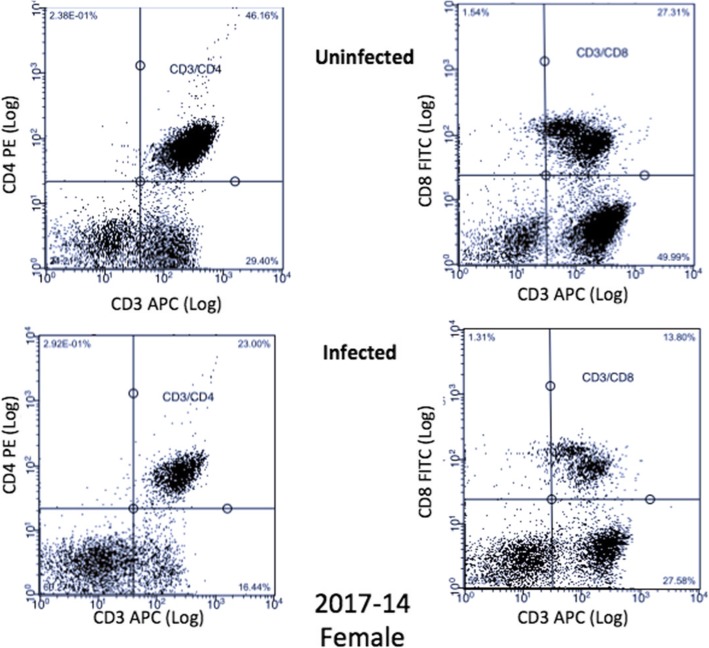
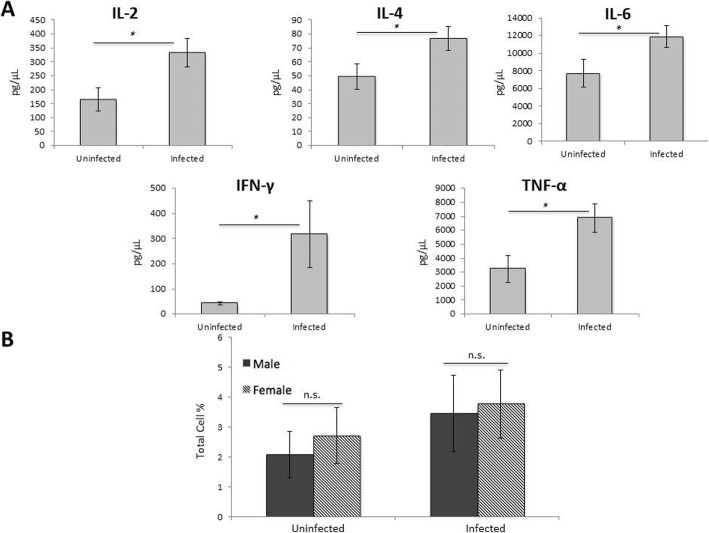
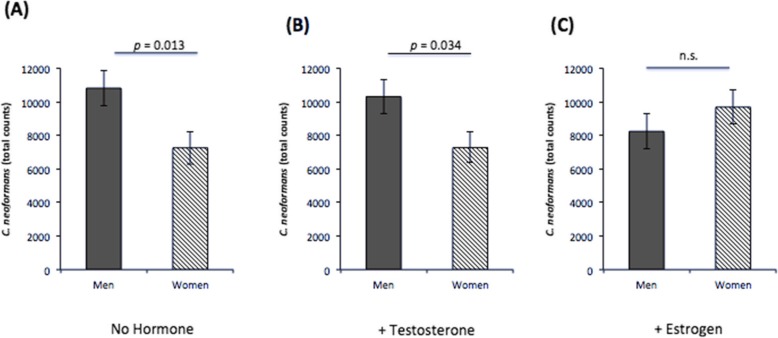
Methods: Peripheral blood mononuclear cells (PBMCs) from healthy donors were isolated and infected with C. neoformans ± exogenous testosterone or 17-β-estradiol. C. neoformans, B, T, and NK cell proliferation was quantified by flow cytometry. Cytokine analysis was conducted via protein array or ELISA. Serological testing was conducted to determine previous exposure to C. neoformans.

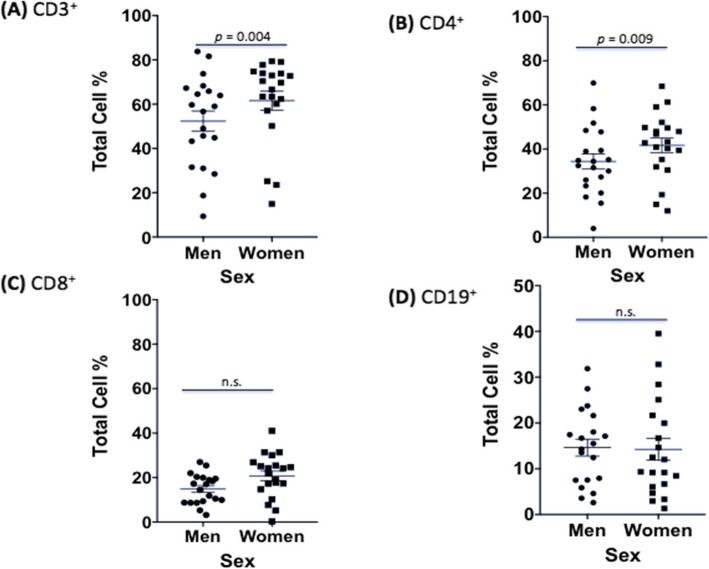
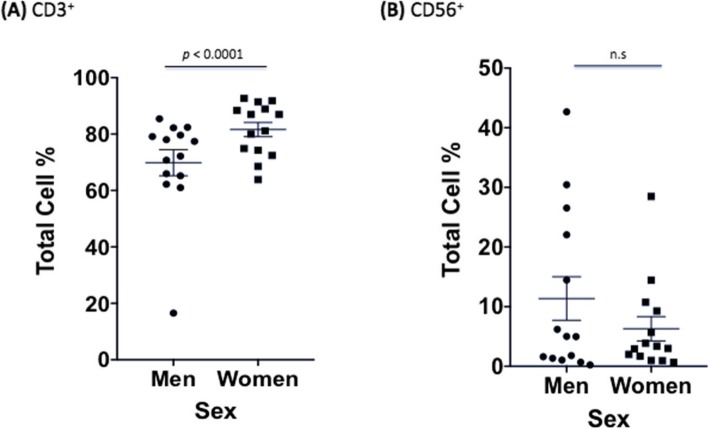
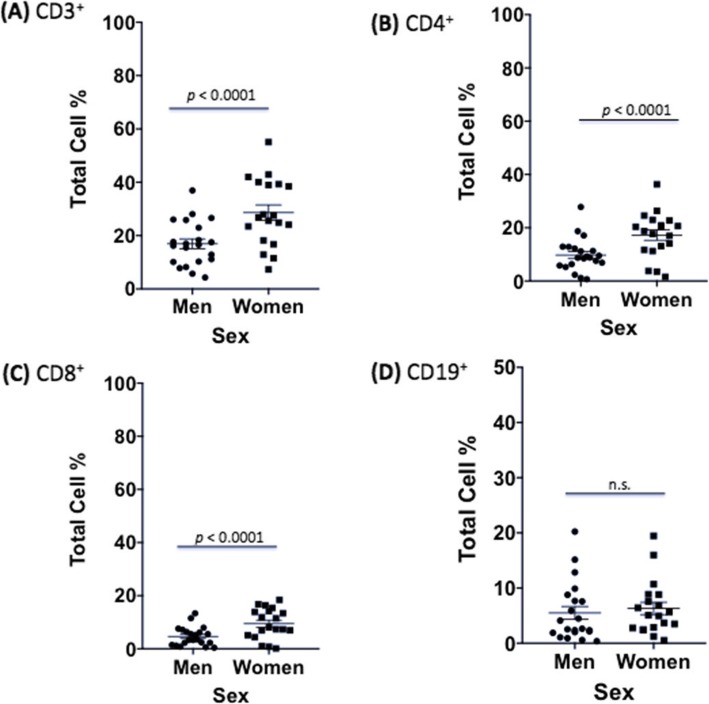
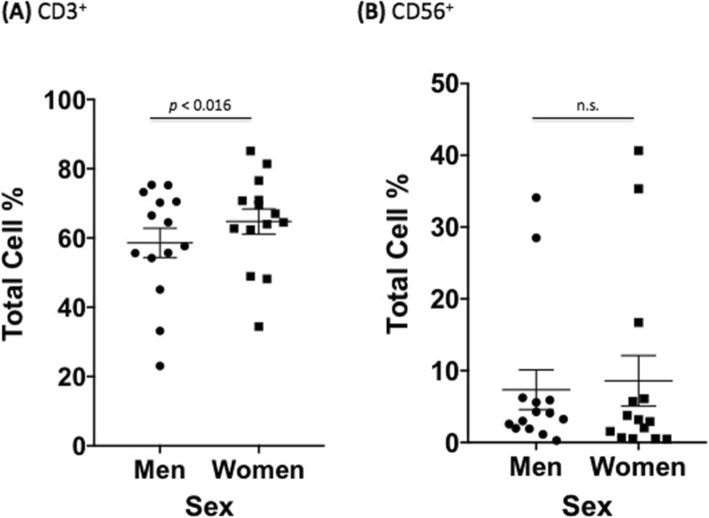
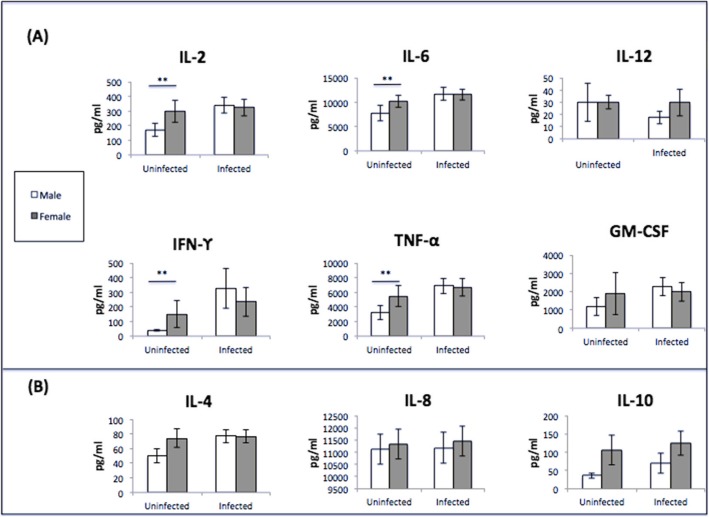
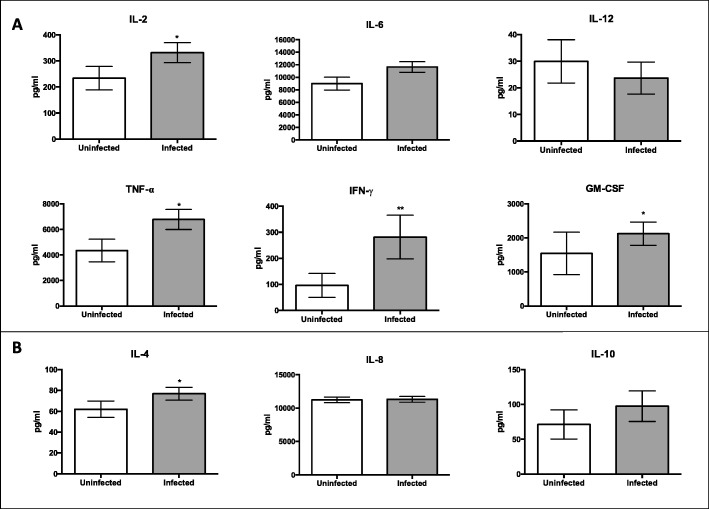
Results: C. neoformans proliferated more in male PBMCs. T cell percentages in both sexes were lower in infected versus uninfected cells. Male PBMCs had lower CD3+, CD4+, and CD8+ T cells percentages during infection compared to females. Cytokine profiles showed differences in uninfected male and female PBMCs, which subsided during infection. Only one donor was sero-negative for prior C. neoformans exposure. There was an effect of estrogen in one dataset.

Conclusions: These results suggest that males show an inherent deficit in T cell response during infection, which may contribute to the increased incidence of disease in males.

Keywords: B cells; Cryptococcosis; Cryptococcus neoformans; Estrogen; Immune response; Natural killer cells; Sex bias in infection; T cells; Testosterone.


Conflict of interest statement

The authors declare that they have no competing interests.

Figures

Fig. 1
Fig. 1
Experiment and workflow schematic. Whole blood was extracted by venipuncture and separated using a density gradient. Isolated PBMCs were incubated for 7 days either alone or in the presence of C. neoformans. Subsets of both uninfected and infected groups were incubated with testosterone or 17 β-estradiol. All samples were setup in triplicate and the B and T cell response was determined via flow cytometry in the first dataset. The T cell and natural killer cell response was determined in the second dataset. Dead cells were identified in both datasets using dead cell stain. Because no differences were observed in cells incubated with sex hormones, only cell supernatants of uninfected and infected PBMCs (without hormones), from the first dataset, were used for cytokine analysis via Luminex assay
Fig. 2
Fig. 2
Male T cell dot plots. Dot plots from a representative male donor (2017-45), in the first dataset, of CD3+/CD4+ and CD3+/CD8+ T cells in both uninfected and infected treatment groups
Fig. 3
Fig. 3
Female T Cell Dot Plots. Dot plots from a representative female donor (2017-14), in the first dataset, of CD3+/CD4+ and CD3+/CD8+ T cells in both uninfected and infected treatment groups
Fig. 4
Fig. 4
In situ cytokine analysis and CD25 levels. a Cytokine levels from infected male PBMCs: IL-2, IL-4, IL-6, IFN-γ, and TNF-α compared to uninfected PBMCs. N = 40 (21 males and 19 females). Cytokine analysis was done on the first data set using one well of the triplicate samples set up (no additional hormones) and measured using the Bio-Plex protein array or ELISA, and the data was analyzed using a two-way ANOVA and Bonferroni Correction. Error bars are SE. Statistical significance is indicated as follows: *p < 0.05. b Levels of CD25+ cells between male and female uninfected and infected PBMCS after 7 days of infection as measured by cytometric analysis. The total percentage given represents the total percentage of cells expressing CD25+. N = 5 (three males and two females). This experiment was done in triplicate and the results averaged to create each data point. Data was analyzed using MANOVA with simple contrasts. Error bars are SE; n.s. not significant
Fig. 5
Fig. 5
Differences in immune response between sexes in uninfected PBMCs (first dataset). Mean cell percentages for the T cell markers, a CD3+, b CD4+, c CD8+, and d the B cell marker, CD19+, in PBMCs from healthy men and women after a 7-day incubation as measured by cytometric analysis. The total percentage given for each marker represents the total percentage of cells expressing the antigen indicated. N = 40 (21 males and 19 females). This experiment was done in triplicate and the results averaged to create each data point. Data was analyzed using MANOVA with simple contrasts. Error bars are SE; n.s. not significant
Fig. 6.
Fig. 6.
Differences in immune response between sexes in uninfected PBMCs (second dataset). Mean cell percentages for the T cell marker, a CD3+ and the natural killer cell marker, b CD56+, in PBMCs from healthy men and women after a 7 day C. neoformans incubation as measured by flow cytometric analysis. The total percentage given for each marker represents the total percentage of cells expressing the antigen indicated. N = 28 (14 males and 14 females). This experiment was done in triplicate and the results averaged to create each data point. Data was analyzed using MANOVA with simple contrasts. Error bars are SE; n.s. not significant
Fig. 7
Fig. 7
C. neoformans proliferation at 7 days post-infection. Mean cell counts of C. neoformans as measured by flow cytometry after 7 days incubation with peripheral blood mononuclear cells isolated from healthy men or women in the presence of a no additional hormones, b physiological levels of testosterone, or c physiological levels of estrogen. N = 28 (14 males and 14 females). Error bars are standard error; n.s. not significant
Fig. 8
Fig. 8
Differences in immune response between sexes in infected PBMCs (first dataset). Mean cell percentages for the T cell markers, a CD3+, b CD4+, c CD8+, and d the B cell marker, CD19+, in PBMCs from healthy men and women after a 7 day C. neoformans infection as measured by cytometric analysis. The total percentage given for each marker represents the total percentage of cells expressing the antigen indicated. N = 40 (21 males and 19 females). This experiment was done in triplicate and the results averaged to create each data point. Data was analyzed using MANOVA with simple contrasts. Error bars are SE; n.s. non-significant
Fig. 9
Fig. 9
Differences in immune response between sexes in infected PBMCs (second dataset). Mean cell percentages for the T cell marker. a CD3+ and the natural killer cell marker. b CD56+, in PBMCs from healthy men and women after a 7 day C. neoformans infection as measured by flow cytometric analysis. The total percentage given for each marker represents the total percentage of cells expressing the antigen indicated. N = 28 (14 males and 14 females). This experiment was done in triplicate and the results averaged to create each data point. Data was analyzed using MANOVA with simple contrasts. Error bars are SE; n.s. non-significant
Fig. 10
Fig. 10
Cytokine analysis of male and female PBMCs supernatants (pg/mL) at 7 days post-incubation. a Th1 cytokine expression and b Th2 cytokine expression N = 40 (21 males and 19 females). Cytokine analysis was done on the first data set using one well of the triplicate samples set up (no additional hormones) and measured using the Bio-Plex protein array or ELISA, and the data was analyzed using a two-way ANOVA and Bonferroni Correction. Error bars are SE. Statistical significance is indicated as follows: *p < 0.05; **p < 0.01; ***p < 0.001
Fig. 11
Fig. 11
Cytokine analysis of uninfected and infected cell supernatants (pg/mL) at 7 days post-incubation. a Th1 cytokines. b Th2 Cytokines. N = 40 (21 males and 19 females). Cytokine analysis was done on the first data set using one well of the triplicate samples set up (no additional hormones) and measured using the Bio-Plex protein array or ELISA, and the data was analyzed using a two-way ANOVA and Bonferroni Correction. Error bars are SE. Statistical significance is indicated as follows: *p < 0.05; **p < 0.01; ***p < 0.001

Similar articles

Cited by

References

    1. Park BJ, Wannemuehler KA, Marston BJ, Govender N, Pappas PG, Chiller TM. Estimation of the current global burden of cryptococcal meningitis among persons living with HIV/AIDS. AIDS. 2009;23(4):525–530. doi: 10.1097/QAD.0b013e328322ffac. - DOI - PubMed
    1. Rajasingham R, Smith RM, Park BJ, Jarvis JN, Govender NP, Chiller TM, et al. Global burden of disease of HIV-associated cryptococcal meningitis: an updated analysis. Lancet Infect Dis. 2017;17(8):873–881. doi: 10.1016/S1473-3099(17)30243-8. - DOI - PMC - PubMed
    1. Mora DJ, Fortunato LR, Andrade-Silva LE, Ferreira-Paim K, Rocha IH, Vasconcelos RR, et al. Cytokine profiles at admission can be related to outcome in AIDS patients with cryptococcal meningitis. PLoS One. 2015;10(3):e0120297. doi: 10.1371/journal.pone.0120297. - DOI - PMC - PubMed
    1. Lin YY, Shiau S, Fang CT. Risk factors for invasive Cryptococcus neoformans diseases: a case-control study. PLoS One. 2015;10(3):e0119090. doi: 10.1371/journal.pone.0119090. - DOI - PMC - PubMed
    1. Lortholary O, Improvisi L, Fitting C, Cavaillon JM, Dromer F. Influence of gender and age on course of infection and cytokine responses in mice with disseminated Cryptococcus neoformans infection. Clin Microbiol Infect. 2002;8(1):31–37. doi: 10.1046/j.1469-0691.2002.00375.x. - DOI - PubMed

Publication types