Comparative Study
. 2019 Sep 2;20(1):187.
doi: 10.1186/s13059-019-1768-2.

Comparative genomic analysis of six Glossina genomes, vectors of African trypanosomes

Affiliations
Comparative Study

Comparative genomic analysis of six Glossina genomes, vectors of African trypanosomes

Geoffrey M Attardo et al. Genome Biol. .

Abstract

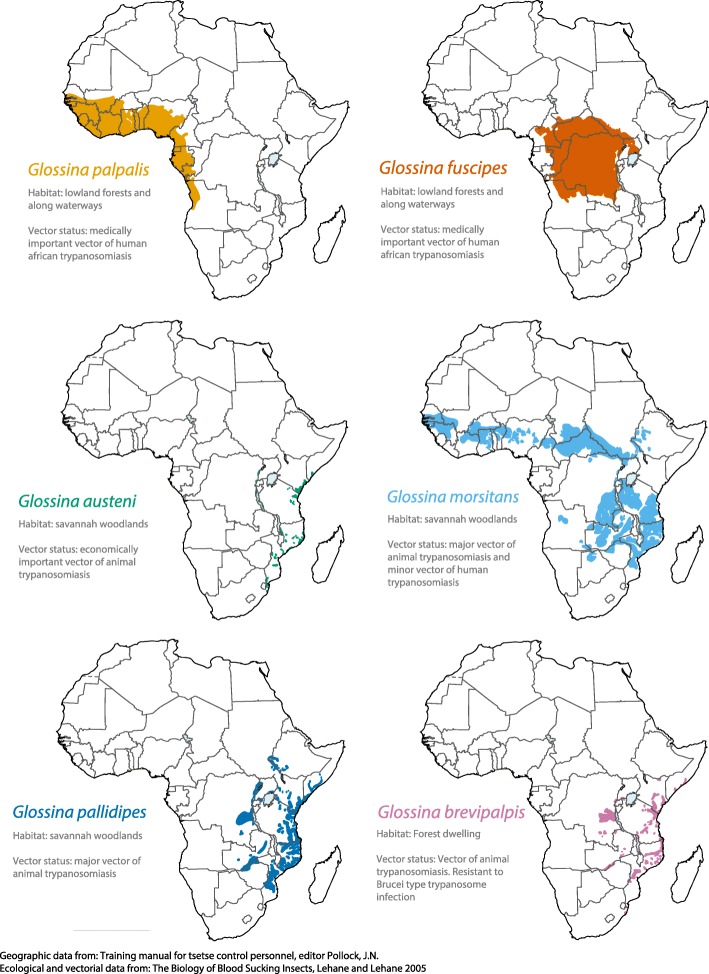
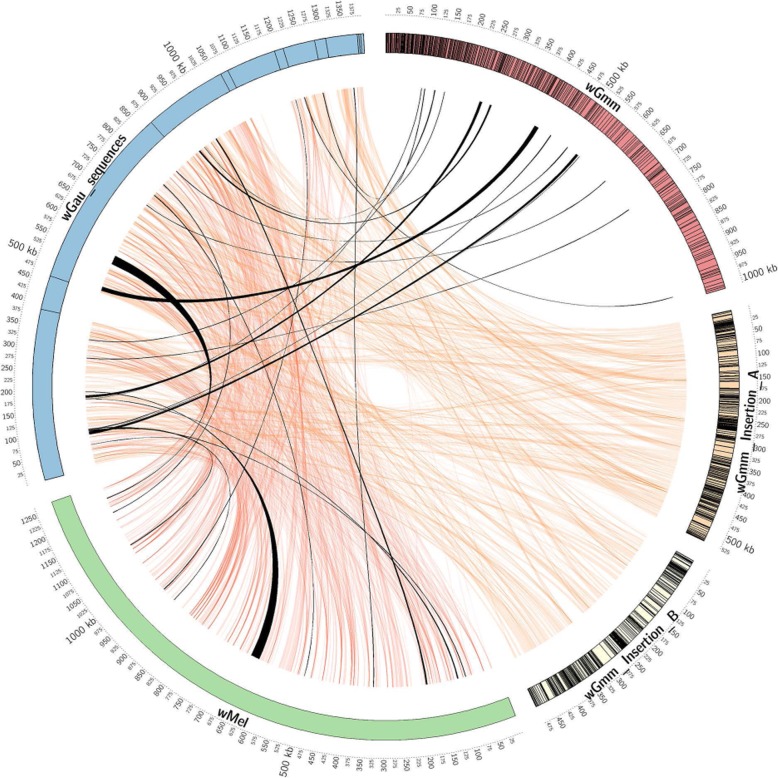
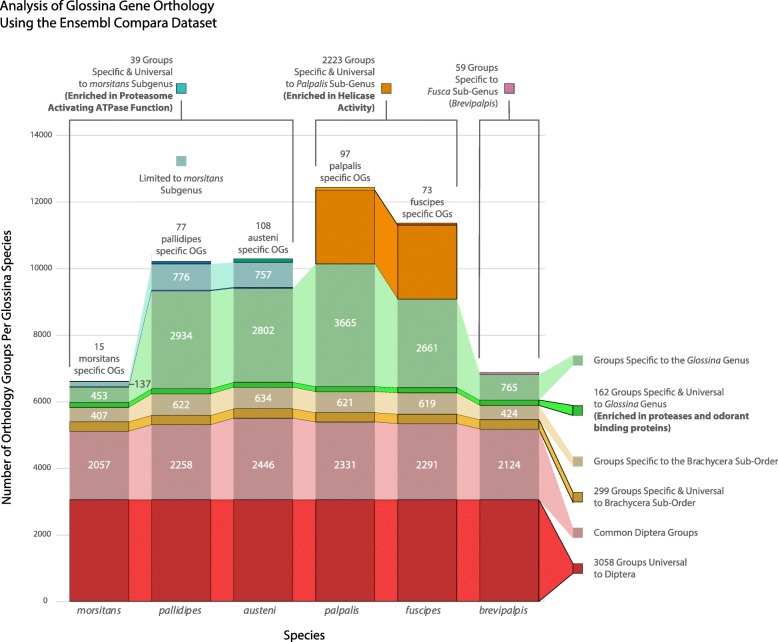
Background: Tsetse flies (Glossina sp.) are the vectors of human and animal trypanosomiasis throughout sub-Saharan Africa. Tsetse flies are distinguished from other Diptera by unique adaptations, including lactation and the birthing of live young (obligate viviparity), a vertebrate blood-specific diet by both sexes, and obligate bacterial symbiosis. This work describes the comparative analysis of six Glossina genomes representing three sub-genera: Morsitans (G. morsitans morsitans, G. pallidipes, G. austeni), Palpalis (G. palpalis, G. fuscipes), and Fusca (G. brevipalpis) which represent different habitats, host preferences, and vectorial capacity.

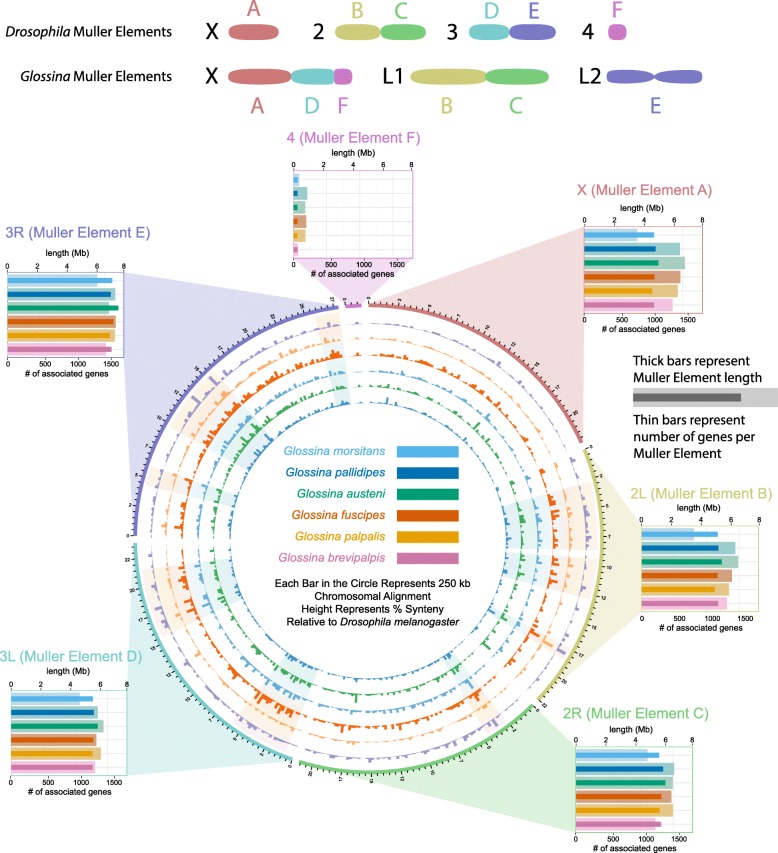
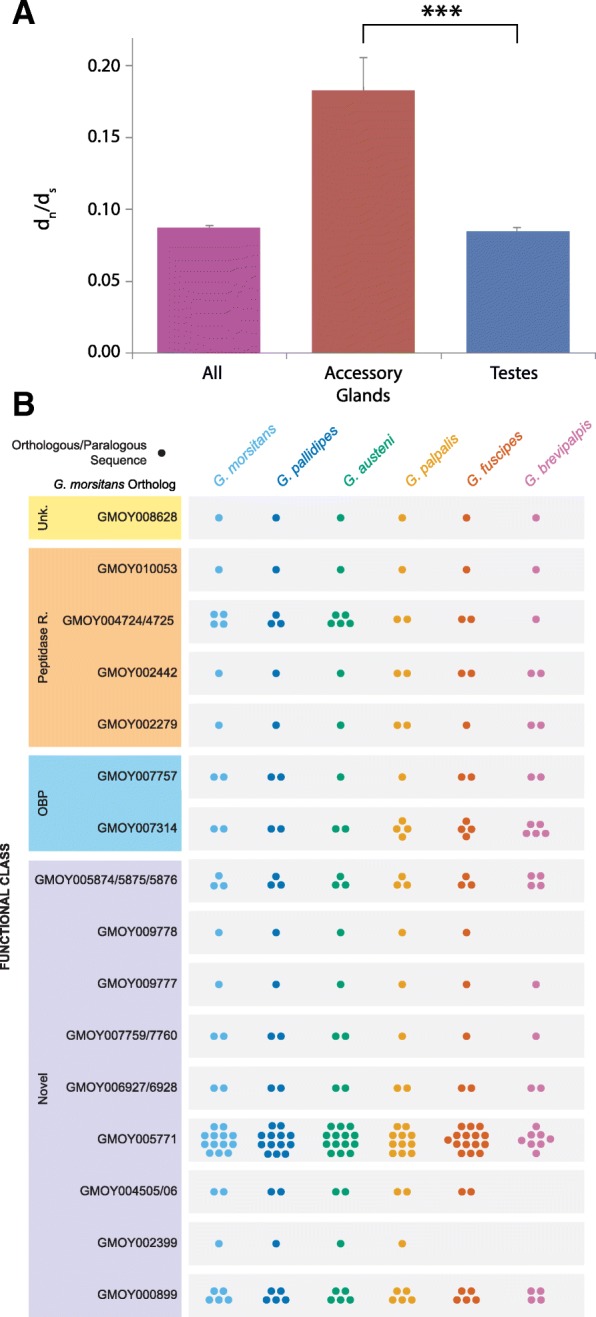
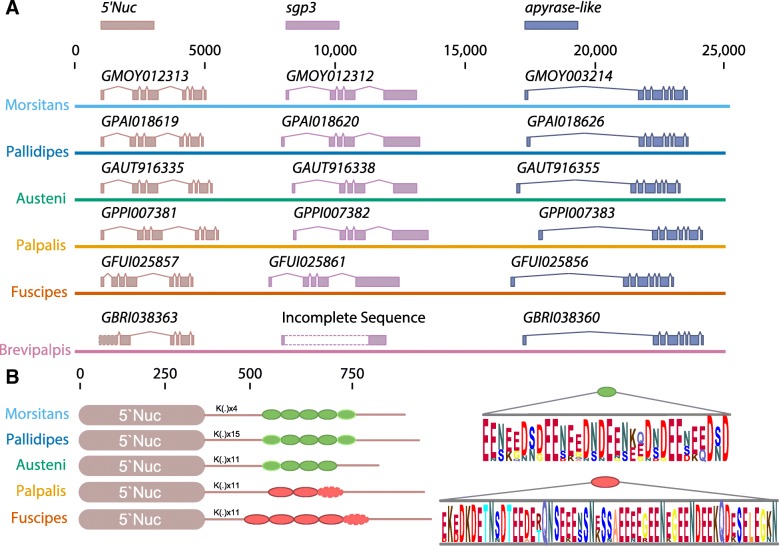
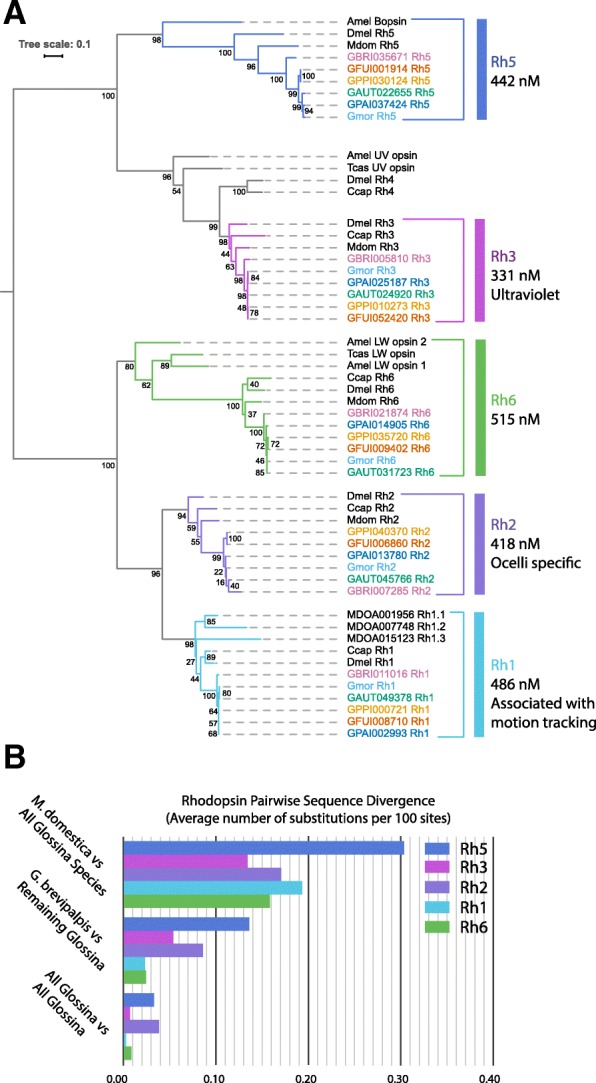
Results: Genomic analyses validate established evolutionary relationships and sub-genera. Syntenic analysis of Glossina relative to Drosophila melanogaster shows reduced structural conservation across the sex-linked X chromosome. Sex-linked scaffolds show increased rates of female-specific gene expression and lower evolutionary rates relative to autosome associated genes. Tsetse-specific genes are enriched in protease, odorant-binding, and helicase activities. Lactation-associated genes are conserved across all Glossina species while male seminal proteins are rapidly evolving. Olfactory and gustatory genes are reduced across the genus relative to other insects. Vision-associated Rhodopsin genes show conservation of motion detection/tracking functions and variance in the Rhodopsin detecting colors in the blue wavelength ranges.

Conclusions: Expanded genomic discoveries reveal the genetics underlying Glossina biology and provide a rich body of knowledge for basic science and disease control. They also provide insight into the evolutionary biology underlying novel adaptations and are relevant to applied aspects of vector control such as trap design and discovery of novel pest and disease control strategies.

Keywords: Disease; Hematophagy; Lactation; Neglected; Symbiosis; Trypanosomiasis; Tsetse.


Conflict of interest statement

All authors declare that they have no competing interests.

Figures

Fig. 1
Fig. 1
Geographic distribution, ecology, and vectorial capacity of sequenced Glossina species. Visual representation of the geographic distribution of the sequenced Glossina species across the African continent. Ecological preferences and vectorial capacities are described for each associated group
Fig. 2
Fig. 2
Comparative analysis of repetitive elements within the Glossina genomes. a Graphical representation of the constitution and sequence coverage by the various classes of identified dispersed repetitive elements. b Coverage of TE families that are shared between species. More than 75% of the total coverage (eight first magnified bars) correspond to TE either specific to one species, shared by all species, or shared by the five closest. c Relative constitution of DNA terminal inverted repeat (TIR) families across the Glossina genomes. d Relative constitution of long interspersed nuclear elements (LINEs) across the Glossina genomes. For c and d, the size of the pie charts reflects the proportion of the subclass among the dispersed repetitive sequences
Fig. 3
Fig. 3
Glossina whole-genome alignment, phylogenetic analysis of orthologous protein-coding nuclear genes, and phylogenetic analysis of mitochondrial sequences. a Analysis of whole-genome and protein-coding sequence alignment. The left graph reflects the percentage of total genomic sequence aligning to the G. m. morsitans reference. The right side of the graph represents the alignment of all predicted coding sequences from the genomes with coloration representing matches, mismatches, insertions, and uncovered exons. b Phylogenic tree from conserved protein-coding sequences. Black dots at nodes indicate full support from maximum likelihood (Raxml), Bayesian (Phylobayes), and coalescent-aware (Astral) analyses. Raxml and Phylobayes analyses are based on an amino acid dataset of 117,782 positions from 286 genes from 12 species. The Astral analyses are based on a 1125-nucleotide dataset of 478,617 positions from the 6 Glossina (full trees are in Additional file 2: Figure S2A-C). The values at nodes represent the bootstrap supports and posterior probabilities from the maximum likelihood and Bayesian analyses, respectively (Bootstrap/posterior probability). c Molecular phylogeny derived from whole mitochondrial genome sequences. The analysis was performed using the maximum likelihood method with MEGA 6.0
Fig. 4
Fig. 4
Visualization of syntenic block analysis data and predicted Muller element sizes. Level of syntenic conservation between tsetse scaffolds and Drosophila chromosomal structures (Muller elements). The color-coded concentric circles consisting of bars represent the percent of syntenic conservation of orthologous protein-coding gene sequences between the Glossina genomic scaffolds and Drosophila Muller elements. Each bar represents 250 kb of aligned sequence, and bar heights represent the percent of syntenic conservation. The graphs on the periphery of the circle illustrate the combined predicted length and number of genes associated with the Muller elements for each tsetse species. The thin darkly colored bars represent the number of 1:1 orthologs between each Glossina species and D. melanogaster. The thicker lightly colored bands represent the predicted length of each Muller element for each species. This was calculated as the sum of the lengths of all scaffolds mapped to those Muller elements
Fig. 5
Fig. 5
Homology map of the Wolbachia-derived cytoplasmic and horizontal transfer-derived nuclear sequences. Circular map of the G. austeni Wolbachia horizontal transfer-derived genomic sequences (wGau—blue), the D. melanogaster Wolbachia cytoplasmic genome sequence (wMel—green), the G. m. morsitans Wolbachia cytoplasmic genome sequence (wGmm—red), and the Wolbachia-derived chromosomal insertions A and B from G. m. morsitans (wGmm insertion A and insertion B yellow and light yellow, respectively). The outermost circle represents the scale in kbp. Contigs for the wGau sequences, wGmm, and the chromosomal insertions A and B in G. m. morsitans are represented as boxes. Regions of homology between the G. austeni insertions and the other sequences are represented by orange ribbons. Black ribbons represent syntenic regions between the wGau insertions and the cytoplasmic genomes of wGmm and wMel
Fig. 6
Fig. 6
Constituent analysis of Glossina-associated gene orthology groups. Visualization of the relative constitution of orthology groups containing Glossina gene sequences. Combined bar heights represent the combined orthogroups associated with each Glossina species. The bars are color-coded to reflect the level of phylogenetic representation of clusters of orthogroups at the order, sub-order, genus, sub-genus, and species. Saturated bars represent orthology groups specific and universal to a phylogenetic level. Desaturated bars represent orthogroups specific to a phylogenetic level but lack universal representation across all included species. Gene ontology analysis of specific and universal groups can be found in Additional file 1: Table S7
Fig. 7
Fig. 7
Sub-genus-specific gene family expansions/retractions. Principal component analysis-based clustering of gene orthology groups showing significant differences in the number of representative sequences between the six Glossina species. Orthology groups included have sub-genus-specific expansions/contractions as determined by CAFE test (p value < 0.05). Groups highlighted in the manuscript are enclosed within boxes in the figure. An alternative version of the figure labeled with the orthology group IDs is provided in Additional file 2: Figure S11. This data is also available in table form in Additional file 1: Table S8, in Additional file 7, and Additional file 8
Fig. 8
Fig. 8
Heat map of counts of Glossina homologs to Drosophila immune genes. A plot of immune gene families showing variance greater than 1 in the number of genes per species. Numbers within the cells represent the counts of sequences per species within immune gene orthology groups. Orthology groups included in the analysis contain Drosophila genes with the “Immune System Process” GO tag (GO:0002376). The gene families are clustered by similarity in variance as determined by Pearson correlation. The bar graphs on the right side of the figure represent the average ratio of synonymous to non-synonymous changes across orthologous sequences within each immune gene family
Fig. 9
Fig. 9
Conservation of synteny, sequence homology, and stage/sex-specific expression of tsetse milk proteins between species. Overview of the conservation of tsetse milk protein genes and their expression patterns in males and non-lactating and lactating females. a Syntenic analysis of gene structure/conservation in the mgp2-10 genetic locus across Glossina species. b Phylogenetic analysis of orthologs from the mgp2-10 gene family. c Combined sex- and stage-specific RNA-seq analysis of relative gene expression of the 12 milk protein gene orthologs in males and non-lactating and lactating females of 5 Glossina species. d Visualization of fold change in individual milk protein gene orthologs across 5 species between lactating and non-lactating female flies. Gene sequence substitution rates are listed for each set of orthologous sequences. e Comparative enrichment analysis of differentially expressed genes between non-lactating and lactating female flies
Fig. 10
Fig. 10
Comparative analysis of Glossina male accessory gland (MAG) protein family memberships. Graphical representation of the evolutionary rate and gene number variability in male accessory protein genes across Glossina species. a Average ratio of synonymous to non-synonymous changes in male reproductive-associated genes relative to the entire genome. Error bars represent the standard error of the mean, and the asterisks represent a p value < 0.001. b The number of putative gene sequences across the Glossina genus orthologous and paralogous to characterized MAG genes from G. m. morsitans. The genes are categorized by their functional classes as derived by orthology to characterized proteins from Drosophila and other insects. The functional classes include Novel—tsetse-specific genes; OBPs—odorant-binding proteins; peptidase—proteins with peptidase/-like functions; Unk.—proteins with orthologs in other insects that lack functional characterization
Fig. 11
Fig. 11
5′Nuc/apyrase salivary gene family organization and sequence features across Glossina species. a Chromosomal organization of the 5′Nuc/apyrase family orthologs on genome scaffolds from the six Glossina species. The brown gene annotations represent 5′Nuc gene orthologs; purple gene annotations represent sgp3 gene orthologs and the blue gene annotations an apyrase-like encoding gene. The broken rectangular bars on the G. brevipalpis scaffold indicate that the sequence could not be determined due to poor sequence/assembly quality. b Schematic representation of sgp3 gene structure in tsetse species. The K(.) denotes a repetition of a lysine (K) and another amino acid (glutamic acid, glycine, alanine, serine, asparagine or arginine). The green oval represents a repetitive motif found in Morsitans sub-genus; the red oval represents a repetitive motif found in Palpalis group. The dashed line indicates a partial motif present. For each of the two motifs the consensus sequence is shown in the right by a Logo sequence. The poor sequence/assembly quality of the G. brevipalpis scaffold prevented inclusion of this orthology in the analysis
Fig. 12
Fig. 12
Phylogenetic and sequence divergence analysis of Glossina vision-associated proteins. Phylogenetic and sequence conservation analysis of the vision-associated Rhodopsin G-protein coupled receptor genes in Glossina and orthologous sequences in other insects. a Phylogenetic analysis of Rhodopsin protein sequences. b Pairwise analysis of sequence divergence between M. domestica and Glossina species and within the Glossina genus

References

    1. Lyons M. The colonial disease. A social history of sleeping sickness in norther Zaire, 1900–1940. Cambridge UK: Cambridge University Press; 1992.
    1. Odiit M, Coleman PG, Liu WC, McDermott JJ, Fevre EM, Welburn SC, Woolhouse ME. Quantifying the level of under-detection of Trypanosoma brucei rhodesiense sleeping sickness cases. Tropical Med Int Health. 2005;10:840–849. doi: 10.1111/j.1365-3156.2005.01470.x. - DOI - PubMed
    1. Franco JR, Cecchi G, Priotto G, Paone M, Diarra A, Grout L, Simarro PP, Zhao W, Argaw D. Monitoring the elimination of human African trypanosomiasis: update to 2016. PLoS Negl Trop Dis. 2018;12:e0006890. doi: 10.1371/journal.pntd.0006890. - DOI - PMC - PubMed
    1. Franco JR, Simarro PP, Diarra A, Ruiz-Postigo JA, Jannin JG. The journey towards elimination of gambiense human African trypanosomiasis: not far, nor easy. Parasitology. 2014;141:748–760. doi: 10.1017/S0031182013002102. - DOI - PubMed
    1. Steelman CD. Effects of external and internal arthropod parasites on domestic livestock production. Annu Rev Entomol. 1976;21:155–178. doi: 10.1146/annurev.en.21.010176.001103. - DOI - PubMed

Publication types

MeSH terms