

Forecasting influenza activity using self-adaptive AI model and multi-source data in Chongqing, China
- PMID: 31477561
- PMCID: PMC6796527
- DOI: 10.1016/j.ebiom.2019.08.024
Forecasting influenza activity using self-adaptive AI model and multi-source data in Chongqing, China
Abstract
Background: Early detection of influenza activity followed by timely response is a critical component of preparedness for seasonal influenza epidemic and influenza pandemic. However, most relevant studies were conducted at the regional or national level with regular seasonal influenza trends. There are few feasible strategies to forecast influenza activity at the local level with irregular trends.
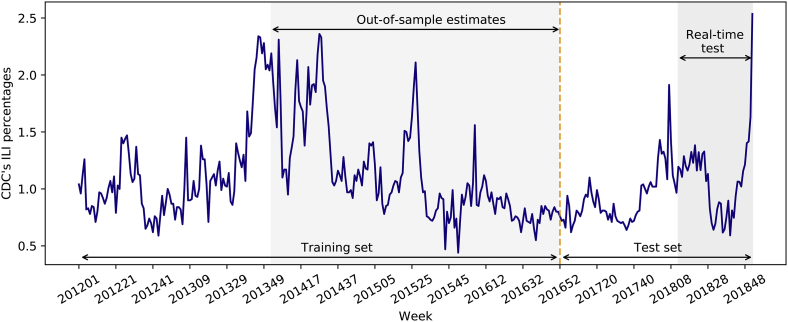
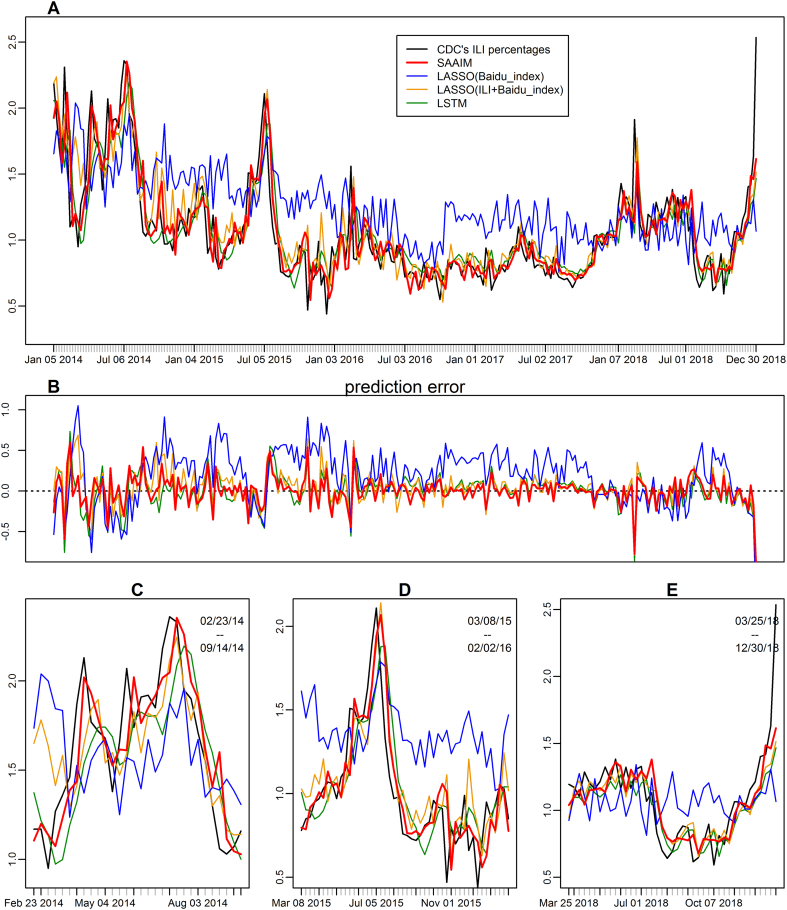
Methods: Multi-source electronic data, including historical percentage of influenza-like illness (ILI%), weather data, Baidu search index and Sina Weibo data of Chongqing, China, were collected and integrated into an innovative Self-adaptive AI Model (SAAIM), which was constructed by integrating Seasonal Autoregressive Integrated Moving Average model and XGBoost model using a self-adaptive weight adjustment mechanism. SAAIM was applied to ILI% forecast in Chongqing from 2017 to 2018, of which the performance was compared with three previously available models on forecasting.
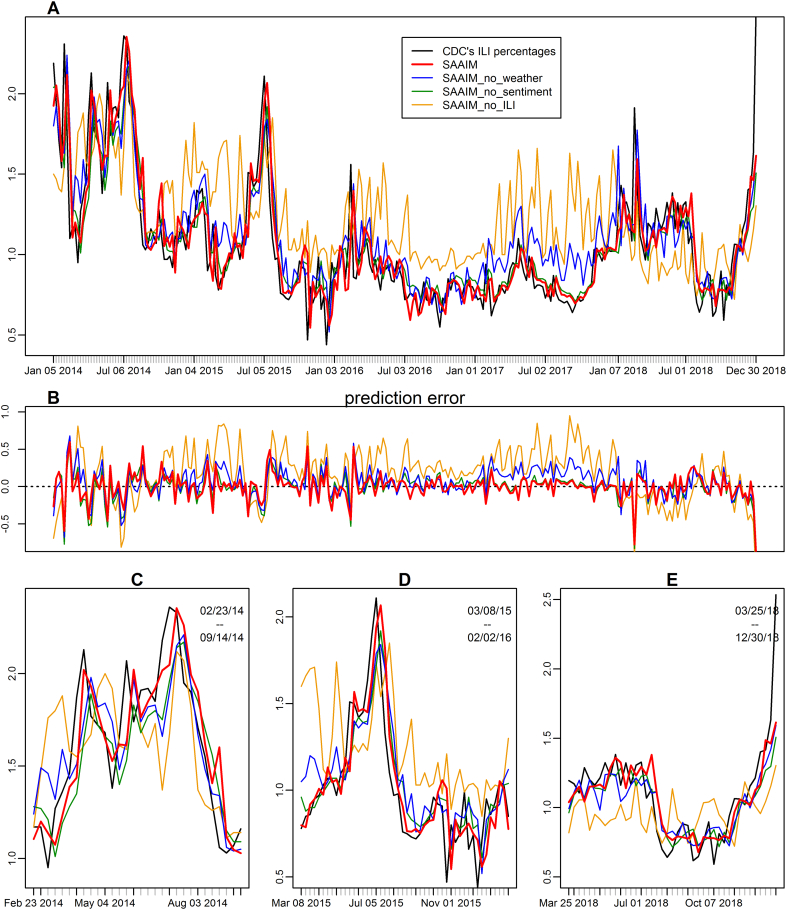
Findings: ILI% showed an irregular seasonal trend from 2012 to 2018 in Chongqing. Compared with three reference models, SAAIM achieved the best performance on forecasting ILI% of Chongqing with the mean absolute percentage error (MAPE) of 11·9%, 7·5%, and 11·9% during the periods of the year 2014-2016, 2017, and 2018 respectively. Among the three categories of source data, historical influenza activity contributed the most to the forecast accuracy by decreasing the MAPE by 19·6%, 43·1%, and 11·1%, followed by weather information (MAPE reduced by 3·3%, 17·1%, and 2·2%), and Internet-related public sentiment data (MAPE reduced by 1·1%, 0·9%, and 1·3%).
Interpretation: Accurate influenza forecast in areas with irregular seasonal influenza trends can be made by SAAIM with multi-source electronic data.
Keywords: AI; Forecast; Influenza; Influenza-like illness; Multi-source electronic data.
Copyright © 2019 The Authors. Published by Elsevier B.V. All rights reserved.
Conflict of interest statement
The authors declare that they have no competing interests.
Figures
Similar articles
-
Using Google Flu Trends data in forecasting influenza-like-illness related ED visits in Omaha, Nebraska.Am J Emerg Med. 2014 Sep;32(9):1016-23. doi: 10.1016/j.ajem.2014.05.052. Epub 2014 Jun 12. Am J Emerg Med. 2014. PMID: 25037278
-
Forecasting influenza in Hong Kong with Google search queries and statistical model fusion.PLoS One. 2017 May 2;12(5):e0176690. doi: 10.1371/journal.pone.0176690. eCollection 2017. PLoS One. 2017. PMID: 28464015 Free PMC article.
-
Forecasting seasonal influenza-like illness in South Korea after 2 and 30 weeks using Google Trends and influenza data from Argentina.PLoS One. 2020 Jul 16;15(7):e0233855. doi: 10.1371/journal.pone.0233855. eCollection 2020. PLoS One. 2020. PMID: 32673312 Free PMC article.
-
[A review on the preparedness plans on influenza pandemics, by WHO and China: the current status and development].Zhonghua Liu Xing Bing Xue Za Zhi. 2018 Aug 10;39(8):1032-1035. doi: 10.3760/cma.j.issn.0254-6450.2018.08.004. Zhonghua Liu Xing Bing Xue Za Zhi. 2018. PMID: 30180423 Review. Chinese.
-
Application progress of ensemble forecast technology in influenza forecast based on infectious disease model.Front Public Health. 2023 Dec 15;11:1335499. doi: 10.3389/fpubh.2023.1335499. eCollection 2023. Front Public Health. 2023. PMID: 38162616 Free PMC article. Review.
Cited by
-
Application of big data and artificial intelligence in epidemic surveillance and containment.Intell Med. 2023 Feb;3(1):36-43. doi: 10.1016/j.imed.2022.10.003. Epub 2022 Nov 5. Intell Med. 2023. PMID: 36373090 Free PMC article. Review.
-
Long Short-term Memory-Based Prediction of the Spread of Influenza-Like Illness Leveraging Surveillance, Weather, and Twitter Data: Model Development and Validation.J Med Internet Res. 2023 Feb 6;25:e42519. doi: 10.2196/42519. J Med Internet Res. 2023. PMID: 36745490 Free PMC article.
-
Digital health interventions for COVID-19 in China: a retrospective analysis.Intell Med. 2021 May;1(1):29-36. doi: 10.1016/j.imed.2021.03.001. Epub 2021 Apr 28. Intell Med. 2021. PMID: 34447602 Free PMC article.
-
Prediction of daily COVID-19 cases in European countries using automatic ARIMA model.J Public Health Res. 2020 Jul 8;9(3):1765. doi: 10.4081/jphr.2020.1765. eCollection 2020 Jul 28. J Public Health Res. 2020. PMID: 32874964 Free PMC article.
-
Influenza Epidemic Trend Surveillance and Prediction Based on Search Engine Data: Deep Learning Model Study.J Med Internet Res. 2023 Oct 17;25:e45085. doi: 10.2196/45085. J Med Internet Res. 2023. PMID: 37847532 Free PMC article.
References
-
- Dawood F.S., Iuliano A.D., Reed C., Meltzer M.I., Shay D.K., Cheng P.Y. Estimated global mortality associated with the first 12 months of 2009 pandemic influenza A H1N1 virus circulation: a modelling study. Lancet Infect Dis. 2012;12(9):687–695. - PubMed
MeSH terms
LinkOut - more resources
Full Text Sources
Medical
