. 2019 Sep 2;10(1):3956.
doi: 10.1038/s41467-019-11753-1.

The structural basis of lipid scrambling and inactivation in the endoplasmic reticulum scramblase TMEM16K

Affiliations

The structural basis of lipid scrambling and inactivation in the endoplasmic reticulum scramblase TMEM16K

Simon R Bushell et al. Nat Commun. .

Abstract

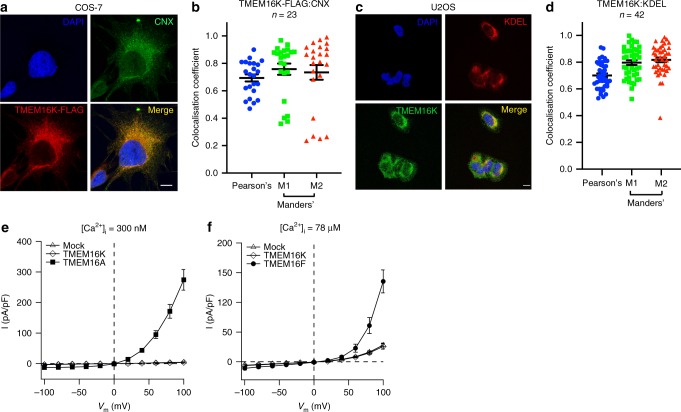
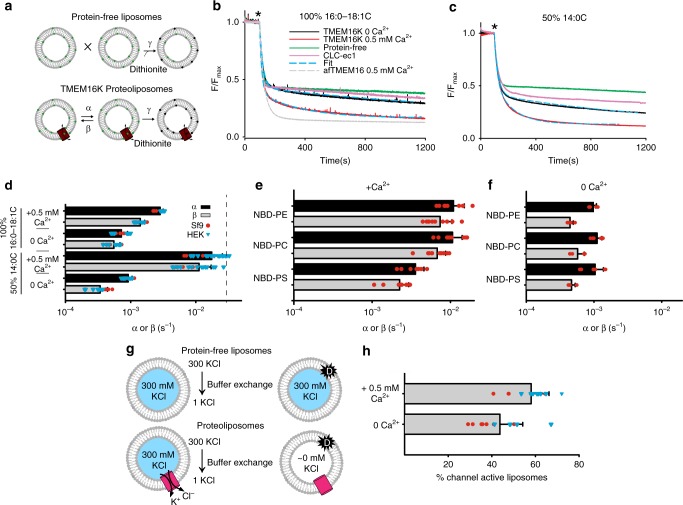
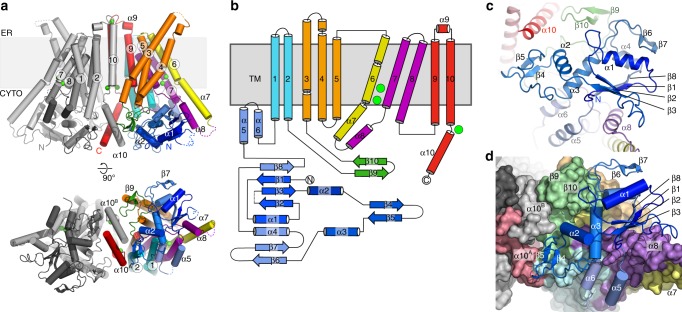
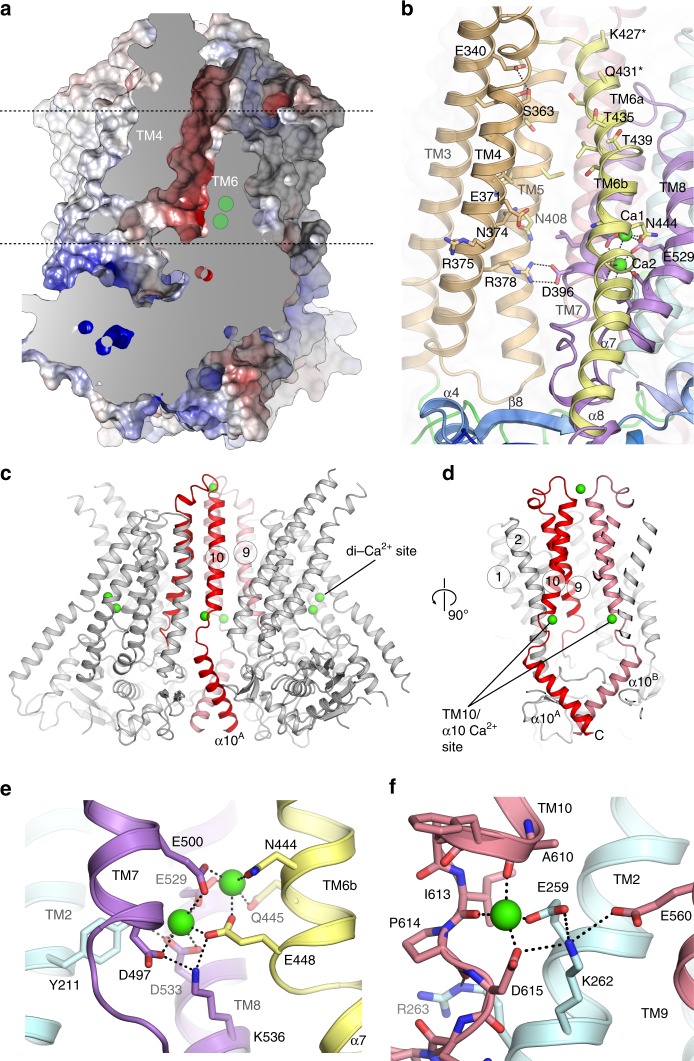
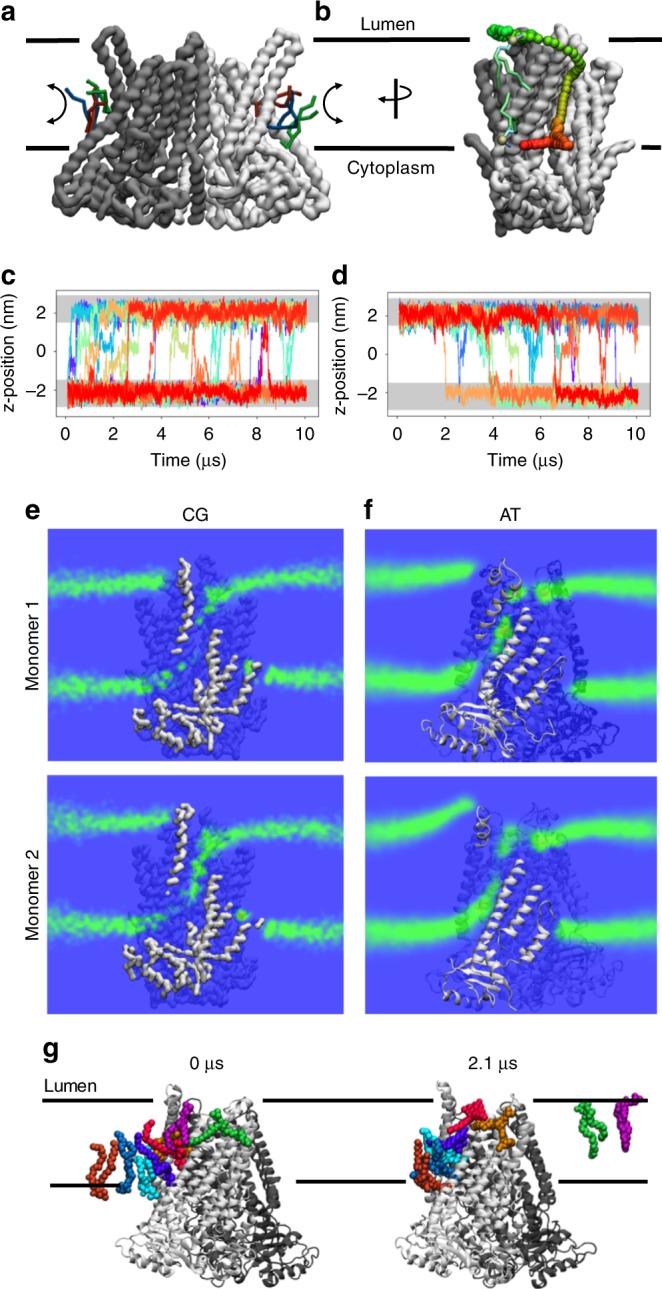
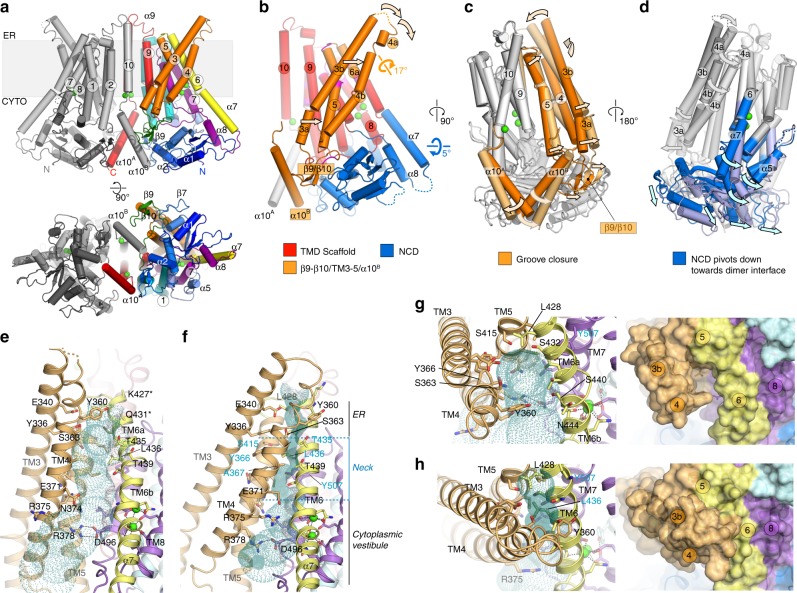
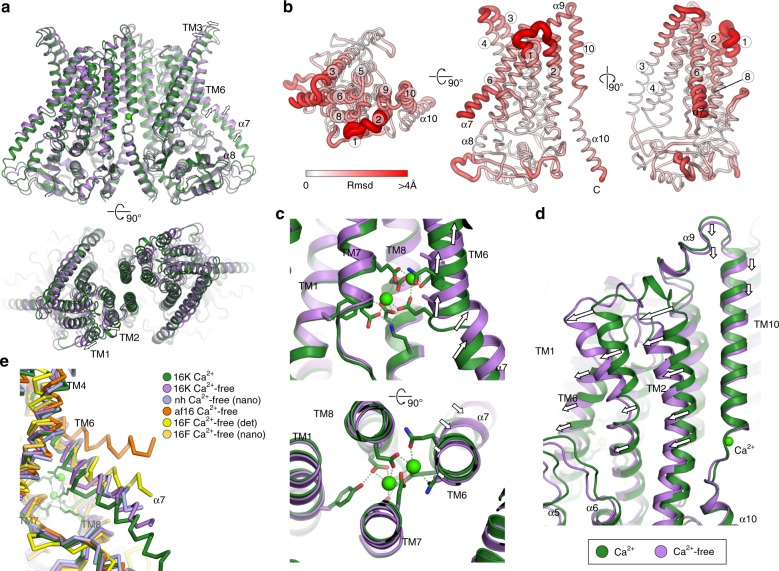
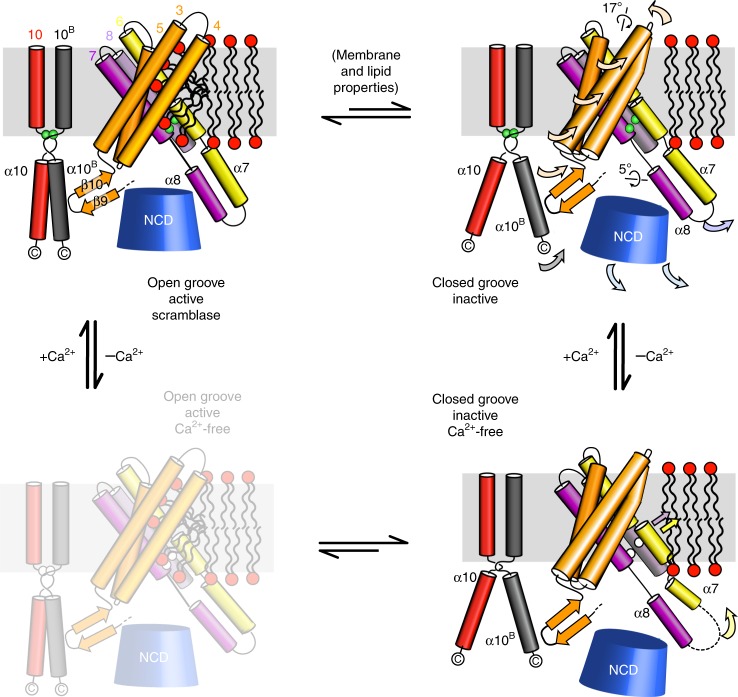
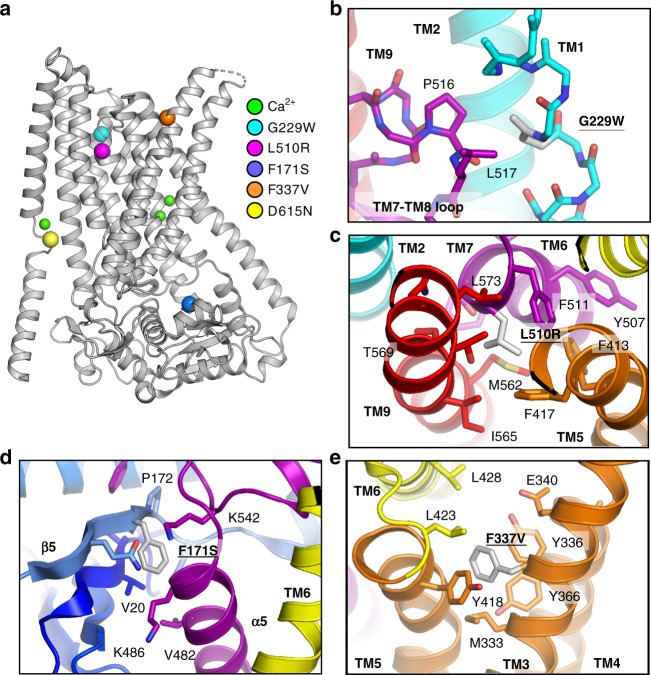
Membranes in cells have defined distributions of lipids in each leaflet, controlled by lipid scramblases and flip/floppases. However, for some intracellular membranes such as the endoplasmic reticulum (ER) the scramblases have not been identified. Members of the TMEM16 family have either lipid scramblase or chloride channel activity. Although TMEM16K is widely distributed and associated with the neurological disorder autosomal recessive spinocerebellar ataxia type 10 (SCAR10), its location in cells, function and structure are largely uncharacterised. Here we show that TMEM16K is an ER-resident lipid scramblase with a requirement for short chain lipids and calcium for robust activity. Crystal structures of TMEM16K show a scramblase fold, with an open lipid transporting groove. Additional cryo-EM structures reveal extensive conformational changes from the cytoplasmic to the ER side of the membrane, giving a state with a closed lipid permeation pathway. Molecular dynamics simulations showed that the open-groove conformation is necessary for scramblase activity.


Conflict of interest statement

The authors declare no competing interests.

Figures

Fig. 1
Fig. 1
TMEM16K localises predominantly to the ER. a Representative confocal images of COS-7 cells expressing TMEM16K-TEV-His10-FLAG. Cells were stained for TMEM16K (anti-FLAG: red), the ER resident protein calnexin (CNX: green) and nuclei (DAPI: blue). In the merged panel (lower right), the degree of TMEM16K and CNX overlap is shown (yellow). Scale bars = 10 μm; magnification: ×63. b Pearson's correlation and Manders' (M1 and M2) overlap coefficients determined for TMEM16K (FLAG) and CNX. Mean and s.e.m. are shown, n = 23 cells. c Representative confocal images of U2OS cells stained using antibodies to endogenous TMEM16K (green), the ER resident protein signature KDEL (red), along with DAPI staining of nuclei and the merge. Scale bars = 10 µm; magnification: ×63. d Quantitative analysis of TMEM16K and KDEL colocalisation in U2OS cells (as in b). Mean and s.e.m. are shown, n = 42. e Whole‐cell current versus voltage relationships for mock-transfected HEK‐293T cells (Mock, n = 15) or cells expressing TMEM16A (n = 13) or TMEM16K (n = 13) are represented as mean ± s.e.m. [Ca2+]i was 300 nM. f Whole‐cell current versus voltage relationships for mock-transfected HEK‐293T cells (Mock, n = 12) or cells expressing TMEM16F (n = 17) or TMEM16K (n = 11) are represented as mean ± s.e.m. [Ca2+]i was 78 μM. Source data are provided as a Source Data file
Fig. 2
Fig. 2
Characterisation of TMEM16K Ca2+ activated scramblase activity. a Schematic for the dithionite-based phospholipid scramblase activity. b, c Representative time courses of the dithionite-induced fluorescence decay in liposomes made from b 100% 16:0–18:1 C acyl chains or c 50% 14:0 C acyl chains with protein-free liposomes (green), TMEM16K proteoliposomes with 0.5 mM (red) or without (black) Ca2+, or in proteoliposomes containing the CLC-ec1 H+/Cl exchanger that does not scramble (pink). Cyan dashed lines represent the fit to Eq. 1, the analytical solution of the scheme in (a). * denotes addition of dithionite. Traces shown here are from Sf9-expressed TMEM16K. d Scrambling forward (α) and reverse (β) rate constants for TMEM16K at 0.5 mM, and 0 mM Ca2+ comparing liposomes composed of 100% 16:0–18:1 C acyl chains (top bars) or 50% 14:0 C acyl chains (bottom bars). Individual rate constants are shown as red circles (from Sf9-expressed TMEM16K) or blue triangles (from HEK-expressed TMEM16K). The dashed line indicates the rate for afTMEM16 in 0.5 mM Ca2+. e, f Scrambling forward (α) and reverse (β) rate constants for TMEM16K at 0.5 mM (a), and 0 mM Ca2+ (b) in liposomes composed of 50% 14:0 C acyl chains with different NBD-labelled lipids (NBD-PE, PC, or PS). Individual rate constants are shown as red circles. All data in (e) and (f) are from Sf9-expressed wild-type TMEM16K. All rate constants are reported as the mean ± SD. g Schematic for the non-selective channel activity assay. h Fraction of the liposomes containing at least one active TMEM16K channel in the presence of 0.5 mM Ca2+ or without Ca2+ as red circles (from Sf9-expressed TMEM16K) or blue triangles (from HEK-expressed TMEM16K). All data are reported as the mean ± SD. Source data are provided as a Source Data file
Fig. 3
Fig. 3
TMEM16K fold and cytoplasmic domain in the lipid scramblase conformation. a The structure of hTMEM16K viewed from the membrane plane and cytoplasm. In chain A the secondary structural elements are coloured as follows: the cytoplasmic domain (blue), TM1 and 2 (cyan), the β9−β10 hairpin (green), TM3, 4, 5 (orange), TM6 and α7 (yellow), α8, TM7 and 8 (purple), TM9, TM10 and α10 (red). Chain B is coloured grey. Ca2+ are coloured bright green. b TMEM16K secondary structure elements, coloured according to (a). c Cytoplasmic domain (blue), α7 and α8 (yellow/purple) and α10 (red) of TMEM16K viewed from the cytoplasm. d Interactions of the cytoplasmic domain with the TM domain and the C-terminal helices (shown as a molecular surface coloured as in (a), viewed from the cytoplasm
Fig. 4
Fig. 4
Structure of the TM domain region, scramblase groove and Ca2+ binding sites. a Sliced molecular surface showing TMEM16K’s scramblase groove. Approximate positions of membrane and two Ca2+ ion site indicated by dotted lines and green circles. b Ribbon representation of the groove (coloured as per Fig. 3b). Selected residues that were in contact with the lipid headgroups in MD simulations are shown as sticks and labelled. c Location of the Ca2+-binding sites (green) in TMEM16K, and the dimer interface formed by TM10 and α10 contains the third Ca2+ ion, in a second Ca2+-binding site. c, d Ribbon representation of dimer highlighting positions of TM10-α10 helices (red). Zoomed in view of e the TM6-8 two Ca2+-binding site and of f the TM10/ α10 Ca2+-binding site
Fig. 5
Fig. 5
CG and atomistic MD simulations of TMEM16K structures reveal lipid scrambling. a View of CG TMEM16K after ~8 μs simulation. The protein backbone surface (grey and white) and scrambling lipid molecules (blue, red and green sticks) are shown, b as panel (a), but rotated by 90o and showing the pathway of a single lipid. The before and after poses are shown as green, blue and cyan sticks, with the phosphate head group particle shown as a gold/grey sphere. The scrambling pathway is denoted by red-to-green coloured spheres from cytoplasmic to luminal side. c, d Traces showing quantification of CG lipid scrambling, across the z-axis, with the position of phosphate beads in each membrane leaflet shown in light grey. The traces show c lipids that flip from cytoplasmic to lumenal leaflets, and those that flip in the opposite direction, d, e Density of lipid headgroups along a plane through the membrane, as computed over 10 µs of CG simulation. Density is scaled from blue to green, with a scrambling pathway clearly visible along the TMEM16K hydrophobic groove. f As panel (e) but of 2.1 µs of atomistic simulation, and calculating the densities of all non-hydrogen head group atoms. The densities reveal a similar pattern to the CG data. g Lipids engaged with the TMEM16K translocation pathway in a 2.1 µs atomistic simulation, coloured as per panel (a)
Fig. 6
Fig. 6
Cryo-EM structure reveals a closed scramblase conformation of TMEM16K. a Structure of TMEM16K in 430 nM Ca2+ obtained by cryo-EM. Structural elements are coloured and viewed as in Fig. 2a. b Scaffold (red), TM4-6/α10B (orange) and NCD/α7-α8 regions (blue) mapped onto the monomer fold as derived from domain motion analysis. c, d Relative motions of c the TM4-6/α10B region (orange) and d the NCD/α7-α8 region, with the domains from the open groove crystal (dark colours) and closed groove 430 nM Ca2+ cryo-EM (lighter colours) structures viewed looking onto the c dimer interface and d scramblase groove. eh Schematic representation of the scramblase groove in the crystal structure (e, g) and 430 nM Ca2+ structure (f, h). The groove is viewed perpendicular to the membrane normal (e, f) and from the ER luminal face (g, h). Pale green dotted surface represents the groove/channel profile as calculated by HOLE
Fig. 7
Fig. 7
Comparison of the Ca2+-free and 2 mM cryo-EM structures of TMEM16K. a Overall structure of Ca2+-free state (purple), superimposed on the Ca2+ structure (green). b Global conformational differences between Ca2+ and Ca2+-free structures. Schematic representations of the r.m.s. deviation (rmsd) in mainchain atomic positions mapped onto the monomer Ca2+-free structure. Monomers were superposed using all atoms with LSQKAB (CCP4). The monomer is viewed from the luminal face (left), perpendicular to the membrane normal (middle) and scramblase groove face (right). The thickness and colour of the tube reflects the magnitude of the r.m.s.d. between the two structures. The main differences are localised in TM1/2, TM6, α7, TM9 and TM10. c View of the two Ca2+-binding site, showing overall movement of TM6. d View of the TM10-α10 Ca2+-binding site, highlighting the lateral movement of TM1-2, TM6 away from the dimer interface. e Comparison of the Ca2+-free structure with those from nhTMEM16 (PDB: 6qm4), afTMEM16 (PDB: 6dz7), and mTMEM16F in detergent (PDB: 6qpb) and nanodiscs (PDB: 6qpi). The 2 mM TMEM16K Ca2+ structure with an intact dual calcium binding site (green) is shown for reference
Fig. 8
Fig. 8
Schematic of conformational changes in TMEM16K. Schematic summary of TMEM16K conformational states, with the N-terminal cytoplasmic domain (NCD) shown as a blue cone and lipids with headgroups (red) and aliphatic chains (black). Conformations for which the structure is unknown are shown with higher transparency, and are included for completeness of the schema
Fig. 9
Fig. 9
Missense variants in TMEM16K found in patients with SCAR10 ataxia. a Overview of TMEM16K with disease-associated missense mutation locations shown as coloured spheres and Ca2+ ions shown as smaller green spheres. Local environment for the disease associated mutations: b Gly229Trp, c Leu510Arg, d Phe171Ser and e Phe337Val

References

    1. van Meer G, et al. Membrane lipids: where they are and how they behave. Nat. Rev. Mol. Cell Biol. 2008;9:112. doi: 10.1038/nrm2330. - DOI - PMC - PubMed
    1. Chauhan N, et al. Lipid topogenesis-35years on. Biochim. Biophys. Acta. 2016;1861:757–766. doi: 10.1016/j.bbalip.2016.02.025. - DOI - PMC - PubMed
    1. Caputo A, et al. TMEM16A, a membrane protein associated with calcium-dependent chloride channel activity. Science. 2008;322:590–594. doi: 10.1126/science.1163518. - DOI - PubMed
    1. Schroeder BC, et al. Expression cloning of TMEM16A as a calcium-activated chloride channel subunit. Cell. 2008;134:1019–1029. doi: 10.1016/j.cell.2008.09.003. - DOI - PMC - PubMed
    1. Yang YD, et al. TMEM16A confers receptor-activated calcium-dependent chloride conductance. Nature. 2008;455:1210–1215. doi: 10.1038/nature07313. - DOI - PubMed

Publication types

MeSH terms

LinkOut - more resources