. 2019 Sep 2;10(1):3928.
doi: 10.1038/s41467-019-11788-4.

Macrophage spatial heterogeneity in gastric cancer defined by multiplex immunohistochemistry

Affiliations

Macrophage spatial heterogeneity in gastric cancer defined by multiplex immunohistochemistry

Yu-Kuan Huang et al. Nat Commun. .

Abstract

Tumor-associated macrophages (TAMs), one of the most abundant immune components in gastric cancer (GC), are difficult to characterize due to their heterogeneity. Multiple approaches have been used to elucidate the issue, however, due to the tissue-destructive nature of most of these methods, the spatial distribution of TAMs in situ remains unclear. Here we probe the relationship between tumor context and TAM heterogeneity by multiplex immunohistochemistry of 56 human GC cases. Using distinct expression marker profiles on TAMs, we report seven predominant populations distributed between tumor and non-tumor tissue. TAM population-associated gene signatures reflect their heterogeneity and polarization in situ. Increased density of CD163+ (CD206-) TAMs with concurrent high CD68 expression is associated with upregulated immune-signaling and improved patient survival by univariate, but not multivariate analysis. CD68-only and CD206+ TAMs are correlated with high PDL1 expression.


Conflict of interest statement

The authors declare no competing interests.

Figures
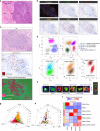
Fig. 1
Fig. 1
Identification and characterization of macrophage populations. a Regions of interest (ROIs): adjacent normal tissue (N), margin (M), edge (E), and core (C). Scale bar: 100 µm. b Representative composite and single-stained IHC images of the multiplex IHC panel. Scale bar: 100 µm. c H&E, single-stained AE1AE3, and tissue-component segmentation of the same region. Scale bar: 100 µm. d Multiplex IHC panel design: gating strategy for each TAM population (numbered). e Seven major TAM populations. Positivity (+) of corresponding markers and relative intensity between populations is indicated. Scale bar: 10 µm. f Marker signatures used for TAM population characterization in patient samples (n = 35). Relative normalized intensity: relative original intensity of each marker divided by exposure time. g, h 3D plots showing the intensities of TAM populations from (g) single cells (n = ~8.5 × 106 from 56 patients) and (h) averaged per patient (n = 35). Unit of axis: Normalized intensity. Key: Orange: CD68+CD206++, Brown: CD68+CD206+, Green: CD68+, Yellow: CD68+IRF8+, Dark red: CD68++CD163+, Red: CD68+CD163+, and Purple: CD68+CD163+CD206+. TAM populations are as numbered in (d) and (e)
Fig. 2
Fig. 2
Distinct distribution of TAM population densities across regions of interest. ac Spatial distribution of TAM populations: a Overall TAM density, b M1-like to M2-like ratio, and c Density of each TAM population. Core (red circle): n = 46, edge (green triangle): n = 30, margin (blue square): n = 26, normal (white circle): n = 28. d, e Density of selected TAM populations between the Tumor-nest (dark red square) and Stroma (dark green triangle) areas (d) among the ROIs and (e) in matched (dash line) patient samples. Box and whiskers represent mean ± 10–90 percentile. Each point represents one patient. *p < 0.05, **p < 0.01, ***p < 0.001 and not significant (n.s.). Mann–Whitney U test
Fig. 3
Fig. 3
TAM composition is associated with their proximity to tumor cells. a Schematic illustration of the distance analysis involving reference cell (RC) and nearest cell (NC). Each RC was paired with a neighboring NC in 10 µm increments from its nucleus. Effective percentage represents the proportion of RC that had a paired NC in a given distance. b Median distance of TAM populations (RC) to tumor cell (NC). Box and whiskers represent mean ± 10–90 percentile. Each dot represents one patient. Core: n = 46. *p < 0.05, **p < 0.01, ***p < 0.001 and not significant (n.s.). Mann–Whitney U test comparing between TAM populations. Circle: M1-like macrophages. Triangle: M2-like macrophages. c, d Effective percentage of TAM populations in the core (c) within 10 µm increments and (d) within 0–20 µm. e, f Overall survival (OS) and relapse-free survival (RFS) classified by the (e) overall CD68++CD163+ TAM density and the (f) effective density (0–10 µm) in the tumor core. Effective density (0–10 µm): the number of TAM that had a tumor cell within a 10 µm radius. Upper tercile (density > 2/3 of the patients in the cohort; red line), Lower tercile (density ≤ 1/3 of patients in the cohort; blue dash line). Log-rank (Mantel-Cox) test
Fig. 4
Fig. 4
High CD68++CD163+ TAM density reflects a more inflamed microenvironment and enhanced immune-cell infiltration. a Spearman correlation of TAM population densities in the tumor core. Red/white/blue: positive/no/negative correlation. *p < 0.05. b Unsupervised clustering of TAM-associated environmental signatures and associated pathways. List of genes that were significantly correlated with each TAM population density of a matched patient sample (n = 34) were identified with the Spearman correlation. Red/black/blue: positive/no/negative correlation. *FDR < 0.05 (Benjamini-Hochberg). c Patients in the MAUGIC cohort (n = 99) grouped using a refined CD68++CD163+ TAM signature (gene expression most significantly correlated with cell density, p < 0.001; Spearman correlation). Key: relative gene expression. d Validation of patient overall survival classified by the refined CD68++CD163+ TAM signature using KMplot. Above (red) and below (black) the median expression of the gene signature. Log-rank (Mantel-Cox) test. e Differentially expressed macrophage-associated genes, and f inflammation scores between the high–low patient groups in the MAUGIC cohort. Box and whiskers represent mean ± 10–90 percentile. **p < 0.01. Mann–Whitney U test
Fig. 5
Fig. 5
PDL1 expression in GC is both TAM and GC subtype associated. a Representative images of PDL1 expression in the tumor core. Scale bar: 100 µm. b Mean PDL1 intensity per patient (n = 35) for each TAM population. Error bars represent mean ± SD. c Distribution of PDL1 expression on individual cells in a sampling cohort regardless of cell types. Equal number (104) of cells per patient (n = 56, all ROIs included) were randomly selected to normalize between sample sizes. Cells were pooled as a sampling cohort. 32% of the cohort was defined as PDL1+ with the mean expression of the cohort. d Cell number and percentage of different PDL1 intensity expressing cells in each cell type. Error bars represent mean ± SD of five independent randomly selected subsampling cohorts. e PDL1 expression patterns of CD206+ TAMs: Cell number and percentage in each population. Error bars represent mean ± SD. n = 5. f Cell number and g median PDL1 expression on TAM populations in patients grouped by different GC subtypes. Box and whiskers represent mean ± 10–90 percentile. Each point/line represents one patient. *p < 0.05, **p < 0.01, ***p < 0.001, and not significant (n.s.) Mann–Whitney U test
Fig. 6
Fig. 6
Macrophage marker expression differed between the tumor-nest and stroma. a Tumor-nest (red, T) and stroma (green, S) areas in each image were segmented using inForm software (see also Fig. 1b). Intensity change of markers between the TS regions was determined by randomly assigning equal number of cells (n = 500, minimum number available between samples) from both areas per patient (core). The marker of interest was plotted with the mean (red) and the confidence intervals (gray). The interface between TS regions was defined as point zero, positive and negative values on the x-axis indicate the tumor cell and the stroma region, respectively. Thresholds were applied to define the positivity of markers. Quadrants: I: cell type A located in the tumor-nest and is positive (+) of the marker tested. II: stroma, positive. III: stroma, negative (‒). IV: tumor, negative. b Change in PDL1 expression with distance from the TS interface for each macrophage population. Threshold: mean PDL1 expression defined in Fig. 5c. ce Change of (c) CD68, (d) CD163, and (e) CD206 expression with distance from the TS interface. Thresholds: mean expressions of CD68, CD163, and CD206 on the tumor and non-macrophage cells (Other)
Fig. 7
Fig. 7
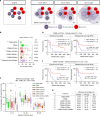
Schematic model of spatial macrophage heterogeneity in anatomic regions in gastric cancer. A proposed model suggesting that TAM density and marker expression varies between GC sample regions. Distinct marker expression profiles on TAMs were associated with their population disparity between the tumor site and non-tumor tissue and between the tumor-nest and stroma. TAM populations were associated with signature pathways which may help inform of their function and polarization status. Similar trend of marker changes on TAMs were observed between the tumor-nest and stromal compartments within different tumor regions (core, edge, or margin). Mϕ: macrophage. ECM: extra-cellular matrix

References

    1. Bray F, et al. Global cancer statistics 2018: GLOBOCAN estimates of incidence and mortality worldwide for 36 cancers in 185 countries. CA Cancer J. Clin. 2018;68:394–424. doi: 10.3322/caac.21492. - DOI - PubMed
    1. Cristescu R, et al. Molecular analysis of gastric cancer identifies subtypes associated with distinct clinical outcomes. Nat. Med. 2015;21:449–456. doi: 10.1038/nm.3850. - DOI - PubMed
    1. Lauren P. The two histological main types of gastric carcinoma: diffuse and so-called intestinal-type carcinoma. An attempt at a histo-clinical classification. Acta Pathol. Microbiol Scand. 1965;64:31–49. doi: 10.1111/apm.1965.64.1.31. - DOI - PubMed
    1. Cancer Genome Atlas Research, N. Comprehensive molecular characterization of gastric adenocarcinoma. Nature. 2014;513:202–209. doi: 10.1038/nature13480. - DOI - PMC - PubMed
    1. Muro K, et al. Pembrolizumab for patients with PD-L1-positive advanced gastric cancer (KEYNOTE-012): a multicentre, open-label, phase 1b trial. Lancet Oncol. 2016;17:717–726. doi: 10.1016/S1470-2045(16)00175-3. - DOI - PubMed

Publication types

MeSH terms