. 2019 Sep 2;10(1):3840.
doi: 10.1038/s41467-019-11721-9.

Single-cell transcriptomics reveals multi-step adaptations to endocrine therapy

Affiliations

Single-cell transcriptomics reveals multi-step adaptations to endocrine therapy

Sung Pil Hong et al. Nat Commun. .

Abstract

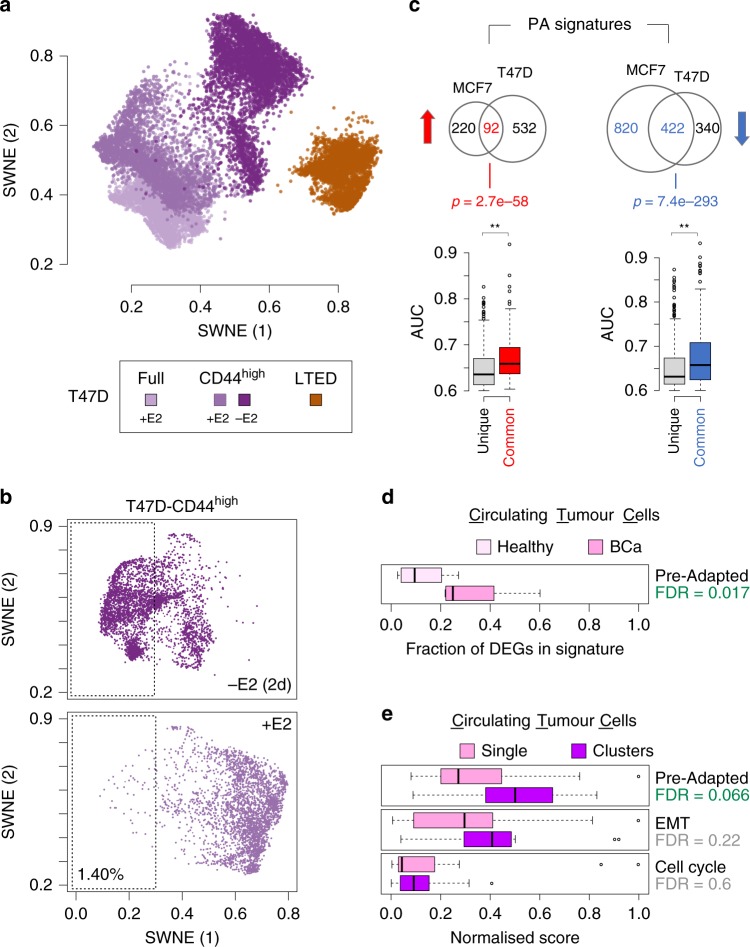
Resistant tumours are thought to arise from the action of Darwinian selection on genetically heterogenous cancer cell populations. However, simple clonal selection is inadequate to describe the late relapses often characterising luminal breast cancers treated with endocrine therapy (ET), suggesting a more complex interplay between genetic and non-genetic factors. Here, we dissect the contributions of clonal genetic diversity and transcriptional plasticity during the early and late phases of ET at single-cell resolution. Using single-cell RNA-sequencing and imaging we disentangle the transcriptional variability of plastic cells and define a rare subpopulation of pre-adapted (PA) cells which undergoes further transcriptomic reprogramming and copy number changes to acquire full resistance. We find evidence for sub-clonal expression of a PA signature in primary tumours and for dominant expression in clustered circulating tumour cells. We propose a multi-step model for ET resistance development and advocate the use of stage-specific biomarkers.


Conflict of interest statement

One of the authors, Y.L., is an editor on the staff of Nature Communications, but was not in any way involved in the journal review process. All the other authors declare no competing interests.

Figures

Fig. 1
Fig. 1
Absence of fully resistant clones in treatment-naive cells. a Schematic representation of the in vitro approach (bottom), which mimics the development of resistance to aromatase inhibitors (AI) in patients. b Bi-dimensional representation of 3159 single-cell transcriptomes (1125 MCF7 and 1944 LTED) (SWNE; k = 16). c Copy number profiles of the cells shown in (b), as estimated from scRNA-seq profiles. The data shown as heatmap and as dendrogram (hierarchical clustering; Ward’s method; Euclidean distance). d Distribution of normalised expression levels for selected gene sets, by cluster of cells (as defined in b). Area Under the Curve calculated using the cluster with higher median gene expression as a positive set. Box plots show median, interquartile values, range and outliers (individual points). *p <= 1e-5, **p <= 1e-10, *** p <= 2.2e-16 (Kruskal–Wallis test)
Fig. 2
Fig. 2
Phenotypic heterogeneity of luminal breast cancer cells. a CD44 expression in neo-adjuvant AI-treated patients (pre- and post- treatment; p-value from two-tailed paired t test). b Same as (a), but in matched AI-treated primary-metastatic (p-value from Wilcoxon signed-rank test). c Reconstitution experiments from sorted MCF7-CD44GFP-high or MCF7-CD44GFP-low cells, or the full population. d Same as (c), but using sorted LTED-CD44GFP-high or LTED-CD44GFP-low cells, or the full population. e Survival curves of MCF7-CD44GFP-high and MCF7-CD44GFP-low cells in oestrogen-deprived (-E2) conditions. f Single-cell plating experiments in oestrogen-supplemented (+E2) or deprived conditions (−E2) for 30 days. From top to the bottom: (i) schematic representation of the results; (ii) representative pictures of single wells after 30 days (scale bar = 1000 μm); (iii) immunofluorescence staining highlighting CD44 expression (scale bar = 200 μm); (iv) summary statistics. g Cell-cycle dynamics of MCF7-CD44GFP-high and MCF7-CD44GFP-low cells inferred from time-lapse imaging. The length of the cell cycle and percentage of cell entering the cell cycle are indicated for both oestrogen-supplemented (+E2; top) and deprived conditions (−E2; bottom)
Fig. 3
Fig. 3
Single-cell transcriptomics reveals heterogeneity of plastic cells. a Schematic representation of the strategy to sort MCF7-CD44GFP-high (CD44high) and MCF7-CD44GFP-low (CD44low) cells (left) along with the results of dimensionality reduction for single-cell transcriptomes (right) (SWNE, k = 22); percentage of extreme outliers in the two subpopulations indicated in the bottom right corner. b The number of upregulated genes in the indicated comparisons ( q-value <= 0.05; AUC >= 0.6). c Cell–cell heterogeneity within CD44high and CD44low subpopulations. Box plots show median, interquartile values, range and outliers (individual points). d Regulatory networks reconstructed using either CD44high and CD44low profiles were superimposed and the edges colour-coded according to whether each edge was identified only in the CD44high (blue), the CD44low (orange) or both (dark grey) networks. Nodes in the three larger communities were colour-coded accordingly. e Fraction of edges identified in the CD44high, the CD44low or both networks, for each one of the three communities shown in (d). Similarity between CD44high and CD44low networks is also shown. f Enrichment analysis using the hallmark gene sets across the three communities shown in (d)
Fig. 4
Fig. 4
Single-cell transcriptomics identifies pre-adapted cells. a Dimensionality reduction of single-cell transcriptional profiles of oestrogen-supplemented (+E2; top) or deprived (−E2; 2 days) cells. Pre-adapted (PA) cells highlighted in boxes. b PA cells identification using two different strategies (SWNE and Random Forests). DEGs:  differentially expressed genes. Box plots show median, interquartile values, range and outliers (individual points). c Copy number profiles of PA cells (n = 81), along with the same number of LTED, CD44low and CD44high (not PA) cells, as estimated from scRNA-seq profiles. d Sorted PA cells (CD44high and CLDN1high) stably labelled with mKate2 were mixed with other plastic cells (CD44high and CLDN1low) stably labelled with GFP (scale bar = 400 μm) and followed up for 7 days upon E2 deprivation (e)
Fig. 5
Fig. 5
Functional characterisation of the signature of pre-adapted (PA) cells. a Hallmark gene sets enriched in genes either up- or downregulated in pre-adapted (PA) cells. b Correlation analysis between expression of cell-cycle marker genes and genes belonging to the PA signature (upregulation) at the single-cell level. rs = Spearman’s rank correlation coefficient. c Same representation as in Fig. 3d, but limited to community 1. Two sub-communities were identified (left) with community 1.1 being more strongly enriched for genes in the PA signature (p-value from hypergeometric test)
Fig. 6
Fig. 6
Features of pre-adaptation persist in acute-ET, but not in full resistance. a Sampling design along with dimensionality reduction of single-cell transcriptional profiles of E2 supplemented (day 0) or deprived (days 2, 4 and 7). b AUCell quantification of the fraction of single-cells showing transcriptome compatible with either the pre-adapted (left) or the LTED (right) signatures. c Selected gene set enrichment across all conditions profiled in this study. d Score distributions for the indicated gene sets, across cells. e Multi-marker tracing profiles for selected genes (box plots) in CD44high and CD44low cells upon E2 deprivation. Survival (as relative number of residual cells) is also shown (bar plots). Box plots show median, interquartile values, range and outliers (individual points)
Fig. 7
Fig. 7
Evidence for pre-adaptation in T47D and circulating tumour cells. a Bi-dimensional representation of 15,805 transcriptomes from single T47D and LTED cells (Supplementary Table 2) (SWNE; k = 20). b Dimensionality reduction of single-cell transcriptional profiles of oestrogen-supplemented (+E2; top) or deprived (−E2; 2 days) T47D-CD44high cells. Pre-adapted (PA) cells highlighted in boxes. c (Top) Venn diagrams showing the overlap between the MCF7-PA and T47D-PA signatures (upregulated genes in red; downregulated in blue). P-values of the overlaps calculated via hypergeometric test. (Bottom) Box plots indicating the effect size (AUC) of those genes unique to either MCF7- or T47D-PA or common to both. **p <= 1e-5 (Wilcoxon rank-sum test). d Expression of the PA signature in circulating tumour cells (CTCs) compared with blood specimens from healthy donors. e Expression of the PA, the epithelial-to-mesenchymal transition (EMT) and a cell-cycle signatures in clusters of CTCs compared with single CTCs. False discovery rates estimated by permutations. Box plots show median, interquartile values, range and outliers (individual points)
Fig. 8
Fig. 8
Proposed multi-step model of resistance to endocrine therapies. (Left to right). A hierarchy of cells with or without features of plasticity (in blue and brown) co-exist in the primary tumour and in the micro-metastases (large and small green circles, respectively). These cells are already positioned on a gradient of probability to survive to future exposure to endocrine therapies (light green box). Upon surgery and start of adjuvant treatment (−E2), only a handful of plastic cells is able to survive (light blue boxes). These cells enrich for the transcriptional signature of pre-adaptation identified in this work, and in turn are those able to accumulate those genetic hits and further transcriptional re-wiring observed in the fully resistant cells, which eventually lead to metastasis (large blue circle)

References

    1. Early Breast Cancer Trialists’ Collaborative Group (EBCTCG) et al. Relevance of breast cancer hormone receptors and other factors to the efficacy of adjuvant tamoxifen: patient-level meta-analysis of randomised trials. Lancet378, 771–784 (2011). - PMC - PubMed
    1. Early Breast Cancer Trialists’ Collaborative Group (EBCTCG Aromatase inhibitors versus tamoxifen in early breast cancer: patient-level meta-analysis of the randomised trials. Lancet. 2015;386:1341–1352. doi: 10.1016/S0140-6736(15)61074-1. - DOI - PubMed
    1. Asselain B, et al. Long-term outcomes for neoadjuvant versus adjuvant chemotherapy in early breast cancer: meta-analysis of individual patient data from ten randomised trials. Lancet Oncol. 2018;19:27–39. doi: 10.1016/S1470-2045(17)30777-5. - DOI - PMC - PubMed
    1. Pan H, et al. 20-Year risks of breast-cancer recurrence after stopping endocrine therapy at 5 years. N. Engl. J. Med. 2017;377:1836–1846. doi: 10.1056/NEJMoa1701830. - DOI - PMC - PubMed
    1. Casasent AK, et al. Multiclonal invasion in breast tumors identified by topographic single cell sequencing. Cell. 2018;172:205–217.e12. doi: 10.1016/j.cell.2017.12.007. - DOI - PMC - PubMed

Publication types

MeSH terms

Substances