. 2019 Sep 2;10(1):3959.
doi: 10.1038/s41467-019-11906-2.

Tumor-reprogrammed resident T cells resist radiation to control tumors

Affiliations

Tumor-reprogrammed resident T cells resist radiation to control tumors

Ainhoa Arina et al. Nat Commun. .

Abstract

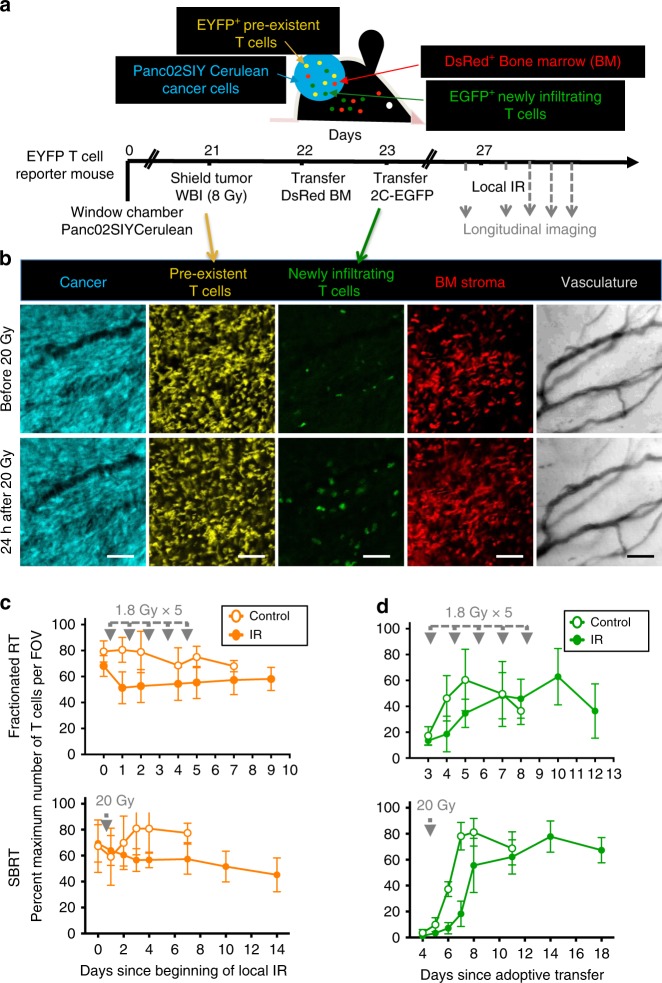
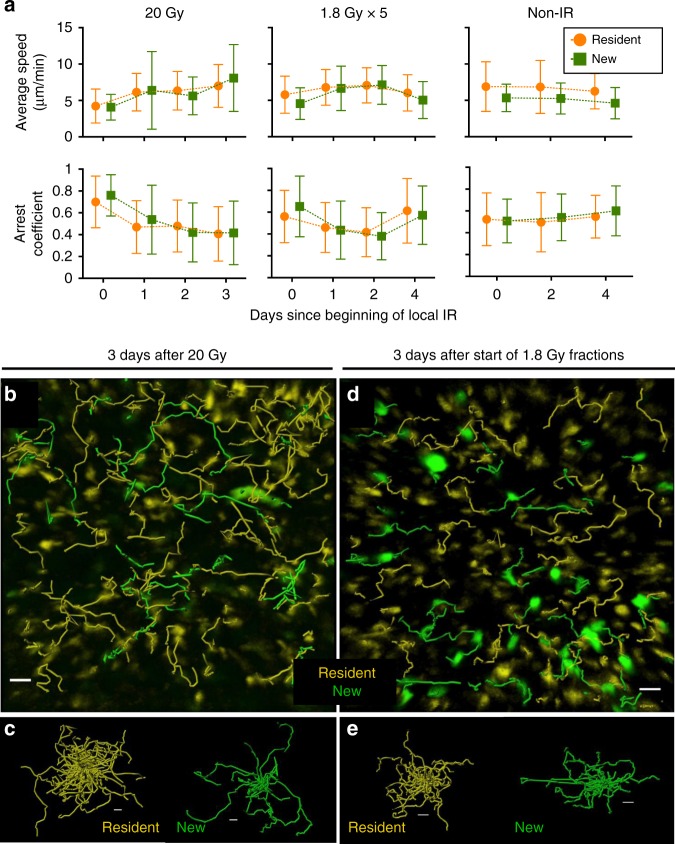
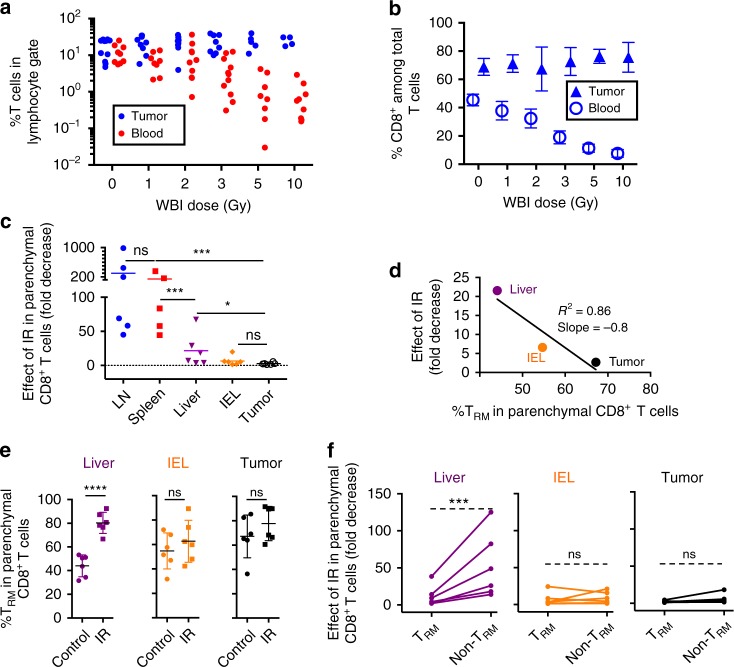
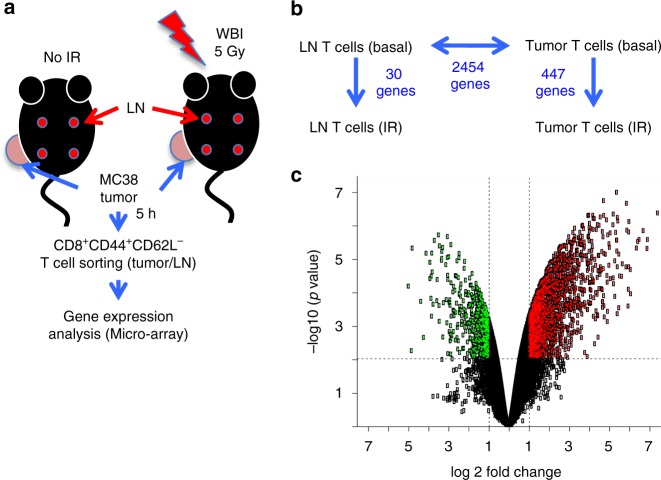
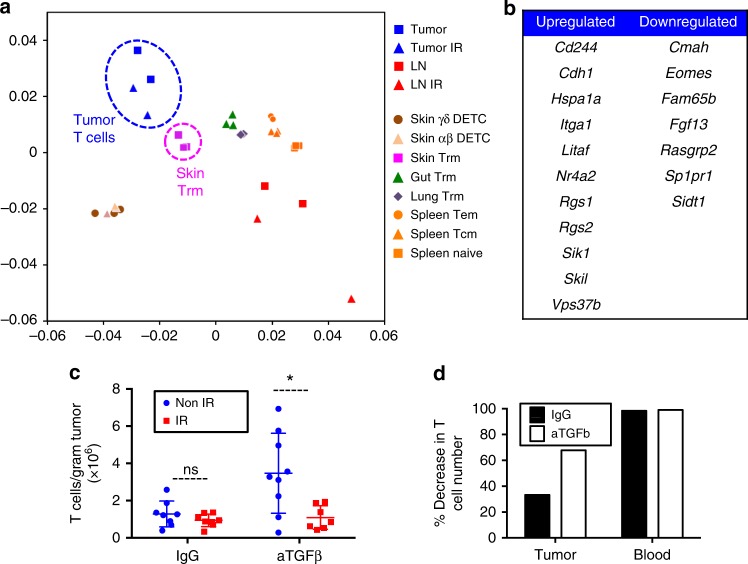
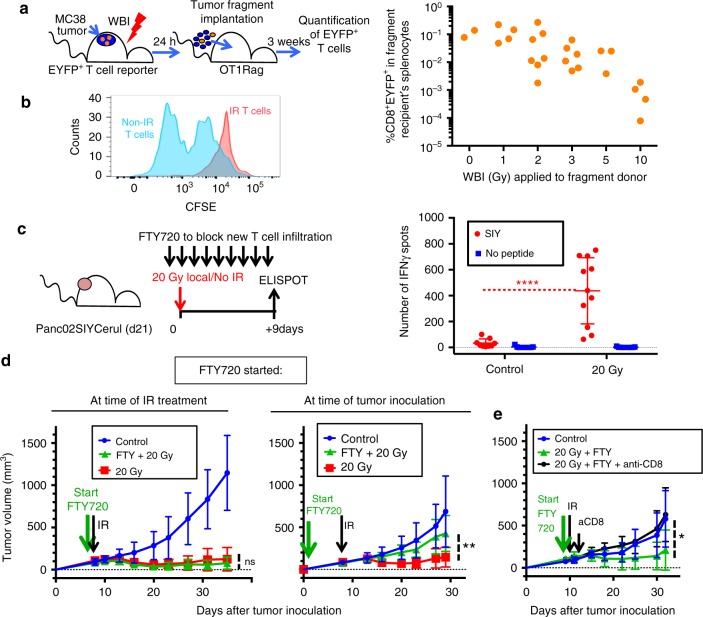
Successful combinations of radiotherapy and immunotherapy depend on the presence of live T cells within the tumor; however, radiotherapy is believed to damage T cells. Here, based on longitudinal in vivo imaging and functional analysis, we report that a large proportion of T cells survive clinically relevant doses of radiation and show increased motility, and higher production of interferon gamma, compared with T cells from unirradiated tumors. Irradiated intratumoral T cells can mediate tumor control without newly-infiltrating T cells. Transcriptomic analysis suggests T cell reprogramming in the tumor microenvironment and similarities with tissue-resident memory T cells, which are more radio-resistant than circulating/lymphoid tissue T cells. TGFβ is a key upstream regulator of T cell reprogramming and contributes to intratumoral Tcell radio-resistance. These findings have implications for the design of radio-immunotherapy trials in that local irradiation is not inherently immunosuppressive, and irradiation of multiple tumors might optimize systemic effects of radiotherapy.


Conflict of interest statement

The authors declare no competing interests.

Figures

Fig. 1
Fig. 1
New as well as IR-resistant preexisting T cells contribute to T cells found in irradiated tumors. a Experimental design for longitudinal imaging of locally irradiated tumors. Panc02SIYCerulean cancer cells were injected s.c. into T cell reporter (Lck-EYFP) mice bearing dorsal window chambers. On day 21, mice received 8 Gy WBI while tumors were shielded, to deplete peripheral T cells and preserve preexistent intratumoral EYFP+ T cells. Following bone marrow reconstitution with DsRed+Rag−/− cells, EGFP+ 2C CD8+ T cells specific for the SIY tumor antigen were adoptively transferred. Three to four days after 2C transfer, mice received different treatment schedules of IR or no local IR (control mice). b Images are from a representative tumor region before and 24 h after treatment with 20 Gy (×20, scale bar: 100 μm). c, d Experiments were performed using two IR schedules modeling fractionated IR (5 doses, 1.8 Gy each) and SBRT (a single dose of 20 Gy). Preexisting EYFP+ (c) and newly infiltrating EGFP+ (d) T cell numbers were determined over time in multiple optical regions per mouse and normalized to the maximum count observed for each T cell type (averages and SD shown). Number of optical regions (N) was as follows (time after IR; N in control mouse, N in IR mouse): (d0; 7, 8–d1; 7, 7–d2; 7, 9–d4; 9, 10–d5; 9, 10–d7; 6, 10–d9; NA, 9) for the 1.8 Gy × 5 experiment, and (d0; 11, 19–d1; 10, 19–d2; 10, 19–d3; 10, 20–d4; 7, 21–d7; 10, 7–d10; NA,11–d14; NA, 9) for the 20 Gy × 1 experiment. The average EYFP (and EGFP) counts over time were positive with a 95% confidence level using quadratic or linear regression models, thus proving that IR did not deplete T cells. Data are representative of two independent longitudinal experiments performed for each treatment modality
Fig. 2
Fig. 2
Preexistent intratumoral T cells maintain their motility after IR. T cell motility was analyzed in the experiments from Fig. 1. a The motility of irradiated preexisting EYFP+ cells is comparable to newly infiltrating T cells present in the same tumor regions, as evidenced by similar average speeds and arrest coefficients at any time point analyzed. Data are from 20 to 25 min movies and 21 to 35 μm deep optical sections (Z-stack). Comparisons for average speed and arrest coefficient between preexistent and new T cells were non-significant at all time points post-IR (unpaired t-test). The number (N) of cell tracks quantified was as follows (day after beginning of IR; N preexistent T cells, N new T cells): 20 Gy mouse (d0; 204, 10–d1; 216, 18–d2; 184, 40–d3; 114, 33), 1.8 Gy × 5 mouse (d0; 471, 56–d1; 238, 62–d2; 149, 51–d4; 232, 53), Non-IR (d0; 206, 36–d2; 207, 86–d4; 254,104). b, d Tracks followed by preexistent (yellow) and new (green) T cells within the same tumor region 3 days after IR. c, e Spider plots show separately preexistent and new T cell tracks, from b and d, respectively. Scale bars: 50 μm
Fig. 3
Fig. 3
Increased radio-resistance of T cells within tumors and non-lymphoid solid organs compared with circulating T cells and T cells from lymphoid organs. a EYFP+ T cell reporter mice bearing established MC38 tumors received different doses of WBI, as indicated. Twenty-four hours later, survival of T cells in tumors vs. circulation was determined by flow cytometry (gating in Supplementary Fig. 5). The tumor/blood slopes were significantly different (P = 0.02) by linear regression analysis. b Percentage of CD8+ cells among total tumor and blood T cells from the experiment shown in a. % CD8+ cells in blood was significantly lower after all WBI doses tested compared to unirradiated mice (P = 0.01 at 1 Gy, <0.001 for the rest, unpaired t-test). In tumors, differences were not significant or % CD8+ T cells was higher in irradiated compared to unirradiated mice (P = 0.03 at the 5 Gy dose). Data in a and b were pooled from three independent experiments comparing tumor and blood and one additional experiment with data only from blood. In a, each dot represents an individual mouse whereas b shows average and SD. cf C57BL/6 mice bearing established (3 weeks) MC38 tumors were treated with 8 Gy WBI (IR) or left untreated (control). Twenty-four hours later, absolute numbers of parenchymal (i.v. antibody-negative) CD8+ T cells per gram were determined for the organs and tissues indicated, and fold decrease was calculated in each irradiated mouse and tissue relative to the average number of T cells per gram of tissue in unirradiated mice in the same experiment. Data are pooled from two independent experiments, N = 6 total mice per organ and condition. c shows averages, P values by ratio t-test. Exact P values in Supplementary Table 1. d Average fold decrease in parenchymal CD8+ T cells was plotted against the %TRM in each non-lymphoid solid organ and analyzed by linear regression. e Percent of cells with TRM phenotype (CD103+CD69+ for IEL, tumor, and CD69+LFA1+ for liver) in each organ in mice that received or not IR (average and SD, P values by unpaired t-test). f Effect of IR on TRM vs. non-TRM CD8+ cells (ratio-paired t-test). n.s., non-significant; ***P ≤ 0.001; ****P ≤ 0.0001
Fig. 4
Fig. 4
Transcriptional reprogramming of T cells in the tumor microenvironment. a Experimental scheme. b Overview of differential gene expression between the four groups compared. c Volcano plot showing the overall number of genes up- (red) or down-regulated (green) in tumor T cells compared with LN T cells (basal, i.e. unirradiated mice), and the magnitude of the change
Fig. 5
Fig. 5
Intratumoral T cells are transcriptionally similar to TRM and are more sensitive to IR in mice treated with anti-TGFβ antibodies. Gene expression data from LN vs. tumor T cells (Fig. 4) was compared to published data on gene expression differences between TRM cells and spleen memory T cells (GEO GSE47045) to estimate similarity across all samples. a PCA-style plot shows that tumor T cells were phenotypically closest to skin and other TRM, whereas LN T cells were closest to spleen naïve or memory T cells. b Eighteen of 37 genes from the published TRM signature were differentially expressed also in intratumoral T cells. c Total CD3+ T cells were quantified 24 h after 8 Gy WBI of mice bearing established MC38 tumors that had been treated or not with anti-TGFβ blocking antibodies every 2–3 days starting 2 days after tumor cell inoculation until day of sacrifice. Data are pooled from two independent experiments with a total of nine mice per group. The plot shows mean and SD. n.s., non-significant; *P = 0.01 (unpaired t-test). Each dot represents an individual mouse. d The effect of IR in mice from c was calculated as percent decrease in the average number of T cells per gram of tumor. The percent decrease in the average number of T cells per microliter of blood in a subset of mice from c that were bled before sacrifice (N = 3–4 per condition) is shown as a reference
Fig. 6
Fig. 6
Irradiated intratumoral T cells produce IFNγ and mediate the therapeutic effects of 20 Gy in the absence of new T cell infiltration. a Tumor fragments from irradiated T cell reporter mice in Fig. 1 were transplanted into immunodeficient hosts 24 h after WBI. Three weeks later, the number of EYFP+ T cells that originated from the transplanted fragments was determined in the spleens of the recipient animals. Linear regression analysis showed a significant dose-dependent decrease (Y = −0.01092*X + 0.09094, P = 0.0131) b MC38 tumor-infiltrating CD8+ T cells were isolated from mice treated with 5 Gy WBI or non-irradiated, labeled with CFSE and stimulated with antiCD3/CD28 beads to measure their proliferation. Data are from T cells from three mice pooled per group and representative of two independent experiments. c IFNγ production by T cells purified from irradiated Panc02SIYCerulean tumors 9 days after 20 Gy local IR, by ELISPOT. Mice were treated with FTY720 every 24 h starting 24 h before IR to prevent new T cell infiltration. Data are pooled from three independent experiments with N = 9 (control) and N = 11 (20 Gy) total animals per group. ****P < 0.0001, Mann–Whitney test. d B6 mice bearing MC38 s.c. tumors were treated at days 8–9 after tumor cell inoculation with 20 Gy local IR. Some mice also received 20 μg FTY720 every 24 h, starting 3 h before IR or at the time of tumor inoculation, and until the last data point. **P = 0.0075. N = 8 mice per group. e Mice treated with FTY720 starting 3 h before IR, received a single dose of anti-CD8 depleting antibodies 24 h after IR. *P = 0.05 (d, e, unpaired t-test); data in c and e show average and SD

References

    1. Trowell OA. The sensitivity of lymphocytes to ionising radiation. J. Pathol. Bacteriol. 1952;64:687–704. doi: 10.1002/path.1700640403. - DOI - PubMed
    1. Scott, C. M. Some quantitative aspects of the biological action or X and y rays. Special Report Series Vol. 223 (Medical Research Council, Great Britain, 1937).
    1. Schrek R. Primary and secondary vacuoles in thymic cells exposed in vitro to X-rays. J. Cell Comp. Physiol. 1947;30:203–224. doi: 10.1002/jcp.1030300302. - DOI - PubMed
    1. Schrek R. Cytologic changes in thymic glands exposed in vivo to X-rays. Am. J. Pathol. 1948;24:1055–1065. - PMC - PubMed
    1. Anderson RE, Warner NL. Ionising radiation and the immune response. Adv. Immunol. 1976;24:215–335. doi: 10.1016/S0065-2776(08)60331-4. - DOI - PubMed

Publication types

MeSH terms

Substances