Comparative Study
. 2019 Sep 2;9(1):12641.
doi: 10.1038/s41598-019-49067-3.

Label-free Imaging of Tissue Architecture during Axolotl Peripheral Nerve Regeneration in Comparison to Functional Recovery

Affiliations
Comparative Study

Label-free Imaging of Tissue Architecture during Axolotl Peripheral Nerve Regeneration in Comparison to Functional Recovery

Ortrud Uckermann et al. Sci Rep. .

Erratum in

Abstract

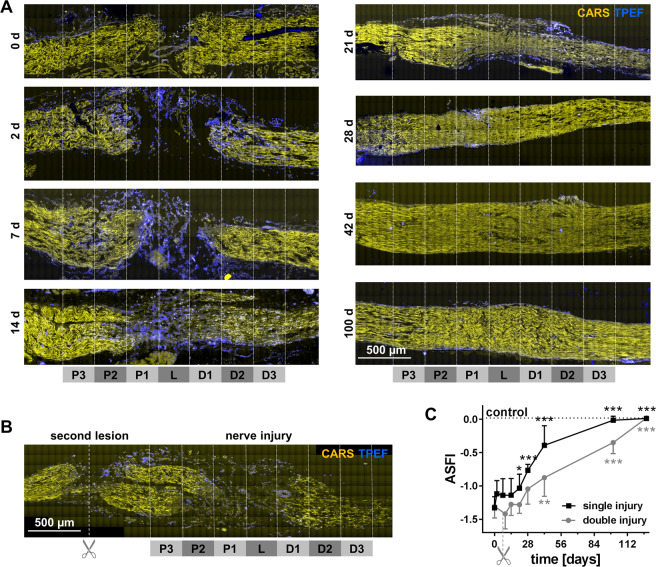
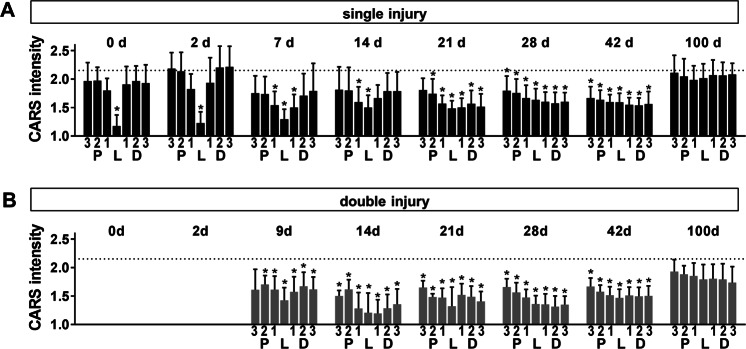
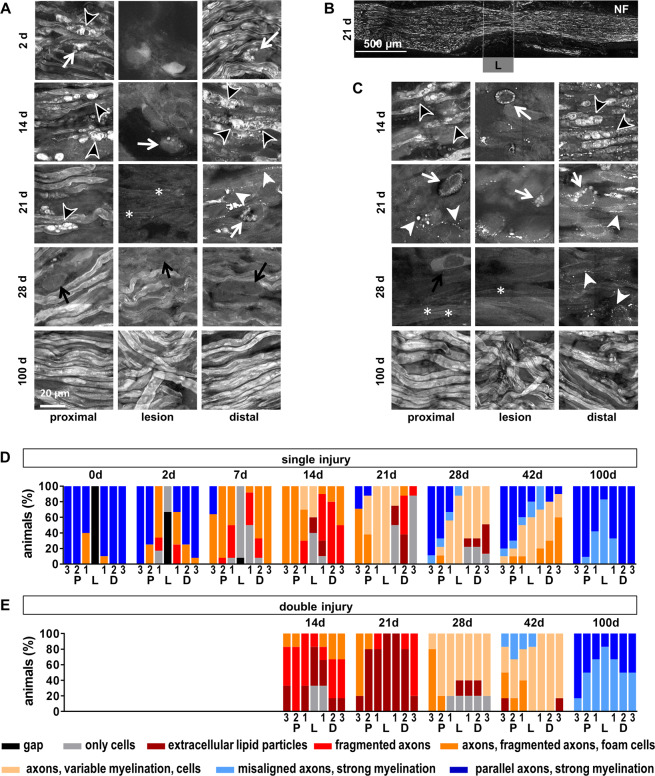
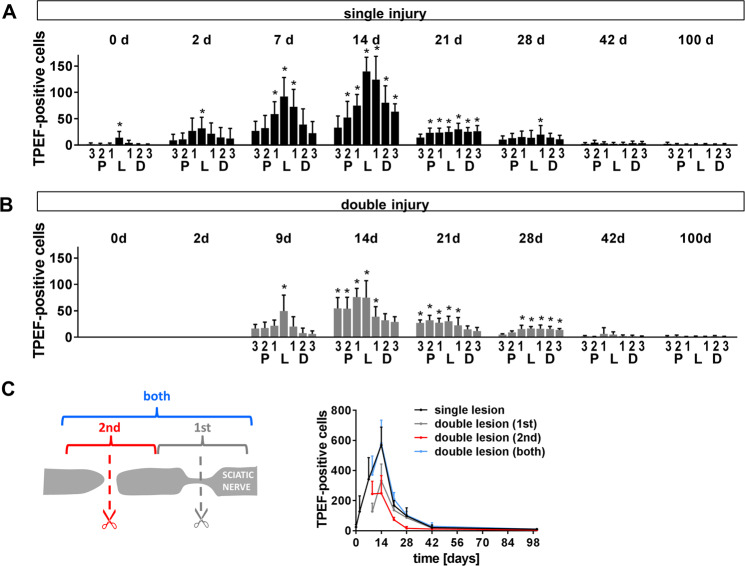
Human peripheral nerves hold the potential to regenerate after injuries; however, whether a successful axonal regrowth was achieved can be elucidated only months after injury by assessing function. The axolotl salamander is a regenerative model where nerves always regenerate quickly and fully after all types of injury. Here, de- and regeneration of the axolotl sciatic nerve were investigated in a single and double injury model by label-free multiphoton imaging in comparison to functional recovery. We used coherent anti-Stokes Raman scattering to visualize myelin fragmentation and axonal regeneration. The presence of axons at the lesion site corresponded to onset of functional recovery in both lesion models. In addition, we detected axonal regrowth later in the double injury model in agreement with a higher severity of injury. Moreover, endogenous two-photon excited fluorescence visualized macrophages and revealed a similar timecourse of inflammation in both injury models, which did not correlate with functional recovery. Finally, using the same techniques, axonal structure and status of myelin were visualized in vivo after sciatic nerve injury. Label-free imaging is a new experimental approach that provides mechanistic insights in animal models, with the potential to be used in the future for investigation of regeneration after nerve injuries in humans.


Conflict of interest statement

The authors declare no competing interests.

Figures

Figure 1
Figure 1
Intact sciatic nerve visualized using label-free multiphoton microscopy. (A) Intense CARS signal of aligned axons. Arrow indicates single cell with endogenous fluorescence. (B) Blood vessel adjacent to axonal tracts. Arrowheads indicate erythrocytes; arrows indicate blood cells with endogenous fluorescence. Single channel information for CARS and TPEF and overlay of CARS (yellow) and TPEF (blue).
Figure 2
Figure 2
Label-free multiphoton microscopy of the axolotl sciatic nerve and functional outcome after injury. (A) CARS/TPEF-images of sciatic nerve longitudinal sections at different time points after nerve injury (single injury model) (B) CARS/TPEF image of the sciatic nerve nine days after injury and two days after second lesioning (double injury model). The regions for quantitative analysis are indicated in A and B: P3-1: proximal 3-1; L: lesion; D1-3: distal 1-3. (C) Axolotl sciatic nerve functional index (ASFI) for both injury models. Dotted line indicates ASFI of animals without injury (control). Asterisks indicate significant differences to the ASFI at 0d, i. e. directly after injury (*P < 0.05, **P < 0.01, ***P < 0.001; one way ANOVA followed by Bonferroni’s multiple comparisons test).
Figure 3
Figure 3
CARS signal intensity after sciatic nerve injury. Normalized CARS signal intensity in regions proximal to the lesion (P 3-1), distal to the lesion (D 1-3) and within the lesion (L) as indicated in Fig. 2A/B at different time points after initial injury of the sciatic nerve. (A) single injury model (B) double injury model. Bars show mean and SD. Dotted line indicates CARS intensity of intact control nerve. Asterisks indicate significant differences vs. control (P < 0.05, one way ANOVA followed by Bonferroni’s multiple comparisons test).
Figure 4
Figure 4
Micromorphology of the regenerating nerve shown by CARS. (A) CARS images at different time points after sciatic nerve dissection as indicated for single injury model. Representative examples proximal to the lesion, at the lesion and distal to the lesion. (B) Reference immunohistochemistry for neurofilament H of the axolotl sciatic nerve 21 d after injury. The region of the lesion is indicated (L) C: CARS images at different time points after sciatic nerve dissection as indicated for double injury model. White arrows: Cells with intracellular lipid droplets, black arrows: Cells, white arrowheads: Extracellular lipid droplets, black arrowheads: Ovoids, asterisk: Not/weakly myelinated axons. (D/E) Semi quantitative analysis of the micromorphology based on CARS imaging in the single (D) and double (E) injury model using a scoring system. Quantification was performed in seven regions along the nerve (P3-1, L, D1-3, indicated in Fig. 2A/B). The bars indicate the percentage of samples that fall in the given categories.
Figure 5
Figure 5
Endogenous TPEF signal. Immunohistochemical staining for the macrophages marker Iba-1 in comparison to TPEF (A) Overview image (same sample as shown in Fig. 2) two days after sciatic nerve dissection. Magnifications of the position indicated are shown in (B) (P: proximal, L: lesion, D: distal) (B/C) Cellular comparison of endogenous TPEF and Iba-1 immunohistochemistry proximal, distal and within the lesion 2 d and 14 d after injury (D) CARS channel and composite images of CARS and TPEF of the areas shown in C. arrows: Iba-1-negative fluorescent cells; arrowheads: cells with fluorescent cytoplasmic inclusions.
Figure 6
Figure 6
Changes in TPEF-positive cells after sciatic nerve injury. (A) Number of TPEF-positive cells in regions proximal to the lesion (P3, P2, P1), distal to the lesion (D1, D2, D3) and within the lesion (L) at different time points after initial injury of the sciatic nerve. (A) single injury model (B) double injury model. Bars show mean and SD. Asterisks indicate significant differences vs. control (intact nerve). (C) Total number of TPEF positive cells (sum of all regions investigated) at different time points after nerve transection (mean and SD).
Figure 7
Figure 7
In vivo multiphoton imaging. (A) Intact sciatic nerve. Inset shows a Schmidt-Lanterman incisure (B) Examples of sciatic nerve micromorphology 7 d and 14 d after transection. (C) Overview image of the sciatic nerve 14 d after transection reconstructed from Z-stack. Composite images of CARS (yellow) and TPEF (blue). White arrows: TPEF-positive cells; black arrowheads: ovoids; black arrows: foam cells; white arrowheads: extracellular lipids.

References

    1. Scholz T, et al. Peripheral Nerve Injuries: An International Survey of Current Treatments and Future Perspectives. Journal of Reconstructive Microsurgery. 2009;25:339–344. - PubMed
    1. Seddon HJ. Three types of nerve injury. Brain. 1943;66:237–288.
    1. Sunderland SYDN. A classification of peripheral nerve injuries producing loss of function. Brain. 1951;74:491–516. - PubMed
    1. Palispis WA, Gupta R. Surgical repair in humans after traumatic nerve injury provides limited functional neural regeneration in adults. Exp. Neurol. 2017;290:106–114. - PubMed
    1. Stoll G, Jander S, Myers RR. Degeneration and regeneration of the peripheral nervous system: from Augustus Waller’s observations to neuroinflammation. J Peripher. Nerv. Syst. 2002;7:13–27. - PubMed

Publication types

MeSH terms